arXiv:1506.05074v4 [hep-ex] 15 Jun 2016
EUROPEAN ORGANISATION FOR NUCLEAR RESEARCH (CERN)
Submitted to: PRD CERN-PH-EP-2015-108
June 16, 2016
Measurements of the top quark branching ratios into channels
with leptons and quarks with the ATLAS detector
The ATLAS Collaboration
Abstract
Measurements of the branching ratios of top quark decays into leptons and jets using events with tt (top antitop) pairs are reported. Events were recorded with the ATLAS detector at the LHC in pp collisions at a center-of-mass energy of 7 TeV. The collected data sample corresponds to an integrated luminosity of 4.6 fb−1. The measured top quark branching ratios agree with the Standard Model predictions within the measurement uncertainties of a few percent.
c
2016 CERN for the benefit of the ATLAS Collaboration.
Contents
1 Introduction 3
2 Analysis Overview 3
3 ATLAS Detector 4
4 Data and Monte Carlo Samples 5
5 Event Selection 5
6 Single-lepton + jets channel 7
6.1 Background templates 8
6.2 Fits to mass distributions 10
7 Dilepton + jets channel 15
8 Lepton+τhad+jets channel 18
8.1 Tau background templates 18
8.2 Signal extraction by fitting to BDTjshape 20
8.3 Fit results 21
9 Measuring Cross Section and Branching Ratios 23
10 Systematic Uncertainties 26
11 Results 30
1 Introduction
In the Standard Model (SM), 100% of the top quark decays contain a W boson and a down-type quark. Measurements of the ratio of top branching fractions B(t→ W+b-quark)/B(t → W+down-type quark) [1] and of single top production [2–4] have shown that more than 95% of the decays are to a W boson and a b-quark. In the SM the branching ratio to the different leptons is the same since the decay proceeds via a W boson , but in models of new physics, e.g. supersymmetry (SUSY), final states with τ leptons can be enhanced or suppressed [5]; thus measuring the inclusive cross section using final states with τ leptons can be a good probe for new physics. The measured values of the top quark branching ratios will deviate with respect to the SM predictions if the data sample selected to extract tt events contains final states without two W bosons. Examples of processes that would cause deviations include events with a top quark decaying to charged Higgs boson or with SUSY particles decaying to the supersymmetric partner of the τ lepton (˜τ). Limits on the top quark branching ratio to a charged Higgs boson and a b-quark have been published by the CDF [6], D0 [7,8], ATLAS [9,10] and CMS [11] collaborations. Another example of a final state that can change the observed branching ratios is the pair production of supersymmetric partners of the top quark (˜t) decaying into bντ˜τ followed by the ˜τ decay into a τ lepton
and the gravitino, predicted by gauge-mediated SUSY breaking models [12].
This article presents the first direct measurement of the top quark semileptonic and all-hadronic branch-ing ratios. The branchbranch-ing ratios can be more sensitive probes of deviations from SM expectations than measuring cross sections in different channels, because of cancellation of systematic uncertainties. The large number of tt pairs produced at the LHC provides an opportunity to measure top quark branching ratios with high precision. These top quark branching ratios are expected to be determined by the W boson branching ratios, which have been measured at LEP [15] to be in good agreement with the SM expectations [16]. Observing any deviation would be an indication of non-SM processes contributing to final states dominated by tt production. This article also presents a measurement of the inclusive tt cross section using events with an isolated charged lepton (µ or e) and a τ lepton decaying hadronically (τhad).
Previous measurements of the cross section at √s = 7 TeV in this channel have been published by the ATLAS and CMS collaborations [13,14].
The analysis uses the full data sample, 4.6 fb−1, collected by the ATLAS experiment at the LHC from pp collisions at √s = 7 TeV between March and November 2011. Kinematic selection criteria are applied that require one or both of the top and antitop quarks to decay into a final state with one isolated lepton and a jet. At least one jet in the event must be tagged as originating from a b-quark (b-tag). Seven mutually exclusive final states are used in this analysis: e+jets, µ+jets, ee+jets, µµ+jets, eµ+jets, eτhad+jets and
µτhad+jets. Branching ratios for semileptonic and purely hadronic top quark decays are obtained by
combining these seven final states assuming that only SM processes contribute to the background and the top branching ratios to leptons and jets add up to one.
2 Analysis Overview
Data samples enriched with tt events are selected by means of criteria that are designed to accept two W bosons and at least one b-quark. In every event, either an electron or a muon is required, with the aim to select W → ℓν, where ℓ stands for either e or µ. The ℓ may be produced directly in W → ℓν boson decays or indirectly in W → τν decays. Separate event channels are classified depending on the decay of a second W boson: W → jets for ℓ+jets, W → ℓν for ℓℓ′+jets, or W → τhadνfor ℓτhad+jets. Since
the analysis does not distinguish electrons or muons that originate from a τ lepton decay from those that come from direct W→ eν and W → µν decays, both are included in the W → ℓν decays. The branching ratios are measured by taking ratios of the number of tt events extracted from the three channels; thus an important aspect of the event selection is to use similar criteria for the object selection in all final states, so as to allow the cancellation of systematic uncertainties in the ratios. Another important criterion is to ensure that no event contributes to more than one channel. The channel with the largest background and smallest number of signal events is that containing ℓτhad+jets; thus the event selection and analysis were
optimized to reduce the uncertainty in that channel (see Sec.5).
The number of tt events in a given channel is extracted by fitting background and signal templates to data distributions. The template shapes are fixed while their normalizations are allowed to vary. The signal templates are derived from tt Monte Carlo (MC) simulation, which assumes that the top quark decays to a W boson and a b-quark with a 100% branching ratio. This assumption affects the shape of the signal templates, and if it is not valid for the selected data, the measured branching ratios will deviate from the SM prediction. The amount of background varies significantly in each channel. It is almost negligible in the eµ+jets channel and larger than the signal in the ℓτhad+jets channels. In the ℓ+jets channels,
three invariant masses from two- and three-jet systems and a transverse mass distribution are fitted, as described in detail in Sec.6, while in the ℓℓ′+jets channels the dilepton effective mass distributions from two different missing transverse momentum (EmissT ) regions are used (see Sec. 7). Because of the much larger background, which originates from jets misidentified as τ leptons, a very different approach is taken in the ℓτhad+jets channel. Instead of fitting a kinematic distribution, the quantity fitted is a boosted
decision tree (BDT) output [17], a multivariate discriminant that separates jets from τ leptons decaying to hadrons (see Sec.8).
The details of how the inclusive production cross section and branching ratios are derived from the number of tt events obtained from each channel are discussed in Sec. 9. The systematic uncertainties of the measurements are estimated by varying each source of systematic uncertainty by±1σ in templates derived from MC simulation and fitting all the distributions with the new templates (see Sec.10). The final results are given in Sec.11.
3 ATLAS Detector
The ATLAS detector [18] at the LHC covers nearly the entire solid angle around the collision point.1
It consists of an inner tracking detector surrounded by a thin superconducting solenoid, electromagnetic (EM) and hadronic calorimeters, and an external muon spectrometer incorporating three large supercon-ducting toroid magnet assemblies. The inner tracking detector provides tracking information in a pseu-dorapidity range|η| < 2.5. The liquid-argon (LAr) EM sampling calorimeters cover a range of |η| < 3.2 with fine granularity. An iron/scintillator tile calorimeter provides hadronic energy measurements in the central rapidity range (|η| < 1.7). The endcap and forward regions are instrumented with LAr calorimeters for both the EM and hadronic energy measurements covering|η| < 4.9. The muon spectrometer provides precise tracking information in a range of|η| < 2.7.
In 2011, ATLAS used a three-level trigger system to select events. The level-1 trigger is implemented in hardware using a subset of detector information to reduce the event rate to less than 75 kHz. This is followed by two software-based trigger levels, namely level-2 and the event filter, which together reduce the event rate to about 300 Hz recorded for analysis.
4 Data and Monte Carlo Samples
The present measurements use collision data with a center-of-mass energy of √s = 7 TeV taken in 2011 and selected with a single-electron or a single-muon trigger. Taking into account selection criteria for good data quality, the total integrated luminosity for the analyzed data sample is 4.6 fb−1.
The t¯tsignal is modeled using the POWHEG [19,20] event generator, interfaced to PYTHIA6 (v6.421) [21] with the Perugia 2011C tune [22] for showering and hadronization, setting the top quark mass to 172.5 GeV and using the next-to-leading-order (NLO) parton distribution function (PDF) set CTEQ66 [23]. The tt production cross section used in the simulation is normalized to 177 pb as obtained from next-to-next-to-leading-order (NNLO) plus next-to-next-to-leading-logarithm (NNLL) calculations [24].
The calculation of the backgrounds uses MC simulations of W/Z production with multiple jets (matrix elements for the jets production include light quarks, c, ¯c, c¯c, b¯b), single-top-quark, and diboson (WW, WZ, ZZ) events. Single-top-quark events were generated using MC@NLO (v4.01) [25] interfaced with HERWIG (v6.520) [26] and JIMMY (v4.31) [27] to model parton showering, hadronization, and the underlying-event using PDF set CT10 [28]. W+jets events with up to five partons and Z+jets events with m(ℓ+ℓ−) > 40 GeV and up to five partons were generated by ALPGEN [29] (v2.13) interfaced to HERWIG plus JIMMY and the CTEQ6L1 [30] PDF set. The MLM matching scheme [31] of the ALPGEN generator is used to remove overlaps between matrix-element and parton-shower products. Diboson events were generated using HERWIG plus JIMMY and the MRSTMcal PDF set [32]. Scale factors are applied to each process to match next-to-leading-order predictions. The τ decays are handled by TAUOLA [33].
All samples of simulated events include the effect of multiple pp interactions in the same and neighboring bunch crossings (pile-up). On average, nine minimum-bias events are overlaid on all simulated events to match the pile-up conditions in data. The average number of pp collisions in a bunch crossing (<µ>) de-pends on the instantaneous luminosity, which increased over time; <µ> varied from 5 at the beginning of the run period to approximately 18 at the end. The events are reweighted in order to make the distribution of the average number of interactions per bunch crossing match the one observed in data. All MC events are simulated with a detailed GEANT4-based detector simulation [34,35] and are reconstructed with the same algorithms as used in data.
5 Event Selection
Events are selected using a single-muon trigger with a pTthreshold of 18 GeV or a single-electron trigger
with a ET threshold of 20 GeV, rising to 22 GeV during periods of high instantaneous luminosity. The
pTand ETcriteria used in the further analysis guarantee a high and constant trigger efficiency. The same
triggers and reconstructed object definitions are applied to all channels.
Muon candidates are selected using tracks from the inner detector matched with tracks in the muon spectrometer [36]. They are required to have pT >20 GeV and|η| < 2.5 and to satisfy criteria designed to
reduce the muon misidentification probability. The muon must have a longitudinal impact parameter (z0)
with respect to the primary vertex of less than 2 mm. In addition, to suppress muons from heavy-quark decays, muons must pass the isolation cuts: the calorimeter energy in a cone of size ∆R = 0.2 around the muon track must be less than 4 GeV, and the scalar sum of the pT of the tracks reconstructed in the
inner tracker in a cone of ∆R = 0.3 around the muon track must be less than 2.5 GeV. If a muon overlaps within a cone of ∆R = 0.4 with an electron candidate or with a jet, as defined below, it is not considered to be isolated.
Electron candidates are required to satisfy cuts on calorimeter and tracking variables to separate iso-lated electrons from jets [37]. Electrons must fall into the region |ηcluster| < 2.47, where |ηcluster| is the
pseudorapidity of the calorimeter energy cluster associated with the electron, excluding the transition re-gion between the barrel and endcap calorimeters at 1.37 <|ηcluster| < 1.52, and have ET > 25 GeV. The
electrons must also pass an ETisolation cut within a cone of ∆R = 0.2 derived for 90% efficiency along
with a pT isolation cut within a cone of ∆R = 0.3 derived for 90% efficiency for prompt electrons from
Z→ e+e−events. The electron must have z0with respect to the primary vertex of less than 2 mm. Finally,
if the electron lies within a cone of ∆R = 0.4 around the muon or between 0.2 < ∆R≤ 0.4 around a jet as defined below, the object is considered to be a muon or a jet, respectively.
Jets are reconstructed from clustered energy deposits in the calorimeters using the anti-kt [38] algorithm
with a radius parameter R = 0.4. Jets are required to have a transverse momentum pT > 25 GeV and
to be in the pseudorapidity range|η| < 2.5. The summed scalar pT of tracks associated with the jet and
associated with the primary vertex is required to be at least 75% of the summed pTof all tracks associated
with the jet [39]. Any jet close to a good electron, as defined above, is considered to be an electron if it lies within a cone of ∆R = 0.2 around the electron.
Missing transverse momentum (EmissT ) is the magnitude of the vector sum of the x and y components of the cluster energy in the calorimeters. Each cluster is calibrated according to which type of high-pT
object it is matched to, either electrons, jets, muons or photons.
Jets containing b-hadrons (b-jets) are identified (b-tagged) with a multivariate discriminant that exploits the long lifetimes, high masses and high decay multiplicities of b-hadrons. It makes use of track impact parameters and reconstructed secondary vertices. An operating point corresponding to an average effi-ciency of 70% and an average mistag rate for light-quark jets of 0.8% is used [40].
τcandidates are reconstructed using calorimeter jets as seeds. These seed jets are calibrated with the local calibration (LC) scheme [41,42]. The τ candidate must have ETτ >20 GeV,|ητ| < 2.3, and only one
track with pT > 4 GeV associated with the τ candidate (77% of hadronic τ decays have only one track).
The charge of the τ candidate is given by the charge of the associated track. Candidates with higher track multiplicity are not used as they do not improve the precision of the measurement because of much larger associated systematic uncertainties. The analysis makes use of a BDT for τ identification, a cut-based multivariate algorithm that optimizes signal and background separation [17].
The τ candidates that overlap within ∆R < 0.4 of a b-tagged jet, a loose muon,2 or an electron, 3 are rejected and kept as jets or electrons. To remove the remaining electrons misidentified as τ candidates a medium BDT (BDTe) electron veto is applied. BDTe is a BDT trained to distinguish electrons and τ
leptons using a Z→ ττ MC sample as signal and a Z → ℓℓ MC sample as background. The BDTeuses
four variables, the two most powerful being the ratio of high-threshold to low-threshold track hits in the transition radiator and the ratio of energy deposited in the EM calorimeter to the total energy deposited in the calorimeter. The medium working point corresponds to 85% efficiency for Z→ ττ, Ref. [43]. The additional rejection factor for electrons after removing isolated electrons that overlap with τ candidates is 60. In addition, a muon veto that compares the track momentum in τ candidates with the energy deposited in the electromagnetic calorimeter is required to further reduce the muon background. It is tuned to 96% efficiency on signal (62% on background after overlap removal). A BDT to reject hadronic jets faking τ leptons, BDTj, is trained with τ leptons from a Z→ ττ MC sample as signal and jets from data, selected
from events with at least two jets, as background. The BDTj uses eight variables, the most sensitive is
the fraction of energy deposited in the region ∆R < 0.1 with respect to all energy deposited in the region
∆R < 0.2 around the τ candidate. Details of the BDTe and BDTj input variables and performance are
given in Ref. [43].
The event selection requirements common to all channels are a primary vertex with at least five associated tracks with pT > 400 MeV, at least one isolated high-pT muon (pT > 20 GeV) and/or isolated high-pT
electron (pT >25 GeV), at least two jets with pT>25 GeV, and at least one of them tagged as a b-jet. In
addition, there are requirements specific to each channel. For the ℓ+jets channels the isolated-muon pT
threshold is raised from 20 GeV to 25 GeV to reduce the multijet background and exactly one isolated ℓ is required. The minimum number of jets with pT >25 GeV is raised to four. Events with τ candidates
are removed. Removing events with τ candidates from the ℓ+jets channel results in an efficiency loss of 8.5%. For the ℓℓ′+jets channels, events are required to have exactly two isolated ℓ with opposite-sign charges and EmissT > 30 GeV. For the ℓτhad+jets channels, exactly one isolated ℓ, EmissT > 30 GeV, and
at least one τ candidate, are required. In addition the ℓ and the τ candidate must have opposite charge. The τ candidates that do not satisfy these requirements are kept as jets. The thresholds for lepton pT, jet
pT and EmissT were optimized for the ℓτhad+jets channel for maximum signal significance by means of a
search in parameter space.
6 Single-lepton + jets channel
Three different classes of events contribute as a background to the tt→ ℓ+jets channel:
1. events with one isolated ℓ originating from processes with one true lepton (W boson decay); 2. events with one jet misidentified as an isolated lepton and no other isolated lepton reconstructed; 3. events with one isolated lepton originating from processes with multiple true leptons but only one
isolated lepton reconstructed.
2Loose muons are selected with all requirements described in Sec.5for good muons, except pµ
T >4 GeV and no isolation
requirements are applied.
3These electrons are selected with all requirements described in Sec.5for good electrons, but electrons with E
T >20 GeV are
considered.
The number of tt → ℓ+jets events is extracted by fitting distributions of four invariant mass variables with templates for signal and backgrounds. The following mass variables provide good discrimination between signal and background:
1. mj j: invariant mass of the two highest-pTjets not designated as b-jets;
2. mb1 j j: invariant mass of the leading b-jet and the jets used to calculate mj j;
3. mb2 j j: invariant mass of the subleading b-jet and the jets used to calculate mj j;
4. mT: transverse mass of ℓ and the EmissT , mT(ℓ, ETmiss) =
q
(EℓT+ ETmiss)2− (pℓ
x+ Emissx )2− (pℓy+ Emissy )2.
If an event has only one jet tagged as a b-jet, the highest-pT jet that is not tagged is assumed to be a
second b-jet. A few observations motivate the choice of mass distributions for the fit. The presence of a W boson decaying to a pair of quarks leads to a mj j distribution that peaks at the W boson mass. The
presence of a top quark decaying to W(→ qq) + b will produce mb1 j jand mb2 j jdistributions that peak at
the top quark mass. The presence of a W boson decaying to ℓ + ν manifests itself as a Jacobian peak in the mTdistribution when there are no additional high-pT neutrinos in the event.
6.1 Background templates
The main backgrounds in the ℓ+jets channel are from W(→ ℓν)+jets and other tt final states. There are also smaller contributions from single top, Z(→ ℓℓ)+jets (with one lepton not identified) and multijet processes with one jet misidentified as a lepton. Background templates are derived from the MC simu-lations in all cases except multijet processes. The multijet background is very difficult to simulate due to the need for a very large sample and the fact that MC models do not reproduce that background well. Instead it is derived from a control data sample with nonisolated electrons and muons, keeping all other selection criteria the same. The distributions of a small expected contribution from tt is subtracted from the multijet control sample.
Figure1shows the mj j, mb1 j j, mb2 j j and mT distributions predicted by MC simulation and normalized
to unity for W+jets, Z+jets, and tt→ ℓ+jets events. It also shows these distributions for multijet events derived from the control data sample. The distributions from other tt channels are not shown as that background is normalized following the MC prediction of the ratio to the number of tt → ℓ+jets events. The figure demonstrates that the shape of all the invariant mass distributions from jets are quite distinct for tt → ℓ+jets while there is very little difference between the various backgrounds. The distributions for tt→ ℓ+jets events show that they include top quarks decaying to b+W with the W boson decaying to jets. On the other hand, the mT distributions show that they include a W boson decaying leptonically in
both the tt→ ℓ+jets and W+jets channels but cannot discriminate between them. They do show a clear separation between final states with one W boson decaying leptonically and those with little intrinsic ETmiss(Z+jets and multijets).
The background templates for Z+jets events from MC simulation are checked with Z+jets events from data by selecting events with two identified leptons and requiring the dilepton mass to be near the Z mass. Events are required to have two oppositely charged leptons (peT > 25 GeV and pµT > 20 GeV),
[GeV] jj m 0 50 100 150 200 (1/N)dn/dm 0 0.02 0.04 0.06 0.08 0.1 0.12 0.14 (l+jets) t t W+jets Z+jets multijet ATLAS Simulation =7 TeV s (l+jets) t t W+jets Z+jets multijet [GeV] b1jj m 0 100 200 300 400 (1/N)dn/dm 0 0.02 0.04 0.06 0.08 0.1 0.12 0.14 ATLAS Simulation =7 TeV s (l+jets) t t W+jets Z+jets multijet (a) (b) [GeV] b2jj m 0 100 200 300 400 (1/N)dn/dm 0 0.02 0.04 0.06 0.08 0.1 0.12 0.14 (l+jets) t t W+jets Z+jets multijet ATLAS Simulation =7 TeV s [GeV] T m 0 50 100 150 200 (1/N)dn/dm 0 0.05 0.1 0.15 0.2 0.25 ATLAS Simulation =7 TeV s (l+jets) t t W+jets ee)+jets → Z( )+jets µ µ → Z( ) µ multijet ( multijet (e) (c) (d)
Figure 1: (a) Invariant mass of two highest-pTjets not designated as b-jets (mj j), (b) and (c) invariant masses of jets designated as b-jets and the jets used for mj j, (mb1 j j) and (mb2 j j), where b1 stands for the leading b-jet and b2 for the subleading b-jet, and (d) transverse mass of lepton and Emiss
T (mT). The distributions have been normalized and show distributions for tt→ ℓ+jets, Z(→ ℓℓ)+jets, W(→ ℓν)+jets MC events and multijet events populating the
ℓ+jets channels. The e and µ channels have been merged together in the mj j, mb1 j j and mb2 j jdistributions. They are kept separate in the mTdistributions except for tt and W+jets. Events are required to have exactly one isolated
e or µ, Emiss
T >30 GeV, at least four jets, and at least one b-tagged jet.
and the data after applying scale factors (SF) based on comparing data and simulation as a function of the Z boson pT and the jet multiplicity. The small expected t¯t contribution is subtracted from the data
distributions. The Kolmogorov-Smirnov goodness-of-fit test (KS) value in each plot indicates how well
the shape of the data distribution is described by the ALPGEN MC simulation. 4 Since there is no noticeable difference between the shapes of the W+jets and Z+jets templates, as shown in Fig.1, one can conclude that both MC templates can reproduce reasonably well the distributions expected in the data. The number of selected Z+jets events is also predicted well by the simulation.
0 50100150200250300350400 Events/10 GeV 0 20 40 60 t data-t Z+jets ATLAS =7 TeV s -1 4.6 fb KS=0.997 t data-t Z+jets [GeV] jj m 0 100 200 300 400 data/MC 0 0.5 1 1.5 2 0 100200300400500600700 Events/20 GeV 0 20 40 60 ATLAS =7 TeV s -1 4.6 fb KS=0.17 t data-t Z+jets [GeV] b1jj m 0 200 400 600 data/MC 0 0.5 1 1.5 2 0 100200300400500600700 Events/20 GeV 0 20 40 60 80 ATLAS =7 TeV s -1 4.6 fb KS=0.69 t data-t Z+jets [GeV] b2jj m 0 200 400 600 data/MC 0 0.5 1 1.5 2 (a) (b) (c)
Figure 2: (a) Invariant mass of two highest-pTjets not designated as b-jets (mj j), (b) and (c) invariant masses of jets designated as b-jets and the jets used for mj j, (mb1 j j) and (mb2 j j), where b1 stands for the leading b-jet and b2 for the subleading b-jet, and (d) transverse mass of lepton and EmissT (mT). The distributions show ALPGEN MC for a control sample of Z(→ ℓℓ)+jets events selected by requiring 70 < mℓℓ <110 GeV (mℓℓis the invariant mass of the two leptons), ETmiss>30 GeV, at least four jets, and at least one of them b-tagged, compared to the data after subtracting the expected t¯t contribution. KS is the value of the Kolmogorov-Smirnov goodness-of-fit test.
6.2 Fits to mass distributions
As shown in Sec.6.1the three invariant masses constructed from jets do not discriminate between the various backgrounds, while the signal from tt is quite distinct. The only distribution that is different for each background is the transverse mass. In particular, the transverse mass clearly distinguishes final states with intrinsic EmissT , i.e. those with a W boson decaying to a lepton and neutrino, from those where ETmissis due to mismeasurements. The dominant processes without sizable intrinsic ETmissare multijet and Z+jets. The transverse mass distributions for those two processes are different. However, they contribute little in mT > 40 GeV so most of the separation comes from the region below 40 GeV. As shown in
Fig.2, the ALPGEN Z+jets simulation predicts the shape and the number of Z+jets events well, so the choice is made to normalize the number of Z+jets events to that predicted by the simulation. The number of single top events is similarly normalized from MC simulation. The amount of multijet background is obtained from the fit to the data using the templates derived from nonisolated lepton samples. The other free parameters are the total number of W+jets events and the total number of tt events. The fractional contributions for the various tt channels are obtained using MC events. To ensure that events are not used more than once, two sets of data are fitted: EmissT < 30 GeV (set 1) and EmissT > 30 GeV (set 2). Set 1 is used to fit the mTdistributions and helps determine the multijet background. Set 2 is used to fit the three
The variables mb1 j jand mb2 j jare strongly correlated with mj j. To exploit the fact that the correlations are
very different in tt and the background, the fits are done simultaneously in 6× 6 × 6 bins of mj j,mb1 j jand
mb2 j jfor a total of 216 bins. Of those, 30 bins have zero events since they are kinematically not possible.
The ranges and bin sizes are chosen so that all bins used for fitting are populated by more than 10 events. That limits the range of mT to mT < 120 GeV, mj j to mj j < 250 GeV, mb1 j j to mb1 j j < 450 GeV, and
mb2 j jto mb2 j j <450 GeV. [GeV] T m 0 20 40 60 80 100 120 Events/5 GeV 0 100 200 300 400 500 600 data model unc. (e+jets) t t t other t multijet Z+jets single t W+jets KS=0.268 ATLAS =7 TeV s -1 4.6 fb e+jets [GeV] T m 0 20 40 60 80 100 120 Events/5 GeV 0 100 200 300 400 500 600 700
800 datamodel unc.
+jets) µ ( t t t other t multijet Z+jets single t W+jets KS=0.667 ATLAS =7 TeV s -1 4.6 fb +jets µ
Figure 3: Transverse mass of lepton and EmissT (mT) distributions used in the fits. Events are required to have exactly one isolated e or µ, EmissT <30 GeV, at least four jets, and at least one b-tag. The model uncertainty (model unc.) is the sum in quadrature of the statistical uncertainties of the templates used in the fits. KS is the value of the Kolmogorov-Smirnov goodness-of-fit test.
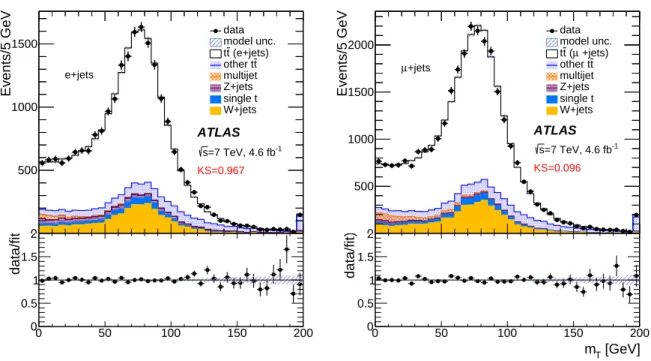
The mT distributions for events with EmissT < 30 GeV, used in the fits, are shown in Fig. 3. Table 1
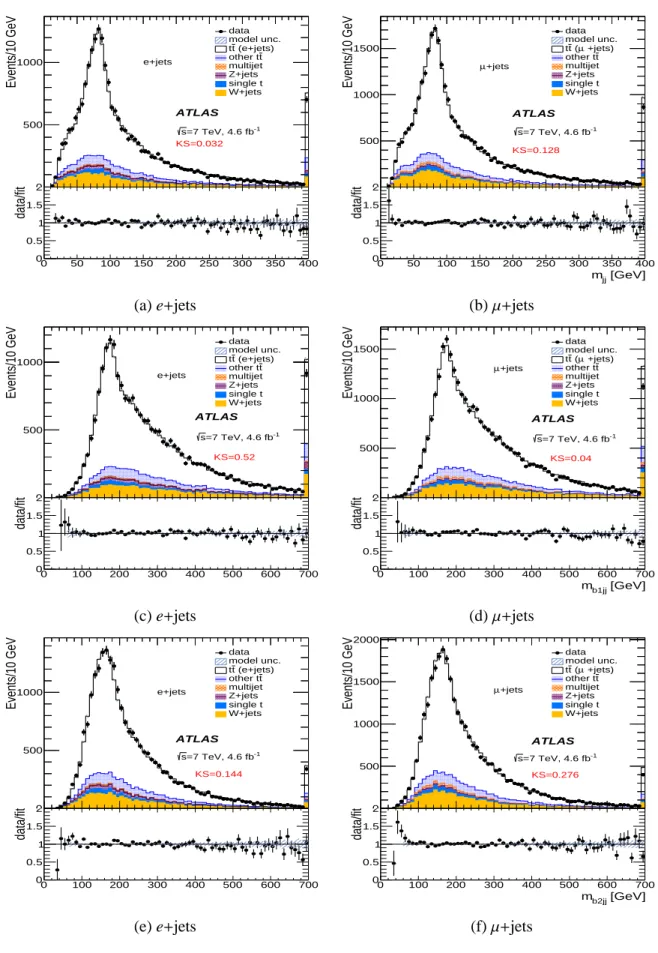
shows the predicted contributions from each channel, combining events with ETmiss<30 GeV and EmissT > 30 GeV. Figure4shows that the fits describe well the full e+jets and µ+jets event distributions of mj j,
mb1 j j and mb2 j j after requiring ETmiss > 30 GeV. Figure5 shows the mT distribution for events with
ETmiss>30 GeV compared with the predicted contributions, which agree well with the data. Noticeable features from these fits are as follows:
• The largest backgrounds originate in W+jets (15%) and other tt channels (8.5%); the rest add up to 12% (multijets 5.3%, Z+jets 3.9%, and single top 3.0%).
• The numbers of tt and W+jets events obtained by fitting are in good agreement with those predicted by the SM.
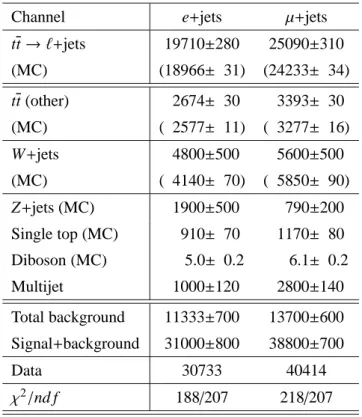
Table 1: Results from fitting e+jets and µ+jets mass distributions from ℓ+jets events requiring exactly one isolated lepton (e or µ), at least four jets, and at least one b-tag. The uncertainties quoted here are from the fits and do not include systematic uncertainties. The Z+jets contribution is normalized to the MC expectation. In addition to MC statistical uncertainty, it includes the uncertainty from the scale factors applied to the simulation in order to match the jet multiplicity and the Z boson pTdependence to that observed in the data . The single top and diboson contributions are normalized to MC predictions, include only MC statistical uncertainty and the SM cross section uncertainty. The (MC) rows give the numbers expected from MC simulation. The χ2/nd f row gives the χ2 and degrees of freedom of the fits.
Channel e+jets µ+jets
tt→ ℓ+jets 19710±280 25090±310 (MC) (18966± 31) (24233± 34) tt (other) 2674± 30 3393± 30 (MC) ( 2577± 11) ( 3277± 16) W+jets 4800±500 5600±500 (MC) ( 4140± 70) ( 5850± 90) Z+jets (MC) 1900±500 790±200 Single top (MC) 910± 70 1170± 80 Diboson (MC) 5.0± 0.2 6.1± 0.2 Multijet 1000±120 2800±140 Total background 11333±700 13700±600 Signal+background 31000±800 38800±700 Data 30733 40414 χ2/nd f 188/207 218/207
0 50 100150200250300350400 Events/10 GeV 0 500 1000 KS=0.032 ATLAS -1 =7 TeV, 4.6 fb s e+jets data model unc. (e+jets) t t t other t multijet Z+jets single t W+jets [GeV] jj m 0 50 100 150 200 250 300 350 400 data/fit 0 0.5 1 1.5 2 0 50 100150200250300350400 Events/10 GeV 0 500 1000 1500 KS=0.128 ATLAS -1 =7 TeV, 4.6 fb s +jets µ data model unc. +jets) µ ( t t t other t multijet Z+jets single t W+jets [GeV] jj m 0 50 100 150 200 250 300 350 400 data/fit 0 0.5 1 1.5 2
(a) e+jets (b) µ+jets
0 100200300400500600700 Events/10 GeV 0 500 1000 KS=0.52 ATLAS -1 =7 TeV, 4.6 fb s e+jets data model unc. (e+jets) t t t other t multijet Z+jets single t W+jets [GeV] b1jj m 0 100 200 300 400 500 600 700 data/fit 0 0.5 1 1.5 2 0 100200300400500600700 Events/10 GeV 0 500 1000 1500 KS=0.04 ATLAS -1 =7 TeV, 4.6 fb s +jets µ data model unc. +jets) µ ( t t t other t multijet Z+jets single t W+jets [GeV] b1jj m 0 100 200 300 400 500 600 700 data/fit 0 0.5 1 1.5 2 (c) e+jets (d) µ+jets 0 100200300400500600700 Events/10 GeV 0 500 1000 KS=0.144 ATLAS -1 =7 TeV, 4.6 fb s e+jets data model unc. (e+jets) t t t other t multijet Z+jets single t W+jets [GeV] b2jj m 0 100 200 300 400 500 600 700 data/fit 0 0.5 1 1.5 2 0 100200300400500600700 Events/10 GeV 0 500 1000 1500 2000 KS=0.276 ATLAS -1 =7 TeV, 4.6 fb s +jets µ data model unc. +jets) µ ( t t t other t multijet Z+jets single t W+jets [GeV] b2jj m 0 100 200 300 400 500 600 700 data/fit 0 0.5 1 1.5 2
(e) e+jets (f) µ+jets
Figure 4: Distributions in data compared to the SM expectations after fitting the following distributions: (a,b) the invariant mass of two highest-pTjets not designated as b-jets; (c,d) the invariant mass of the leading jet designated as b-jet and the jets used for mj j(mb1 j j), and (e,f) the invariant mass of the second jet designated as a b-jet and the two jets used for mj j(mb2 j j). The distributions are shown for events with isolated leptons, at least four jets, at least one b-tag, and Emiss
T >30 GeV, with the e+jets and µ+jets channels separated. The last bin shows the overflow. The ratio plots show the result of dividing the data points by the model expectation. The model uncertainty (model unc.) is the sum in quadrature of the statistical uncertainties of the templates used in the fits. KS is the value of the Kolmogorov-Smirnov goodness-of-fit test.
0
50
100
150
200
Events/5 GeV 0 500 1000 1500 data model unc. (e+jets) t t t other t multijet Z+jets single t W+jets KS=0.967 ATLAS -1 =7 TeV, 4.6 fb s e+jets [GeV] T m 0 50 100 150 200 data/fit 0 0.5 1 1.5 20
50
100
150
200
Events/5 GeV 0 500 1000 1500 2000 data model unc. +jets) µ ( t t t other t multijet Z+jets single t W+jets KS=0.096 ATLAS -1 =7 TeV, 4.6 fb s +jets µ [GeV] T m 0 50 100 150 200 data/fit) 0 0.5 1 1.5 2Figure 5: The transverse mass of lepton and Emiss
T (mT) distributions for events with isolated leptons, at least four jets, at least one b-tag and Emiss
T > 30 GeV in the e+jets and µ+jets channels. The last bin shows the overflow. The ratio plots show the result of dividing the data points by the model expectation. The model uncertainty (model unc.) is the sum in quadrature of the statistical uncertainties of the templates used in the fits. KS is the value of the Kolmogorov-Smirnov goodness-of-fit test.
7 Dilepton + jets channel
The number of tt → ℓℓ′+jets events in the data is extracted by fitting two dilepton invariant mass dis-tributions: one with 30 < EmissT < 60 GeV and the other with EmissT > 60 GeV. The most significant background to the tt → ℓℓ′+jets channels after requiring Emiss
T > 30 GeV and at least one b-tagged jet
comes from the Z(→ ℓℓ′)+jets, with a smaller contribution from single top production (4%). Since the ETmiss distribution falls more rapidly for the Z+jets background than for the tt signal process separating it into two EmissT bins improves the sensitivity of the fit for separating the two processes. Backgrounds from dibosons and jets misidentified as isolated leptons (mainly from W+jets with leptons from heavy-quark semileptonic decays or an isolated charged hadron misidentified as a lepton, together denoted as nonprompt leptons) amount to 1.0% of the events. The background from nonprompt isolated leptons is estimated from the number of data events with lepton pairs with the same charge after subtracting a very small expected contribution from diboson processes. The invariant mass distributions are fitted with three templates: one derived from a tt MC sample, one from a Z+jets MC sample, and one summed over all other contributions. Only the amounts contributed by tt and Z+jets are allowed to vary. The Z boson background in the eµ+jets channel from the Z(→ ττ → eµ)+X channel is too small to be extracted by a fit, so meµis fitted only for the number of tt events in the data while the background is fixed. The fits in
the ℓℓ channel are performed over a mass range from 40 GeV to 250 GeV and in the eµ channel over a mass range from 10 GeV to 250 GeV. Figures6and7show that the mℓℓ′and EmissT distributions are well
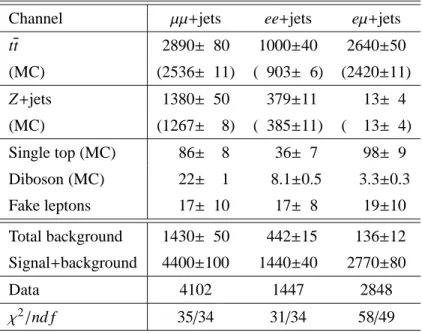
described in all dilepton channels. Results of the fits are given in Table2.
Table 2: Results from fitting ℓℓ′invariant mass distributions using two Emiss
T regions from ℓℓ′+jets events requiring two isolated leptons (e or µ), Emiss
T >30 GeV, at least two jets, and at least one b-tag. The numbers of events are after summing events from both Emiss
T regions E miss
T <60 GeV and E miss
T >60 GeV. The uncertainties are from the fits and do not include systematic uncertainties. The single top and diboson contributions are normalized to the SM predictions and include only the MC statistical uncertainty and the uncertainty on the SM cross section. The (MC) rows give the numbers expected from MC simulation.
Channel µµ+jets ee+jets eµ+jets
tt 2890± 80 1000±40 2640±50 (MC) (2536± 11) ( 903± 6) (2420±11) Z+jets 1380± 50 379±11 13± 4 (MC) (1267± 8) ( 385±11) ( 13± 4) Single top (MC) 86± 8 36± 7 98± 9 Diboson (MC) 22± 1 8.1±0.5 3.3±0.3 Fake leptons 17± 10 17± 8 19±10 Total background 1430± 50 442±15 136±12 Signal+background 4400±100 1440±40 2770±80 Data 4102 1447 2848 χ2/nd f 35/34 31/34 58/49 15
50
100
150
200
250
Events/5 GeV 0 100 200 data model unc. (ee+jets) t t Z+jets other KS=0.997 ATLAS -1 =7 TeV, 4.6 fb s [GeV] ee m 50 100 150 200 250 data/fit 0 0.5 1 1.5 250
100
150
200
250
Events/5 GeV 0 200 400 600 data model unc. +jets) µ µ ( t t Z+jets other KS=0.055 ATLAS -1 =7 TeV, 4.6 fb s [GeV] µ µ m 50 100 150 200 250 data/fit 0 0.5 1 1.5 2(a) ee+jets (b) µµ+jets
0
50
100
150
200
Events/5 GeV 0 50 100 150 200 data model unc. (ee+jets) t t Z+jets other KS=0.988 ATLAS -1 =7 TeV, 4.6 fb s [GeV] miss T E 0 50 100 150 200 data/fit 0 0.5 1 1.5 20
50
100
150
200
Events/5 GeV 0 200 400 600 data model unc. +jets) µ µ ( t t Z+jets other KS=0.238 ATLAS -1 =7 TeV, 4.6 fb s [GeV] miss T E 0 50 100 150 200 data/fit 0 0.5 1 1.5 2 (c) ee+jets (d) µµ+jetsFigure 6: Dilepton invariant masses (a) mee, (b) mµµ, and ETmissdistributions for events with two isolated leptons,
EmissT > 30 GeV, at least two jets, and at least one b-tag in the (c) ee+jets and (d) µµ+jets channels. The Z+jet entries include a small contribution from Z → τ+τ−with both τ leptons decaying to e or µ. The ratio plots show the result of dividing the data points by the fit. The model uncertainty (model unc.) is the sum in quadrature of the statistical uncertainties of the templates used in the fits. KS is the value of the Kolmogorov-Smirnov goodness-of-fit test.
0
50
100 150 200 250
Events/5 GeV 0 50 100 data model unc. +jets) µ (e t t Z+jets other KS=0.559 ATLAS -1 =7 TeV, 4.6 fb s µ e m 0 50 100 150 200 250 data/fit 0 0.5 1 1.5 20 20 40 60 80100
120
140
160
180
200
Events/5 GeV 0 50 100 150 200 data model unc. +jets) µ (e t t Z+jets other KS=0.419 ATLAS -1 =7 TeV, 4.6 fb s [GeV] miss T E 0 50 100 150 200 data/fit 0 0.5 1 1.5 2 (a) (b)Figure 7: (a) Invariant mass of electron and muon (meµ) and (b) ETmissdistributions for eµ events after requiring one isolated e and one isolated µ, EmissT >30 GeV, at least two jets, and at least one b-tag. The ratio plots show the result of dividing the data points by the fit. The model uncertainty (model unc.) is the sum in quadrature of the statistical uncertainties of the templates used in the fits. KS is the value of the Kolmogorov-Smirnov goodness-of-fit test.
8 Lepton+τ
had+
jets channel
Unlike the single-lepton + jets and dilepton channels the background in the ℓτhad+jets channel is not small
and is dominated by contributions from other tt channels. Thus, invariant masses and other kinematic variables are not sufficiently sensitive to separate signal and background. In this case a BDT multivariate discriminant, named BDTj, is used to separate τ leptons from jets identified as τ candidates (see Sec.5).
Compared to the previous ATLAS measurement with this channel [13], the present analysis uses only one-prong τ decays and is based on a larger data sample with a different background model to reduce the statistical uncertainty on the background prediction.
8.1 Tau background templates
In order to separate the contribution of processes with τ leptons (signal) from those with jets misidentified as τ (fake τ) the BDTj distributions of selected events are fitted with templates for fake τ distributions
derived from data and true τ lepton distributions derived from MC simulation. Control data samples to obtain templates of jets misidentified as τ candidates are selected with the following requirements:
• exactly one isolated electron with peT>25 GeV and no identified muons for the e + τ channel;
• or exactly one isolated muon with pµT >20 GeV and no identified electrons for the µ + τ channel;
• and no additional muons with pT>4 GeV;
• and 40 GeV < mT(ℓ, ETmiss) < 100 GeV;
• and exactly one τ candidate and at most one additional jet. There are two mutually exclusive control samples:
The W+1-jet sample contains a lepton, one jet misidentified as a τ candidate and no additional jets. The W+2-jets sample contains a lepton and exactly two jets with the lower pT jet misidentified as a τ
candidate.
The control samples are divided into two subsamples, one with τ and ℓ having the opposite-sign charges (OS), and the other with τ and ℓ having the same-sign charges (SS). The W + 1-jet sample is rich in jets originating from quark hadronization (quark jets) while the W + 2-jets sample has a high percentage of jets originating from gluon hadronization (gluon jets) as determined from MC studies. One can extract the distributions of gluon jets misidentified as τ candidates since the number of gluon jets in OS and SS samples must be the same because they are not correlated with the charge of the lepton. Fake τ template shapes depend on the jet type. Those from light-quark jets peak at higher BDTjvalues than those from
gluon jets. The signal contributes only to OS events. Therefore, the BDTj distributions of OS events
are fitted with a pair of background templates, whose linear combination equals the sum of the OS light-quark and gluon jets identified as τ candidates, and a signal τ template. MC studies show that requiring τ candidates that have only one associated charged particle strongly suppresses jets originating from heavy quarks (c-jets, b-jets). The b-jets are further suppressed by excluding τ candidates that are tagged as b-jets. The BDTj template from remaining c-jets identified as τ candidates is similar to the light-quark
In the W + 2-jets sample the lower-pT jet has a high probability of coming from final- or initial-state
radiation and thus a high probability of being a gluon jet. In the following, OS1 (SS1) stands for the τ fake BDTjdistribution obtained from OS (SS) W + 1-jet data sets and OS2 (SS2) represent the equivalent
distribution for W + 2-jets. Figures 8(a) and8(b) show the OS and OS-SS distributions normalized to compare the shapes. It can be seen that there are significant differences between OS1 and OS2, but if one subtracts the SS distribution from the OS distribution (OS-SS) the shapes are in good agreement. The distributions are a sum of light-quark jets and gluon jets, and can be described by the following equations:
OS1 = a1· OSq+ b1· G, (1)
SS1 = c1· SSq+ b1· G, (2)
OS2 = a2· OSq+ b2· G, (3)
SS2 = c2· SSq+ b2· G, (4)
where OSq (SSq) is a function describing the shape of the distribution of light-quark jets contributing
to OS (SS) and G is the corresponding function for gluon jets. The observation that the OS1−SS1 and
OS2−SS2 distributions have the same shape leads to the conclusion that a1/c1= a2/c2for any ET as the
ET of τ candidates from W + 2-jets are significantly lower than those from W + 1-jet. Using the above
equations, one can extract the G function from the OS and SS distributions separately, i.e.
K· G = (R · OS2 − OS1), (5)
K· G = (R · SS2 − SS1), (6)
where R is the ratio of the total number of OS1−SS1 events to OS2−SS2 events and K = R · b2− b1 is
an unknown constant that must be the same whether SS or OS is used to extract G. Figure8(c) shows the extracted K· G distributions for τ candidates. It is seen that the OS and SS distributions are fully consistent with each other and can be summed to reduce the statistical uncertainties.
In principle any background BDTj distribution can be described by a linear combination of G and OS1
distributions. Furthermore, the BDTjdistributions depend on ETof the τ candidates, which differs from
sample to sample. The ET dependence of the BDTj is taken into account by fitting separate ET regions
with templates derived for those regions weighted to reproduce the ETdistributions of the expected
back-ground. The OS1 sample has a small (2%) number of τ leptons from dibosons and Z→ τ+τ−final states that have no impact on the fits to ℓτhad+jets BDTj data distributions whether or not they are subtracted
from the OS1 template.
j BDT 0 0.2 0.4 0.6 0.8 1 (1/N)dn/dm 0 0.02 0.04 0.06 0.08 0.1 0.12 0.14 0.16 0.18 0.2 OS ATLAS =7 TeV s -1 4.6 fb W+1-jet W+2-jets W+1-jet W+2-jets j BDT 0 0.2 0.4 0.6 0.8 1 (1/N)dn/dm 0 0.05 0.1 0.15 0.2 OS-SS ATLAS =7 TeV s -1 4.6 fb KS=0.7 W+1-jet W+2-jets j BDT 0 0.2 0.4 0.6 0.8 1 (derived events)/0.1 0 2000 4000 6000 8000 OS SS KS=0.7 ATLAS =7 TeV s gluon jets -1 4.6 fb
Figure 8: Normalized distributions of the output of the boosted decision tree used to discriminate τ leptons from jets misidentified as τs, BDTj, for τ candidates from W + 1-jet and W + 2-jets samples for leptons with opposite sign (OS), the distribution of opposite-sign leptons with the same-sign lepton distribution subtracted (OS−SS), and the extracted BDTjdistributions (K· G, see text) for gluon jets misidentified as τ candidates is shown.
8.2 Signal extraction by fitting to BDTj shape
The final background normalization and signal measurement are established through fitting templates to the data. There are various classes of background:
1. from processes with an isolated ℓ where a jet is misidentified as a τ candidate; 2. from processes other than t¯t that have τ leptons and an isolated ℓ;
3. from processes with two isolated ℓ where one ℓ is misidentified as a τ candidate;
4. from multijet processes where both ℓ and τ are from one jet misidentified as an isolated ℓ and another as a τ candidate.
The dominant background to the tt→ ℓτhad+jets channel comes from the tt → ℓ+jets channel with one
jet misidentified as a τ candidate (class 1). The only powerful suppression technique for that background is τ identification, thus the best variable is the BDTj score, described with the τ candidate selection in
Sec.5. Background of classes 1 and 4 is taken into account using templates consisting of light-quark jet τfakes and gluon jet τ fakes derived from enriched W+jets data samples as described in Sec.8.1. The signal BDTjtemplate is derived from MC τ candidates that are matched to a τ lepton or a lepton from
MC events that satisfy the event selection (classes 2 and 3) . The class 2 processes contributing to the signal template are: t¯t→ ℓτ+jets, Z(→ τ+τ−) +jets, and small contributions from single top and diboson
events. The main backgrounds of class 3 are Z → e+e− and t¯t events. Most electrons are removed by the BDTe cut (see Sec. 5); the few that remain are indistinguishable from τ leptons. There is an even
smaller number of muons overlapping with τ candidates that are not removed by the muon veto and are also indistinguishable from τ leptons. In these cases, the τ candidates are added to the signal template. The efficiency for electrons and muons misidentified as τ candidates is determined by studying Z→ ℓ+ℓ− events. Based on these studies the estimated contribution from class 3 background to the signal template is 2.8%. The total contribution from class 2 and class 3 backgrounds (Z+jets, t¯t→ ℓℓ+jets, single top and
Table 3: Composition of signal template: all events from MC simulation with a true τ, e or µ matched to the τ candidate. The number of events are normalized to the number expected from simulation. Regions 1 and 2 are 20 GeV ≤ Eτ
T ≤ 35 GeV and 35 GeV ≤ E τ
T ≤ 100 GeV respectively. The uncertainties represent the statistical uncertainties of the MC samples.
Channel Region 1 Region 2
t¯t→ ℓτhad+jets 611.5± 5.4 621.4± 5.4 t¯t→ ℓℓ+jets 13.0± 0.7 13.0± 0.7 Z + jets 54.5± 3.3 45.3± 3.0 Single top 23.6± 2.3 27.1± 2.4 Dibosons 1.5± 0.2 2.2± 0.3 Total 705.2± 6.8 709.5± 6.8
With these background templates and MC signal template (S ), a χ2fit is performed with parameters to set the normalization of each template: a· OS1 + b · G + c · S . The combined e and µ channel results are obtained by fitting to the sum of the distributions. Comparisons of the template shapes of the e and µ channel show they are identical within the uncertainties.
Two different ET regions, 20 GeV ≤ EτT ≤ 35 GeV and 35 GeV ≤ EτT ≤ 100 GeV, are chosen such that
each region has the same number of expected signal events. Three parameters are used to fit both regions simultaneously: the fraction of τ candidates in each ET region that are gluon jets and the total fraction
of signal. In the fit the sum of signal and background must add up to the number of observed events in each ETregion and the amount of signal in the two regions is constrained by the ratio predicted from MC
simulation.
8.3 Fit results
The three-parameter fit was applied to MC samples to establish whether it can extract the known signal without bias. The MC samples are made with events from tt, W+jets, Z+jets, single top and diboson final states satisfying the data selection criteria. The MC samples were split into two, one used as the data to fit and the other to generate the templates for the fit. Figure9shows these MC fit results after correcting the background templates derived from W+jets to account for the different ETdistribution of the τ candidates
in the expected background to tt → ℓτhad+jets. The model uncertainty shown in Figure9 corresponds
to the uncertainty of the templates in the fits to the data and used for ensemble tests. The ensemble tests show that no bias is introduced by the fitting procedure. The µ and e channels are combined by adding together the distributions of both channels. The data BDTjdistributions can have multiple entries for an
event as all τ candidates are considered. This has no impact on the t¯t→ ℓτhad+jets signal as there is only
one τ lepton decaying to hadrons in that channel.
The results of fitting the data are summarized in Table4. NSFittedis the number of signal template events. NttFitted is the number of observed t¯t → ℓτ+jets events, obtained by subtracting the contributions from class 2 and class 3 backgrounds (see Sec.8.2) from NSFitted. The number of expected (NMC
tt ) is in good
agreement with NFittedtt . Figure10shows the final results using these µ and e channel combined templates. j BDT 0 0.2 0.4 0.6 0.8 1 candidates/bin τ 0 200 400 600 800 1000
1200 MC testModel unc. +jets) τ (l t t W OS gluons other ATLAS Simulation =7 TeV s ET=20-35 GeV j BDT 0 0.2 0.4 0.6 0.8 1 candidates/bin τ 0 200 400 600 800 MC test Model unc. +jets) τ (l t t W OS gluons other =35-100 GeV T E ATLAS Simulation =7 TeV s
(a) 20 GeV≤ ET ≤ 35 GeV (b) 35 GeV≤ ET ≤ 100 GeV
Figure 9: Fitted distributions of the τ-jet discriminant BDTjMC using corrected background templates for two ET regions. The model uncertainty is the uncertainty of the templates used in the fits to the data.
Table 4: Numbers of events expected from MC simulation and fit results to the BDTjdistribution using background and signal templates as described in Sec.8.1. NttMCis the expected number of tt → ℓτhad+jets events for a cross section of 177 pb. Bnon tt τis the number of τ leptons expected from sources other than tt → ℓτhad+jets. Bleptonis the expected number of leptons misidentified as τ leptons. NFitted
S is the number of events extracted with the signal template (S , see text) and NFitted
tt = N Fitted S -Bnon tt τ -Blepton NMC tt Bnon tt τ Blepton N Fitted S N Fitted tt
20 < ETτ <35 GeV 611± 5 76.2± 3.5 17.1± 1.1 N/A N/A
35 < ETτ <100 GeV 621± 5 69.5± 3.3 17.6± 1.1 N/A N/A
Combined EτTbins 1232± 8 146± 5 34.8± 1.5 1460± 60 (χ2/ndf =0.69) 1280± 60
Jets misidentified as τ leptons come mostly from tt→ ℓ+jets and from W+jets. Thus the mTdistributions
should show a Jacobian peak from a W decay. The tt → ℓτhad+jets events have additional neutrinos,
which produce a broader mT distribution. Figure11 shows the distributions from events selected with
0
0.2
0.4
0.6
0.8
1
candidates/bin τ 0 200 400 600 800 1000 1200 data Model unc. +jets) τ (l t t W OS gluons other =20-35 GeV T E /ndf=0.45 2 χ =7 TeV s -1 4.6 fb ATLAS j BDT 0 0.2 0.4 0.6 0.8 1 data/fit 0.8 0.9 1 1.1 1.20
0.2
0.4
0.6
0.8
1
candidates/bin τ 0 200 400 600 800 1000 =35-100 GeV T E /ndf=0.85 2 χ =7 TeV s -1 4.6 fb ATLAS data Model unc. +jets) τ (l t t W OS gluons other j BDT 0 0.2 0.4 0.6 0.8 1 data/fit 0.8 0.9 1 1.1 1.2(a) 20 GeV≤ ET ≤ 35 GeV (b) 35 GeV≤ ET ≤ 100 GeV
Figure 10: Fitted distributions of the τ-jet discriminant BDTjin data using corrected background templates for (a) 20 GeV≤ ET ≤ 35 GeV and (b) 35 GeV ≤ ET ≤ 100 GeV. The model uncertainty is the statistical uncertainty of the templates used in the fits.
9 Measuring Cross Section and Branching Ratios
In the SM 100% of the top quark decays have one W boson and a quark. Therefore the top quark branching ratios into channels with leptons and jets are determined by the W decay branching ratios that have been measured with 0.3% precision (assuming lepton universality) [15] and are predicted by the SM with an uncertainty of order 0.1%. It is possible to derive the branching ratios into all decay modes using the number of tt events extracted in the previous sections assuming that the top quark branching ratios to leptons and jets add up to 100%. Any deviation from the W branching ratios would be an indication of some process not predicted by the SM. The following observed quantities are defined (whereAch· ǫch is
the geometric detector acceptance times the efficiency of channel ch):
• Nµj=(observed number of tt→ µ+jets)/Aµj· ǫµj,
• Ne j=(observed number of tt→ e+jets)/Ae j· ǫe j,
• Nµµ=(observed number of tt→ µ + µ+jets) /Aµµ· ǫµµ,
• Nee=(observed number of tt→ e + e+jets) /Aee· ǫee,
• Neµ=(observed number of tt→ e + µ+jets) /Aeµ· ǫeµ,
• Nℓτ=(observed number of tt→ ℓ + τhad+jets) /Aℓτ· ǫℓτ,
• Nℓj=Nµj+Ne j,
0
50
100
150
200
Events/5 GeV 0 100 200 300 400 data +jets) τ (l t t model uncertainty τ τ → Z jet background multijet bkgd. ATLAS <0.6 j BDT =7 TeV s -1 4.6 fb KS=0.785 [GeV] T m 0 50 100 150 200 data/fit 0 0.5 1 1.5 20
50
100
150
200
Events/5 GeV 0 50 100 datatt (lτ+jets) model uncertainty τ τ → Z jet background multijet bkgd. >0.7 j BDT ATLAS =7 TeV s -1 4.6 fb KS=0.991 [GeV] T m 0 50 100 150 200 data/fit 0 0.5 1 1.5 2(a) Background region, BDTj<0.6. (b) Signal region, BDTj>0.7.
Figure 11: Transverse mass distributions (mT) of tt → ℓτhad+jets events. The black points are data, the solid histograms the prediction based on the fits to the BDTjdistributions. The jet background is the sum of all channels with jets misidentified as τ candidates normalized to the amount obtained from the fits to BDTj distributions. The multijet background is the estimated contribution from non-tt multijet processes and is included in the jet background. The model uncertainty is the statistical uncertainty of the templates used in the fits. KS is the value of the Kolmogorov-Smirnov goodness-of-fit test.
• Nℓℓ=Nµµ+Nee+Neµ.
The following notation is used for the top quark branching ratios: • Bµ: top quark branching ratio to µνµ(ντ) + X,
• Be: top quark branching ratio to eνe(ντ) + X,
• Bτ: top quark branching ratio to τντ+ X, with the τ lepton decaying hadronically • Bj: top quark branching ratio to jets,
• Bℓ: Bµ+Be.
The branching ratios Bµand Beinclude events with leptonic τ decays.
With these definitions the following relations hold:
Bj+ Bℓ+ Bτ= 1, (10)
where σtt is the cross section for tt pair production andL is the integrated luminosity. These four equa-tions with four unknowns can be solved to obtain:
Bj= Nℓj/(Nℓj+ 2Nℓℓ+ Nℓτ), (11)
Bℓ= 2Nℓℓ/(Nℓj+ 2Nℓℓ+ Nℓτ), (12)
Bτ= Nℓτ/(Nℓj+ 2Nℓℓ+ Nℓτ), (13)
σtt· L = (Nℓj+ 2Nℓℓ+ Nℓτ)2/4Nℓℓ. (14)
From the numbers of tt events given in Tables1–4and the acceptances given in Table5the values are obtained for Nℓx and given in Table6. The Nℓxare in units of events/pb−1.
After solving for Bℓone can solve for Be and Bµ using ratios in the dilepton and the single-lepton
chan-nel:
Bµ(e)= 2Nµµ(ee)· Bj/Nµ(e) j≡ a, (15)
Bµ(e)= Bℓ· q
Nµµ(ee)/Nℓℓ ≡ b. (16)
The best values are obtained by minimizing
χ2 = ([Bµ(e)− a]/δa)2+ ([Bµ(e)− b]/δb)2, (17)
where δa and δb are the a and b uncertainties.
Table 5: The acceptance× efficiency (Ach· ǫch) of each channel used to extract the number of tt events after all selections. TheAch· ǫchare calculated by taking the ratio of fully reconstructed MC events to MC generated events. The uncertainties represent the statistical uncertainties of the MC samples.
e+jets µ+jets ee+jets µµ+jets eµ+jets ℓτ+jets
Ach· ǫch(%) 14.02±0.02 17.88±0.02 7.09±0.04 19.74±0.08 9.50±0.04 4.36±0.02
Table 6: Measured number of events/pb−1for each channel and the number predicted by the SM. Data uncertain-ties are statistical only. The SM uncertainty is calculated using the theoretical uncertainty of the NNLO+NNLL calculation of the cross section.
Ne j Nµj Nee Nµµ Neµ Nℓτ Nℓj Nℓℓ Measured 30.62±0.26 30.57±0.29 3.06±0.12 3.19±0.10 6.06±0.12 6.39±0.30 61.19±0.40 12.31±0.20 SM 30.40±1.2 30.40±1.2 2.86±0.11 2.86±0.11 5.72±0.20 6.39±0.25 60.64±2.4 10.95±0.44
10 Systematic Uncertainties
Several sources of experimental and theoretical systematic uncertainty are considered. Lepton trig-ger, reconstruction and selection efficiencies are assessed in data and MC simulation by comparing the Z → ℓ+ℓ−events selected with the same object criteria as used for the tt analyses. Scale factors are ap-plied to MC samples when calculating acceptances to account for any differences between predicted and observed efficiencies. The scale factors are evaluated by comparing the observed efficiencies with those determined with simulated Z boson events. Systematic uncertainties on these scale factors are evaluated by varying the selection of events used in the efficiency measurements and by checking the stability of the measurements over the course of data taking. The modeling of the lepton momentum scale and reso-lution is studied with reconstructed invariant mass distributions of Z→ ℓ+ℓ−candidate events, and these distributions are used to adjust the simulation accordingly [36,37].
The jet energy scale (JES), jet energy resolution (JER), and their uncertainties are derived by combining information from test-beam data, LHC collision data and simulation. For jets within the acceptance, the JES uncertainty varies in the range 4%–8% as a function of jet pT and η [39]. The b-tagging efficiency
and its uncertainty is determined using a sample of jets containing muons [40]. The effect of all these variations on the final result is evaluated by varying each source of systematic uncertainty by±1σ in the MC-derived templates and fitting all the distributions with the new templates.
The uncertainty in the kinematic distributions of the tt signal events gives rise to systematic uncertainties in the signal acceptance, with contributions from the choice of generator, the modeling of initial- and final-state radiation (ISR/FSR) and the choice of PDF set. The generator uncertainty is evaluated by comparing the MC@NLO and ALPGEN [29] predictions with those of POWHEG [20] interfaced to either HERWIG or PYTHIA. The PDF uncertainty is evaluated following the PDF4LHC recommendation [45]. An event-by-event weighting is applied to a default MC@NLO sample that uses the central value of CT10 [28]. MSTW2008 [46] and NNPDF2.0 [47,48] sets are taken to estimate the systematic uncertainty due to the PDF. The uncertainty due to ISR/FSR is evaluated using the ALPGEN generator interfaced to the PYTHIA shower model, and by varying the parameters controlling ISR and FSR in a range consistent with experimental data [49]. The dominant uncertainty in this category of systematic uncertainties is
The τ identification uncertainty is derived from a template fit to the BDTjdistribution from an enriched
Z→ τ+τ−data sample selected with the same µ and τ candidate requirements as the sample for this anal-ysis, but with fewer than two jets and mT <20 GeV to remove W+jets events. The background templates
are the W+1-jet OS and the gluon template used in the fit to the t¯t data sample. The signal template is the BDTjdistribution from Z→ τ+τ−MC events. The uncertainty includes the statistical uncertainty of
the data samples, the uncertainty in the Z inclusive cross section measured by ATLAS [50] (excluding luminosity uncertainty) and jet energy scale uncertainty. The signal template shape uncertainty, estimated from fits to the Z → τ+τ− data sample, is found to be negligible. The uncertainty on the number of misidentified electrons (< 0.5%), determined from an enriched Z → e+e−data sample, is included. In addition there is an uncertainty in the correction applied to the τ background templates derived from W+jets data to account for the different ETdistribution of the τ candidates in the expected background to
tt→ ℓτhad+jets.
The calculated systematic uncertainties for the inclusive cross section measured with the ℓτhad+jet
chan-nel are given in Table7. Table8gives the systematic uncertainties estimated when combining all chan-nels. The uncertainty on the measured integrated luminosity is estimated to be 1.8% [51]. As expected the systematic uncertainties are substantially larger in the measurement of the cross section based on the
ℓτhad+jets channel alone than in the combination of all channels. The largest uncertainty in the
com-bined cross-section measurement and in the branching ratio measurements is due to the JES uncertainty, followed by the MC generator and the uncertainty in the heavy-flavor component of W+jets. The uncer-tainties on the measured branching ratios are significantly smaller than on the measured inclusive cross section, as expected due to cancellations. Bτhas a larger systematic uncertainty than the other branching
ratios due to uncertainties on τ identification that do not cancel in the ratios.
Table 7: Absolute systematic uncertainties, in pb, for the cross-section measurements with the tt → ℓτhad+jets channel. The e and µ uncertainties are the sum in quadrature of trigger, reconstruction and selection efficiency uncertainties. The τ identification uncertainty includes electrons misidentified as τ leptons.
Absolute uncertainties [pb]
µuncertainty 1.7
e uncertainty 3.0
Jet energy scale −5.5 / +6.8
Jet energy resolution 1.5
ISR/FSR 12.3 MC generator 10.1 PDF 0.6 b-tag −8.3 / +10.0 τidentification 8.0 τbackground correction 5.6 Total −22/+23 Luminosity 3.3
Table 8: Relative systematic uncertainties (%) for cross section and branching ratio measurements. The systematic uncertainties for Beand Bµ(not shown) are 100% correlated with the Bℓ uncertainties and of the same size. The e and µ uncertainties are the sum in quadrature of trigger, reconstruction and selection efficiency uncertainties. The MC generator uncertainty is the difference between POWHEG interfaced with PYTHIA and ALPGEN interfaced with HERWIG. HF stands for heavy-flavor.
σtt Bj Bℓ Bτ
µuncertainty 1.3 0.15 0.6 0.5
e uncertainty 1.1 0.15 0.5 0.5
Jet energy scale −6.9/ + 4.9 −1.6/ + 1.4 −1.9/ + 2.7 −3.8/ + 4.3
Jet energy resolution 1.2 0.3 0.8 0.7
ISR/FSR 2.0 0.3 1.3 4.0 MC generator 3.6 0.6 0.8 1.9 PDF 2.9 0.3 0.1 0.3 b-tag −1.3/ + 5.0 0.3 1.0 1.5 τidentification 0.5 0.15 1.1 3.5 τbackground correction 0.2 <0.1 <0.1 2.5 W+jets HF content −4.1/ + 2.7 −1.0/ + 0.7 −1.1/ + 2.3 −1.3/ + 2.1 Total −9.7/ + 9.2 −2.1/ + 1.8 −3.4/ + 4.2 −7.1/ + 7.6 Luminosity 1.8 <0.1 <0.1 <0.1 29