Effect of Solids on Gas-Liquid Mass Transfer in Three-Phase Bubble Columns
F. A. Rocha1, P. C. Mena1, J. A. Teixeira21Departamento de Engenharia Química, Faculdade de Engenharia, Universidade do Porto, Porto, PORTUGAL 2Centro de Engenharia Biológica – IBQF, Universidade do Minho, Braga, PORTUGAL
ABSTRACT
The effect of the solids on the mass transfer characteristics was studied experimentally in a bubble column for different multiphase systems. Volumetric liquid side mass transfer coefficient, kLa, specific interfacial area, a, and liquid side mass transfer coefficient, kL, were determined under different solid concentrations, gas flow rates and solid sizes. Bubble characteristics were obtained using an image analysis technique. It was found that the gas-liquid mass transfer process is influenced by the solid type, loading and size.
INTRODUCTION
Bubble columns are frequently used in industry as gas-liquid and gas-gas-liquid-solid contactors. Chemical or biochemical reactive operations, as well as the separation of mixtures by rectification, absorption, and waste-water treatment, can serve as examples of their application (Hong and Brauer, 1989). Recently, bubble columns have also gained increasing importance in the field of biotechnology (Álvarez, 2000).
In many industrial processes, the mass transfer of components from a gas phase to a liquid phase is a critical step. In multiphase systems, appearing in mechanically agitated reactors and bubble columns, gas-liquid mass transfer is, frequently, the rate determining step for the overall process. Therefore, the knowledge of gas-liquid mass transfer rates characterized by volumetric liquid side mass transfer coefficients, kLa, is required. Also a complete understanding of the effect of the operating parameters on each component of kLa, the liquid side mass transfer coefficient (kL) and the interfacial area (a) can be decisive.
In three phase systems, the presence of solid phase is an important parameter that may have a positive or negative effect on the mass transfer process. Thus, the effect of solid characteristics such as loading, size, density, shape and surface properties on gas-liquid mass transfer has been a challenging task for researchers. Yagi and Yoshida (1974) verified that the effect of dead microorganisms on the liquid phase mass transfer coefficient kL was negligible. However, the presence of such substances caused remarkable change in the bubble size distribution, and consequently decreased the gas holdup, the specific gas-liquid interfacial area a, and the volumetric mass transfer coefficient kLa. To study the effect of solids concentration on kLa, Albal et al. (1983) added glass beads and oil shale particles to water. For low values (2-5 vol.%) of the solids concentration, kLa increased by about 10%-30% and then decreased with further increases in the solids concentration. Sada et al. (1986) observed that the influence of fine suspended particles on bubble column performance depends upon the particle size. More recently, Freitas and Teixeira
(2001) showed that kLa diminishes with the increase in solids loading, especially for high airflow rates, due to an increase in bubble coalescence. Solid density also affects kLa.
Several methods exist for measuring the interfacial area in gas-liquid systems. In our case of gas-liquid-solid system, photographic and subsequent image analysis technique was used to determine different bubble characteristics such as superficial area, volume, size and shape. Volumetric mass transfer coefficients were obtained for different gas flow rates, solids loading and size. The influence of these variables on the liquid side mass transfer coefficient (kL) and interfacial area (a) was analyzed. The system used was air-water-particle.
EXPERIMENTAL Experimental set-up
In this work the contact device was a perspex cylindrical bubble column of 84 mm internal diameter, 3 mm thick and 600 mm high. A perspex rectangular box covers the column. The space between the column and the box is filled with water (the liquid under study) to avoid optical effects. This water was maintained at 25 ºC, through a thermostatic bath. The gas enters in a gas chamber and then passes through a sparger where the bubbles are formed. The sparger consists of 13 uniformly spaced needles with an inner diameter of 0.3 mm. The shape and size of the needles ensure the formation of small and well-defined bubbles. A complete scheme of the experimental set-up is shown in Mena et al. (2005).
Mass transfer experiments
Oxygen mass transfer experiments were performed in two and three-phase systems. Air and water were used as gas and liquid phases, respectively, and different types of solids were tested (polystyrene beads, calcium alginate beads, and hollow glass spheres). The experiments were done for several superficial gas velocities (up to 2.7x10⁻³ m3/s), and solid concentrations
(from 0 to 30 vol.%).
Initially the liquid is deoxygenated by bubbling nitrogen. When the dissolved oxygen concentration is zero, dry air is fed into the column. At this moment the oxygen transfer process from bubbles to the liquid begins and continues until oxygen concentration in the liquid reaches saturation. Dissolved oxygen concentration values are recorded directly on a PC, through a data acquisition board, and the dissolved oxygen concentration variation with time, t, is obtained. The mass balance for oxygen in the liquid is written as:
k
a
(
C
C
)
dt
dC
L⋅
−
=
* (1)being kLa the volumetric mass transfer coefficient, and C* and C, respectively, the oxygen solubility and the oxygen concentration in the liquid. Assuming the liquid phase homogeneous and C0 the oxygen concentration at t=0, the integration of the previous equation leads to:
(
C
*−
C
) (
=
ln
C
*−
C
0)
−
k
La
⋅
t
ln
(2)The volumetric mass transfer coefficient (kLa) can now be determined by plotting ln(C*-C) against time (t).
Image analysis experiments
In order to study the characteristics of the bubbles, images were grabbed with a monochrome video digital camera (Sony XCD-X700), which was connected to the frame grabber. Sets of images (1024x768 Pixels) were recorded for different gas velocities, solid loadings and sizes, for the same conditions used in mass transfer experiments. The most suitable lightning system was found to be backlight through a diffusing glass. The images were automatically treated, analyzed and several object descriptors were obtained for each bubble using a program running under VisilogTM 5.4 software (Noésis,
les Ulis, France). This was made only for the air-water-calcium alginate beads system.
After the image treatment, several shape and size characteristics of the bubbles were determined (Pons et al., 1997).
RESULTS AND DISCUSSION Air-water
Before three-phase system mass transfer study, air-water two-phase system experiments were performed. Experimental volumetric mass transfer coefficients for this system were compared with correlations presented in literature. The majority of the correlations underestimate the experimental values due to differences in the experimental conditions. A very good agreement is found with the Deckwer et al. (1974) correlation, which is of the form kLa = muGn, with parameters m and n equal to 1.174 and 0.82, respectively. Data for this system is presented in the following figures.
Air-water-calcium alginate beads
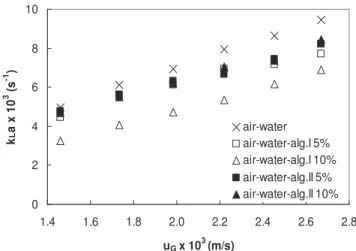
Calcium alginate beads of 1.2 mm diameter (alg.I) and 2.1 mm diameter (alg.II) were used. They were produced in laboratory through adequate process. Fig.1 shows how volumetric mass transfer coefficient, kLa, varies with superficial velocity, solid loading and solid size, for calcium alginate beads. In this case, experiments were done for two solid loadings (5 and 10 vol%). It can be seen from this figure that kLa increases with superficial gas velocity and decreases with the solid concentration. Furthermore, it seems that the solid effect becomes independent from solid loading for higher gas velocities. The results also indicate that the smaller particles have a
stronger effect on kLa. These results are reproducible with an average relative error of 5%.
0 2 4 6 8 10 1.4 1.6 1.8 2.0 2.2 2.4 2.6 2.8 uG x 103 (m/s) k L a x 10 3 (s -1 ) air-water air-water-alg.I 5% air-water-alg.I 10% air-water-alg.II 5% air-water-alg.II 10%
Fig. 1. Dependence of kLa on superficial gas velocity, solid loading and solid size.
An empirical correlation for kLa on the experimental variables superficial gas velocity, uG, particle diameter, dp, and solid volume fraction, eS, was developed, using the least squares method. In the present case of calcium alginate beads as solid phase, the volumetric mass transfer coefficient was correlated with the experimental variables as:
kLa = 2.29uG0.92 (1 + dp)0.92 (1 – eS)2.39 (3) The maximum and mean deviations between the experimental and correlated results are 19% and 5%, respectively.
Air-water- polystyrene beads
In these experiments three solid sizes (1100, 769.8, and 591.2 m) were investigated, for the solid loading range 0-30 vol%. The polystyrene beads (from BASF) were initially washed to remove very fine polystyrene particles present in the original product. These fine particles have a significant effect on mass transfer, as it was noticed in preliminary experiments.
With the experimental mass transfer data for polystyrene beads as solid phase and the three solid sizes, a general empirical correlation was obtained:
kLa = 1.01uG0.82 (1 + dp)0.97 (1 – eS)2.73 (4) Fig. 2 presents the results obtained for the polystyrene beads of 1100 m size. The volumetric mass transfer coefficient, kLa, increases with superficial gas velocity, and is strongly affected negatively by solid loading. The maximum and mean absolute deviations between the experimental and correlated results are only 24% and 8%, respectively.
The dependencies of the volumetric mass transfer coefficient on the superficial gas velocity and solid content, observed for the polystyrene beads of 769.8 m size, were similar to previous solid size, as can be seen in Fig. 3. In this case, the maximum and mean absolute deviations between the experimental and correlated
results are 26% and 8%, respectively. Finally, using the smallest polystyrene particles as solid phase, comparable general trend as previous ones was observed, but with some anomalies for higher solid content and intermediate superficial gas velocities (Fig.4).
0.001 0.002 0.003 0.004 0.005 0.006 0.007 0.008 0.009 0.01 0.0014 0.0016 0.0018 0.002 0.0022 0.0024 0.0026 0.0028 uG (m/s) k L a (s -1) 0% 5% 10% 15% 20% 25% 30%
Fig. 2. Dependence of kLa on superficial gas velocity for different polystyrene (dp = 1100 m) concentrations.
0.001 0.002 0.003 0.004 0.005 0.006 0.007 0.008 0.009 0.01 0.0014 0.0016 0.0018 0.002 0.0022 0.0024 0.0026 0.0028 uG (m/s) k L a (s -1) 0% 5% 10% 15% 20% 25% 30%
Fig. 3. Dependence of kLa on superficial gas velocity for different polystyrene (dp = 769.8 m) concentrations.
0.001 0.002 0.003 0.004 0.005 0.006 0.007 0.008 0.009 0.01 0.0014 0.0016 0.0018 0.002 0.0022 0.0024 0.0026 0.0028 uG (m/s) kL a (s -1) 0% 5% 10% 15% 20% 25% 30%
Fig. 4. Dependence of kLa on superficial gas velocity for different polystyrene (dp = 591.2 m) concentrations. As expected, the agreement between experimental and correlated data is not so good in this particular case, with a maximum and mean absolute deviations between the
experimental and correlated results of 29% and 11%, respectively.
Summarizing the main results for air-water-polystyrene systems, it was found that the volumetric mass transfer coefficient increases with the superficial gas velocity. This dependence is generally flattened for increasing solid content. When solid loading increases, the kLa values decrease. Regarding the effect of solid particle size on mass transfer coefficient, the influence of solid size is negligible for 5 vol% of solids. For the rest of solid loadings, the general trend indicates that decreasing solid size results in a reduction of the mass transfer coefficient.
Air-water- hollow glass spheres
In order to study the influence of fine particles on kLa, mass transfer experiments were conducted in a slurry composed by 9.6 m hollow glass spheres (Sphericel®)
as solid phase for concentrations up to 15 vol%. Fig. 5 shows that, as previously, the mass transfer coefficient increases with the superficial gas velocity. The same correlation as Eq. (4) was tested but, as expected, without success. 0.004 0.005 0.006 0.007 0.008 0.009 0.01 0.0014 0.0016 0.0018 0.002 0.0022 0.0024 0.0026 0.0028 uG (m/s) k L a (s -1 ) 0% 1% 2.5% 5% 10% 15%
Fig. 5. Dependence of kLa on superficial gas velocity for different hollow glass spheres (dp = 9.6 m)
concentrations.
A dual effect of solid loading on kLa happens. For low solid loading ( ~ 3vol%) the mass transfer coefficient increases as the solid content increases and then decreases with further solid additions.
Bubble characteristics
For all visualization experiments (Mena et al., 2005), several average bubble descriptors were obtained by image analysis for the air-water-calcium alginate system, namely the projected area and the Feret diameters. According to bubble characteristics, these were classified as elongated or flattened spheroids, and the respective superficial area and volume calculated as (Pereira, 1997). The bubble shape is affected by the superficial gas velocity, solid concentration and size and is expressed by the Fmax/Fmin ratio (see Fig. 6).
The concentration of solids is the parameter with the strongest effect on the bubble shape. The presence of solids makes the bubbles more rounded and this effect is more pronounced for the higher solids loading and for
the smaller particles, where the bubble sphericity goes close to 1. 1.2 1.4 1.6 1.8 2 1.4 1.6 1.8 2.0 2.2 2.4 2.6 2.8 uG x 103 (m/s) Fm ax /Fm in (-) air-water air-water-alg.I 5% air-water-alg.I 10% air-water-alg.II 5% air-water-alg.II 10%
Fig. 6. Fmax/Fmin ratio for the different experimental conditions.
Interfacial area
The specific interfacial area, a, is calculated using the following equation: L b
V
A
N
a
=
⋅
sup (5) where Nb is the number of bubbles in the column at a certain instant, Asup is the mean superficial area of the bubbles and VL is the liquid volume. The rise velocity of bubbles is calculated according to (Wesselingh and Bollen,1999) and is used for determine Nb. Fig. 7 showsthe results for the two solid sizes used (calcium alginate beads). The results are reproducible with an average relative error of 4%. 8 10 12 14 16 18 20 1.4 1.6 1.8 2.0 2.2 2.4 2.6 2.8 uG x 103 (m/s) a (m -1 ) air-water air-water-alg.I 5% air-water-alg.I 10% air-water-alg.II 5% air-water-alg.II 10%
Fig. 7. Dependence of interfacial area on superficial gas velocity, solid loading and solid size.
As foreseen, interfacial area increases with superficial gas velocity. Even as bubbles become larger, since the
number of bubbles formed increases, and at this bubble size range the rise velocity is nearly constant, the total superficial area also increases.
For these experimental conditions, the effect of solids is negligible except for the smaller particles where one notices a significant decrease of interfacial area at the higher solid loading. This may be due to an increase of bubble coalescence leading to a decrease in total superficial area (Zahradnik et al. 1992).
Liquid side mass transfer coefficient
The liquid side mass transfer coefficient, kL, can be calculated from the values of kLa and a previously determined. Fig. 8 presents the results (Mena et al., 2005) for the two solid sizes used (calcium alginate beads). kLvalues reflect the previously reported values of kLa and a. It is observed a conjugate effect of the solid size and concentration on kL, similar to kLa behaviour. The strongest effect occurs for the smaller particles and at higher concentrations. 2 3 4 5 6 1.4 1.6 1.8 2.0 2.2 2.4 2.6 2.8
u
Gx 10
3(m/s)
k
Lx
10
4(m
/s
)
air-water air-water-alg.I 5% air-water-alg.I 10% air-water-alg.II 5% air-water-alg.II 10%Fig. 8. Dependence of liquid side mass transfer coefficient on superficial gas velocity, solid loading and solid size.
CONCLUSIONS
The gas-liquid mass transfer process was investigated in a three-phase bubble column. The main purpose was to analyze the effect of certain solid properties on the gas-liquid mass transfer. The solid characteristics under study were the solid type, loading and size. At certain operating conditions, the individualization of the effect of those solid characteristics on the volumetric mass transfer coefficient kLa components, the liquid side mass transfer coefficient kLand the gas-liquid interfacial area a, was achieved. In order to do that, a bubble column was designed and an adequate experimental facility was built up. The volumetric mass transfer coefficient kLa was determined by the dynamic method and the gas-liquid interfacial area a and other bubble characteristics were determined through an image analysis technique. This technique was found to be suitable and practical especially for air-water and air-water-calcium alginate beads systems under the operating conditions used, since the calculated values of the specific interfacial area are reproducible. However, image analysis revealed limitations for other three-phase systems, mainly at higher solid loadings and superficial gas velocities. Experimental kLa values for the different used systems
were correlated as a function of superficial gas velocity, particle size, and fraction of solids. kLa increases with superficial gas velocity. The solids affect negatively the volumetric liquid side mass transfer coefficient, and the size of the particles can have a significant influence. The effect of the particles depends, also, on their nature. The bubble shape is also affected by the presence of solids. The bubbles become more rounded as the solid concentration increases and the solid size decreases. The image analysis results show that the solids tend to decrease the total interfacial area, and this effect is more pronounced for higher solid concentrations and smaller particle sizes. Determining kL from the experimental values of a and kLa, one can infer that kL increases with superficial gas velocity and decreases with solid concentration, this last effect being more important for the smaller particles
NOMENCLATURE
Asup mean superficial area of the bubbles
a gas-liquid interfacial area per unit of volume C oxygen concentration in the liquid
C0 oxygen concentration in the liquid at t=0
C* oxygen solubility d diameter e volume fraction
Fmax maximum Feret diameter
Fmin minimum Feret diameter
kL individual liquid-side mass transfer coefficient
kLa volumetric mass transfer coefficient
m slope at the origin of Eq. kLa = muGn
Nb number of bubbles in the column at a certain time
n exponent of Eq. kLa = muGn
t time
uG superficial gas velocity
V volume Subscripts L liquid p particle S solid REFERENCES
Albal, R. S., Shah, Y. T., Schumpe, A. (1983): “Mass Transfer in Multiphase Agitated Contactors”. Chemical Engineering Journal, 27, pp. 61-80.
Álvarez, E., Sanjurjo, B., Cancela, A., Navaza, J.M. (2000): “Mass transfer and influence of physical properties of solutions in a bubble column”. Chemical Engineering Research and Design, 78(A), pp. 889-893. Deckwer, W. D., Burckhart, R., Zoll, G., (1974): “Mixing and mass transfer in tall bubble columns”. Chemical Engineering Science, 29, pp. 2177-2188.
Freitas, C., Teixeira, J. A. (2001): “Oxygen mass transfer in a high solids loading three-phase internal-loop airlift reactor”. Chemical Engineering Journal, 84 (1), pp. 57-61.
Hong, W.-H., Brauer, H. (1989): “Gas-liquid mass transfer in bubble-column reactors”. International Chemical Engineering, 29(3), pp. 388-434.
Mena, P.C., Pons, M.N., Teixeira, J.A., Rocha, F.A. (2005): “Using image analysis in the study of multiphase gas absorption”. Chemical Engineering Science, 60 (18), pp. 5144-5150.
Pereira, I. (1997). “Estudos de transferência de
oxigénio em colunas de borbulhamento”, Ph. D. Thesis, Faculdade de Engenharia, Universidade do Porto, Portugal.
Pons, M. N., Vivier, H., Dodds, J. (1997) : « Particle shape characterization using morphological descriptors”.
Particle & Particle Systems Characterization, 14, pp. 272-277.
Sada, E., Kumazawa, H., Lee, C. H. (1986): “Influences of Suspended Fine Particles on Gas Holdup and Mass Transfer Characteristics in a Slurry Bubble Column”.
A.I.Ch.E. Journal, Vol. 32 (5), pp. 853-856. Wesselingh, J. A., Bollen, A. M. (1999): “Single
particles, bubbles and drops: Their velocities and mass transfer coefficients”. Chemical Engineering Research Design, 77, Part A, pp. 89-96.
Yagi, H, Yoshida, F. (1974). “Oxygen Absorption in Fermenters - Effects of Surfactants, Antifoaming Agents, and Sterilized Cells”. Journal of Fermentation
Technology, 52, 12, pp. 905-916.
Zahradnik, J., Drápal, L., Kastánek, F., Reznickova, J. (1992): “Hydrodynamic and mass transfer
characteristics of sectionalized aerated slurry reactors”.