Effects of oxygen availability on hematological parameters,
immune status, gill histomorphology and gene expression of
Senegalese sole (Solea senegalensis): the role of acute
hyperoxia.
Diogo Brazão Taveira Malheiro
Dissertação de Mestrado em Ciências do Mar e Recursos Marinhos –
Especialidade em Aquacultura e Pescas
Effects of oxygen availability on hematological parameters, immune status,
gill histomorphology and gene expression of Senegalese sole (Solea
senegalensis): the role of acute hyperoxia.
Dissertação de Candidatura ao grau de
Mestre em Ciências do Mar e
Recursos Marinhos - Esp. em
Aquacultura e Pescas submetida ao
Instituto de Ciências Biomédicas de
Abel Salazar da Universidade do
Porto.
Orientador - Doutor Benjamín Costas
Categoria – Investigador Post - Doc
Afiliação - Centro Interdisciplinar de
Investigação Marinha e Ambiental da
Universidade do Porto
Co-orientador - Professor Doutor
António Afonso
Categoria – Professor Associado
Afiliação - Instituto de Ciências
Biomédicas Abel Salazar da
Universidade do Porto
iii
Acknowledgements
After a long year facing many hardships, be it in an emotional and working level, I have finally come across the completion of yet another step in my journey. This however would never have been possible if it were not for a close group of people that helped me along the way.
First and foremost, I would like to thank Benjamín for believing in me and enduring with me for almost a year (I know this was no easy task). For being a mentor and constant presence in my work, always there to land a helping hand. Thank you for your patience and compromise, especially after so many hard blows to the work.
Thank you so much, Marina for the constant help in the lab, being there for me at all times, having so much patience with me, giving me advices all the time, explaining how everything worked and guiding me when needed. Your companionship during this year was amazing and I really am thankful to you. You are a truly remarkable person, a great friend and I wish you all the best! You deserve it!
Special thanks to Prof. Afonso for letting me work on his lab and receiving me in such a remarkable way. Thank you for the preoccupation, words of incentive, insightful advice, suggestions and, most of all, being there for me when needed.
A big thank you to Rita, Carolina, Lorena, Diana and Mahmod. Thank you for all the help given, laughs and friendship. Without you my days at the lab would not have been the same.
Thank you to Ana Couto for the invaluable help with gill histology, as that is clearly a field where I am no expert.
I also have to thank Jon Stevensen and Maria João Peixoto, for helping me so much. After all, without Jon’s equipment this work would not have been possible. Their presence and advices were essential for the continuation of my work.
I would also like to thank people at CIIMAR, that were not directly involved in my work but cared for me and with whom I had great conversations.
iv
Abstract
Senegalese sole (Solea senegalensis) is a very attractive candidate for aquaculture due to its commercial value, despite its cultivation being hampered by different stressors and several infectious diseases responsible for high mortalities in its farming production. The low and high availability of oxygen occurring in the environment (named hypoxia and hyperoxia, respectively) is identified as a possible stressor for aquatic organisms, despite its consequences to Senegalese sole being still fairly unknown. Therefore, the present study aimed to assess the effects of oxygen availability in hematological parameters, immune status, gill morphology and gene expression on Senegalese sole. Fish around 30 g were exposed to different levels of dissolved oxygen for 4 and 24 hours. Mild hypoxia was established at 80% (negative control) while 2 hyperoxic conditions were tested (150 and 200%). Fish reared under normoxic conditions (100% dissolved oxygen) served as positive control. Supersaturation was obtained by injection of pure O2 into the chambers, with a stable level of O2 being kept in the chambers using an optimized oxygen regulator and analyzer. Following 4 and 24 hours fish were removed from the tanks and sampled to assess hematological (total and differential blood cell counts, hematocrit and hemoglobin) and innate immune (lysozyme, peroxidase) parameters as well as bactericidal activity, alterations in gill morphology and gene expression.
No mortalities were recorded during the course of the study. Regarding the hematological status of fish, hemoglobin increased significantly for the highest level of hyperoxia exposition tested (200%) after 4 and 24h exposure, while erythrocyte level was significantly higher for the 200% saturation after an exposition of 24h. Hematocrit (Ht) and red blood cells (RBC) levels were also higher for mild hypoxia when compared to normoxia.
Regarding the immune status, white blood cells (WBC) levels decreased for the 150% saturation after 4h of exposition and they also decreased for the 200% saturation after 24h of exposition compared to normoxia and mild hypoxia. Proportion of thrombocytes, lymphocytes, monocytes and neutrophils decreased at 200% saturation compared to normoxia and mild hypoxia, after 24h of exposition. Monocyte levels were also inferior for the same exposition period in the 150% saturation. When comparing exposition times, the 24h exposition to 200% saturation decreased in lymphocytes,
v
monocytes and neutrophils numbers when compared to the 4h exposition at the same saturation. Other immune parameters such as plasma lysozyme and peroxidase activities showed no significant alterations.
Glutathione peroxidase (GPX) expression in the head-kidney did not change among oxygen saturations and exposure time, suggesting there was no significant effect on this particular oxidative stress enzyme.
In summary, the present study suggests that 200% oxygen saturation presents an effect in hematological status with increasing red blood cells and hemoglobin after an exposition of 24 hours. Moreover, oxidative stress was not observed as indicated by no changes in GPX expression in fish exposed to hyperoxia. Thus, no negative conditions were recorded in this study after 24 hours of hyperoxia exposure. Nevertheless, further studies will be needed with higher exposition times and saturation levels tested to assess if hyperoxia can be truly beneficial and applied in fish farms in order to improve the conditions in which fish are hold.
Key-words: Senegalese sole; welfare; water oxygenation; hematology; immune responses; cell response; humoral parameters; oxidative stress
vi
Resumo
O linguado senegalês é um forte candidato para aquacultura devido ao seu valor comercial. No entanto, o seu processo de produção é limitado por diferentes factores de stress e várias doenças infecciosas responsáveis por altas taxas de mortalidade. A elevada ou baixa disponibilidade de oxigénio que ocorre no ambiente (hiperóxia e hipóxia respectivamente) é identificada como um possível factor de stress para os organismos aquáticos apesar das suas consequências ao nível da produção do linguado senegalês serem ainda pouco conhecidas. Assim sendo, este estudo visou avaliar os efeitos da disponibilidade do oxigénio nos parâmetros hematológicos, estado imunológico, morfologia das brânquias e na expressão genética no linguado senegalês. Peixes com cerca de 30g foram expostos a diferentes níveis de oxigénio dissolvido durante 4 a 24h. O nível moderado de hipóxia foi estabelecido nos 80% (controlo negativo) sendo que duas condições de hiperóxia foram testadas (150 e 200%). Os peixes criados sob condições de normóxia (100% de oxigénio dissolvido) constituíram o controlo positivo. Foi obtido um estado de supersaturação através da injecção de O2 puro nas câmaras de ensaio, mantendo um nível estável de O2, usando um regulador e analisador de oxigénio optimizado. Após os intervalos de tempo de 4 e 24h, os peixes foram removidos das câmaras de ensaio e sujeitos à colheita de amostras para identificar parâmetros hematológicos (contagem total e diferencial de células sanguíneas, hematócrito e hemoglobina) e imunológicos inatos (lisozima, peroxidase), bem como a actividade bactericida, alterações na morfologia branquial e expressão genética.
Nenhuma morte foi registada durante a duração do estudo. No que respeita ao estado hematológico do peixe, a hemoglobina aumentou significativamente para o nível mais elevado de exposição à hiperoxia testado (200%) após uma exposição de 4 e 24 horas, enquanto que o nível de eritrócitos foi significativamente maior para a exposição de 200% após uma exposição de 24 horas. O Hematócrito (Ht) e níveis de eritrócitos (RBC) também foram mais elevados para o nível moderado de hipoxia quando comparado com normoxia.
Em relação ao estado imunitário, os níveis de glóbulos brancos (WBC) diminuíram para a saturação de 150% após 4 horas de exposição e também diminuíram para a saturação de 200% após 24 horas de exposição quando comparado com normóxia e nível moderado de hipóxia. A proporção de trombócitos, linfócitos, monócitos e neutrófilos diminuiu na saturação de 200% comparado com normóxia e nível moderado de hipóxia, após 24 horas de exposição. Os níveis de monócitos também foram inferiores para o
vii
mesmo período de exposição na saturação de 150%. Aquando da comparação de tempos de exposição, a exposição de 24 horas à saturação de 200% causou um decréscimo nos números de linfócitos, monócitos e neutrófilos quando comparado com a exposição de 4 horas à mesma saturação. Outros parâmetros imunitários como a actividade da lisozima presente no plasma e a actividade da peroxidase não mostraram quaisquer alterações significativas.
A expressão de Glutationa peroxidasee (GPX) no rim anterior não sofreu alterações nas saturações de oxigénio testadas e durante o tempo de exposição, sugerindo não haver um efeito significativo nesta enzima de stress oxidativo.
Em suma, o presente estudo sugere que, em relação ao estado hematológico, uma saturação de 200% de oxigénio provoca um aumento de células sanguíneas e de hemoglobina após uma exposição de 24h. Mais ainda, não foi observado stress oxidativo como indicado pela ausência de alterações na expressão de GPX dos peixes expostos a hiperóxia. Assim, não foram encontradas alterações negativas após 24h de exposição a hiperóxia. No entanto, serão necessárias mais investigações que testem tempos de exposição mais prolongados e maiores níveis de saturação de oxigénio para avaliar se a hiperóxia poderá ser verdadeiramente benéfica e aplicada nas pisciculturas, de modo a melhorar as condições a que os peixes estão sujeitos.
Palavras-chave: Linguado senegalês; bem-estar; oxigenação da água; hematologia; resposta imunitária; resposta celular, parâmetros humorais; stress oxidativo
viii
Index
Introduction ... 1 World Aquaculture ... 1 Aquaculture in Portugal ... 3 Senegalese sole ... 5Aquaculture concerns in Senegalese sole ... 6
Immune System of fish ... 8
Effects of hypoxia and hyperoxia in fish ... 11
Oxidative stress ... 14
Scope of thesis ... 16
Material and Methods ... 17
Experimental design ... 17
Hematological procedure ... 20
Humoral parameters analysis ... 22
Gill analysis ... 24 Gene expression ... 24 Statistical analysis ... 26 Results ... 27 Discussion ... 34 Conclusion ... 39 References ... 40
1
Introduction
World Aquaculture
Aquaculture is defined as the science and technology related to production of aquatic species, with its main purpose being an increase in production that surpasses the natural capacities of these species (White et al., 2004). Due to the combined effects of overfishing, pollution, habitat destruction, ecological and biotic changes caused by global warming, as well as many other human activities, the ocean resources are being depleted at an alarming rate (White et al., 2004). This includes stocks of marine species that are being exploited and are very close to their maximum sustainable limits. Thus, aquaculture is important to improve and create additional means of producing fish and serve as a supplement to the production of wild capture fisheries (White et al., 2004). Aquaculture may therefore serve as an essential provider and supplier of food to an ever-growing demanding population and increase its importance even more in the nearby future.
World’s fish consumption per capita has increased from an average of 9.9 kg in the 1960s to 19.2 kg in 2012 (FAO, 2014). Following up to this, fish production has been increasing during the last decades, and according to recent studies the demand for more production will not stop growing. This increase is mainly associated with population growth, better incomes, urbanization, an improvement in the distribution channels and the worldwide expansion of fish production (Imsland et al., 2003). Developed countries are still the ones that consume more fish as of 2014 although fish consumption in developing countries is clearly improving and straightening the distance to developing countries (FAO, 2014). Total world capture in 2011 was of 93.7 million tons, reaching the second highest ever value, only below the 93.8 million tons produced in 1996. In 2012 it was also registered a new maximum production total of 86.6 million tons (FAO, 2014).
In 2010 fish protein accounted for about 16.7 percent of total animal protein intake by the world population and 6.5 percent of total protein consumed. These stats demonstrate how important fish proteins can be in the diet of millions of people, especially in overly populated areas (FAO, 2014).
Aquaculture and fisheries production has reached a total of 158 million tons, in 2012, with 136 million being entirely for human consumption (Figure 1 and 2). Global aquaculture production continues to expand and has reached an all-time gross of 90.4
2
million tons, consisting 66.6 million of food fish and the other 23.8 million of aquatic algae, in 2014, which roughly estimates in 144 billion dollars. The global fish aquaculture has continuously been improving, with an expansion of 49.9 million to 66.6 million tons only in the 2007-2012 period (Figure 1). Between 2000-2012, word aquaculture production has had an average annual rate growing of 6.2% (FAO, 2014).
Figure 1 - World fisheries and aquaculture production and utilization, Source: FAO (2014)
About 10 to 12% of the world’s population depends on the fisheries and aquaculture activity to sustain their livelihood (FAO, 2014). Fish continues to be one of the most traded commodities worldwide being of special importance to developing countries and, in some cases, accounting for more than half of the total traded commodities by these countries (FAO, 2014). In 2012, 10% of the total agricultural exports corresponded to fish and related fishery products. Although developing countries continue to dominate worldwide trade of fishery products, in recent years their dominance has been decreasing. This can be explained by the rapid rising of developing countries in the worldwide fish trade during the recent decades (FAO, 2014).
World aquaculture production is separated in 2 types, inland aquaculture and mariculture. Inland aquaculture normally uses freshwater albeit there are production operations that use saline water. Mariculture is related to productions operations in the sea as well as land-based production facilities. Inland aquaculture growth has surpassed
3
mariculture growth, being the main contributor to the total food fish production worldwide (Sardinha, 2009; FAO, 2014).
From the organisms produced in aquaculture, freshwater fish dominate the world production with about 56.4% (approximately 33.7 million tons), followed by molluscs with 23.6% (14.2 million tons), crustaceans with 9.6% (5.7 million tons), diadromous fish with 6.0% (3,6 million tons), marine fish with 3.1% (1.8 million tons) and other aquatic organisms with 1.4% (814 300 tons) (FAO, 2014).
Figure 2 – World capture fisheries and aquaculture production, source: FAO 2014
Aquaculture in Portugal
Located in the region further west of the Iberian Peninsula and bordered by the Atlantic Ocean to the north and west, Portugal is the most western country in Europe. The Algarve region at the far east of the south coast also exhibits a strong influence from the Mediterranean Sea. Although Portugal is a small country, with only 88.700 km2 area, its mainland stretches along 780 km of the Atlantic coastline (JNICT, 1990). In spite of its small area it has two major climate systems. The north side of Portugal is a colder, mountainous region comprising most of the country’s rivers and reservoirs more suitable for the production of cold water species such as rainbow trout (Oncorhynchus mykiss) and flatfish (turbot- Scophthalmus maximus; Senegalese sole– Solea senegalensis) (Gouveia, 2014). The center and specially the south of the country (the Alentejo and Algarve regions) contain a drier, warmer plain, more suitable for the production of warmer water species due to the influence of the Mediterranean Ocean. These include European sea
4
bass (Dicentrachus labrax), gilthead sea bream (Sparus aurata), meagre (Argyrosomus regius), red porgy (Pagrus pagrus) and white sea bream (Diplodus sagrus) (Gouveia, 2014).
Nowadays, the Algarve region is the most important Portuguese marine aquaculture region, comprising 45 percent of national production (INE, 2011). Besides the Portuguese mainland, Portugal also includes the Azores archipelago (2.344 km2) and the island of Madeira (796 km2), both located in the Atlantic Ocean, 1380 km from the Portuguese coast and 660 km from the West African Coast, respectively (JNICT, 1990). Madeira has a significant on-growing marine fish production industry, mainly farming gilthead sea bream (Gouveia, 2014).
Portugal as an aquaculture producer has a great potential, being considered an European potency. Due to its great exposition to the sea, having a great coastal area as well as excellent ambient conditions, Portugal is quite privileged geographically speaking. In part owing to the incoming water from the Mediterranean Sea, Portugal tends to have water at moderate temperatures (varying between 13º C and 18º C). According to the reasons above, Portugal has more than enough proper conditions for the aquaculture production of a number of species with economic value (Sardinha, 2009; FAO, 2014).
One of the things that also make Portugal so attractive for the aquaculture activity is the fact that Portugal tends to rate quite high in the overall world fish consumption placing very close to countries like Japan (the main consumer of fish in the world). The fact that the national fishing activity has stagnated, and having in account the overall country’s fish consumption, it is of great importance to boost aquaculture activity in Portugal, and in this manner create alternatives to the traditional ways of fish supplying (FAO, 2014). Still, Portugal is lacking in some things that could, otherwise, make aquaculture activity way easier to be established. The main reasons for this are related to bureaucracy and legal problems, with the establishment of facilities being quite hard owing to the long legal processes until the obtainment of permission (Sardinha, 2009).
5
Senegalese sole
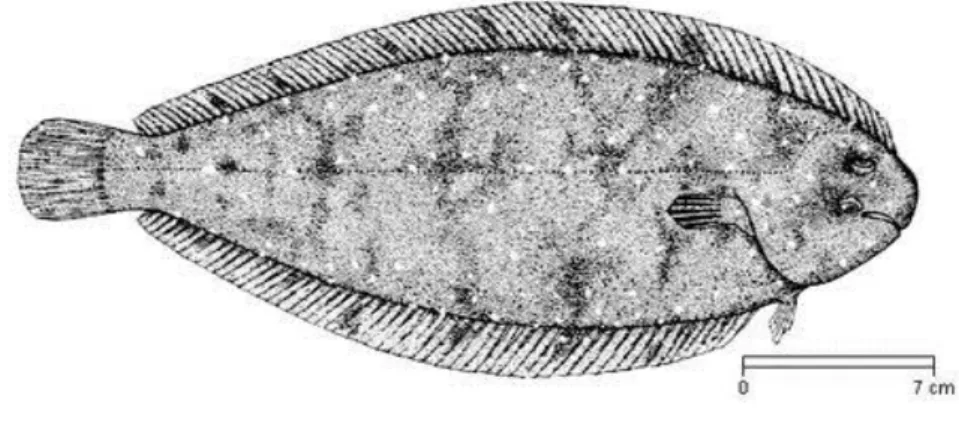
The Senegalese sole, Solea senegalensis (Kaup, 1858) (Figure 3) is a flatfish with oval and asymmetric body (eyes on the right side). It is commonly found in the Atlantic, from the Gulf of Biscay to the coasts of Senegal. It can also be found, more rarely, in the western Mediterranean. This species is very similar to the common sole, S. solea, a species whose distribution is more to the north, from the North Sea to the Moroccan coast. It is very difficult to distinguish larvae between both species (Lagardère et al., 1979).
Figure 3 – Solea senegalensis Source: FAO (2012)
It is a benthonic marine species living in sandy or muddy bottoms, off coastal areas up to 100 meters depth. It feeds mainly on benthonic invertebrates, like for example larvae from polychaetes and bivalve molluscs. It may occasionally feed on small crustaceans. Studies made to analyze stomach contents showed a prevalence of polychaetes, but amphipods, copepods and isopods were also found (Drake and Arias, 1989).
This species is gonochoric, with females reaching maturity at around 3 years, with a close size to 32 cm (Ramos, 1982). It naturally spawns from March to June (Ramos, 1982). When it reaches sexual maturity the growth rate decreases dramatically (Dinis, 1986).
6
Senegalese sole is more commonly found in warm climates than its relative common sole, being amply raised in semi-extensive earthen ponds and land-based facilities in Southern Spain (Rodriguez, 1984; Manzano, 1993; Dinis et al., 1999) and Portugal (Dinis, 1986; Pousão-Ferreira, 1993; Dinis et al., 1999). In Portugal it is also being explored intensively in the northern region (Ramalho and Dinis, 2010).
Senegalese sole growth in captivity is quite satisfactory (Olmedo et al., 2003; Rodriguez and Souto, 2003) and hatchery reproduction has been improving (Anguís and Cañavate, 2005; García Lopez, 2006). Adding to this, larval rearing and weaning are not problematic issues (Salas-Leiton, 2009).
According to the reasons cited, Senegalese sole is a very attractive candidate for marine aquaculture and has a very big potential for future farming at commercial scale. However, despite the constant increase of sole production in both Portugal and Spain, there are still unresolved problems with its production, its cultivation being hampered by its high sensitivity to different stressors and to several infectious diseases that can cause large mortalities (Imsland et al., 2003; Costas et al., 2008). Abnormal pigmentation and morphological malformation is another current issue and, while the fish is perfectly healthy, apart from these malformations, marketing will be more difficult due to the strange appearance of the fish (Dinis, 1996). Adding to this, growth and survival from juvenile to market-size fish is not fully controlled with regard to rearing technology and husbandry conditions, feeding behavior and nutritional requirements.
Aquaculture concerns in Senegalese sole
The environment in which an animal grows will impact its physiology and behavior in several ways, both in a negative and positive manner. So it is of vital of importance to know how the aquaculture systems may affect the fish in numerous ways. It has been proven that factors such as light, salinity, temperature, pH and oxygen should be manipulated very carefully so that fish may have a proper and healthy development (Bowden, 2008). If by any chance, one of these factors is not well controlled, stress will be induced into the fish. Depending on the type of stressor, as well as the duration of the exposure and its intensity, the out-coming result may go from a quick recovery to everlasting imbalances of the fish organism and, in more severe cases, up to the death
7
(Bowden, 2008). Other stress inducers also arise due to high stocking density (Costas et al., 2008), handling (Aragão et al., 2008) and confinement of the fish (Tort, 2011). Since these factors may have negative impacts to the fish well-being and development, it is of vital importance to apply good management practices in fish farms, to minimize potential economic losses that could arise from stress effects.
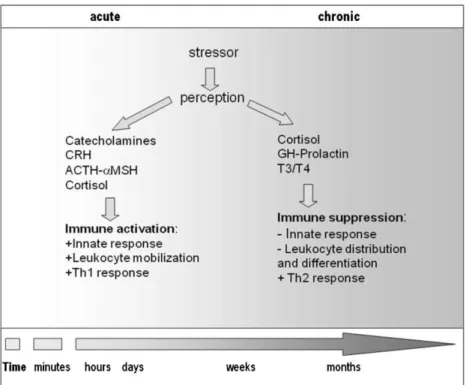
It has been shown in several studies that after animals are subjected to stress, the chances of being afflicted by diseases increase significantly. This can be explained by the allocation of resources to face the stress-inducing challenge, leaving the immune system in a weaker, less efficient state, and therefore more susceptible to pathogens (Ellis, 2001; Tort, 2011). Depending on the nature of the stressor, i.e. acute or chronic, the consequences may lead to different responses (Figure 4). In a fish farm, especially if it uses intensive recirculating aquaculture systems, fish have higher chances of suffering from chronic stress, owing to environmental (water quality and hypoxia) and health conditions (diseases and parasites) (Oliva-Teles, 2012). Chronic situations such as those, where the intensity of the stressor is low but persistent, are not very common in nature, yet these situations are normally found in fish subjected to anthropogenic activities like pollution and aquaculture (Tort, 2011). Chronic stress tends to be more exhausting to the organism, as it is normally associated with longer exposition, making it more demanding to the organism in terms of resources and energy spent to cope with it.
In fish, the well-known negative effects of stress on the immune system are associated to maladaptive responses to chronic stressors (Tort, 2011). For example, cortisol - used as a general indicator of stress conditions in teleost fish (Mommsen et al., 1999), since its plasma levels increase significantly in response to several stressors (Acerete et al., 2004) - may decrease the number of lymphocytes, suppress phagocytic and complement activities in head-kidney and blood as well as increase susceptibility to infection (Ortuño et al., 2001). Nevertheless, acute cortisol levels may also induce the immune system to react more rapidly and effectively to possible consequences from a stressor, improving its adaptive function to environmental stressors (Verburg-van Kemenade et al., 2009).
8
Figure 4 – Stress and immune response, Source: Tort, 2011
Immune System of fish
For multicellular organisms such as fish, effective mechanisms are needed to combat all kinds of pathogens encountered in the environment. This is done through the immune system. According to the complexity of the organism and its necessities, the immune system is divided into innate and specific. On primitive multicellular organisms one will only find the innate immune system, while in more complex organisms both the innate and acquired immune systems are present – this includes all species of fish, even the more primitive ones like lampreys (Tort, 2011).
The innate immune system is characterized by a more rapid and nonspecific response, being divided in physical barriers, cellular and humoral components (Whyte, 2007). It is the first line of defense against possible infections having a complex connection with the specific immune system. Signals emerging due to cell stress and tissue damage will activate the innate immune system and, using co-stimulators, it will proceed to activate and determine the nature of the specific response (Magnadottir, 2006; Muiswinkel, 2014). Another very important function is the maintenance of homeostasis of the organism, keeping a cellular and molecular equilibrium. This is accomplished during the renewal and maintenance immediately after injuries or inflammatory responses taken by the body, as well as during natural processes of cell death (Magnadottir, 2006).
9
The specific (also known as adaptive) immune system is primarily composed of highly specialized cells and processes that recognize specific antigens through the so-called antigen presentation, causing responses to eliminate specific pathogens and infected cells (Janeway et al., 2005; Rauta et al., 2012). One important aspect of the specific immune system is the acquiring of immunological memory, in which, after contact with a specific pathogen and subsequent response, all further encounters with the same pathogen will lead to an increase of the effectiveness of the immunological response (Janeway et al., 2005; Rauta et al., 2012). The immune system, thanks to this process, will be prepared for future infections caused by the same pathogen, unleashing a way quicker and more effective response (Parkin, 2001; Rauta et al., 2012).
Although the innate response is faster than the specific one, it can lead to the damage of own healthy tissues, due to a lack of specificity. This will not happen in the specific response, since it is a quite precise mechanism (Magnadottir, 2010). However, acquired immunological mechanisms are highly complex, specific and present great diversity and memory, making specific immunity biologically costing and time-consuming, taking days or even weeks to reach its terminus (Parkin, 2001; Rauta et al., 2012).
The innate immune system encompasses a wide range of different defense mechanisms, each with its own singular purpose. Epidermis, fish scales and the mucous from the skin constitute the physical barriers and first line of defense against pathogens (Ellis, 2001; Magnadottir, 2006; Whyte, 2007). Mucous, in particular, has been widely studied, and aside from the obvious involvement of pathogens and its slowing of pathogen propagation, it also has a lot of components that have antimicrobial properties, such as lysozyme, lectins, antibacterial peptides among others (Whyte, 2007; Magnadottir, 2010). If these barriers are overcome by pathogens, there are still immune mechanisms to neutralize these threats, for instance cellular defenses, humoral factors and inflammation process (Whyte, 2007; Magnadottir, 2010; Muiswinkel, 2014).
The cellular defenses of the immune system encompass a myriad of different cell types with the most distinguished ones being leucocytes and thrombocytes (Ellis, 2001; Magnadottir, 2006). Thrombocytes’ function is to stop bleeding by means of blood clotting, gathering at the injury site and plugging the hole. In fish they are complete cells (opposing the mammal platelets that are only a fragment of cells). Their shape is typically fusiform but can vary (Esteban et al., 2000; Robert and Ellis, 2012). Leucocytes are divided in several different types involved in both the innate and adaptive response. These include monocytes/macrophages and granulocytes, such as neutrophils, and lymphocytes (Secombes, 1996; Ellis, 2001, Magnadottir, 2006).
10
Cellular defenses from the innate arm of the fish immune system include the phagocytic cells (neutrophils and macrophages) – these produce cell compounds with antimicrobial properties activated during the inflammation process -non-specific cytotoxic cells, endothelial cells and dendritic-like cells (Evans et al., 1992; Secombes et al., 1996; Dalmo et al., 1997; Whyte, 2007; Muiswinkel, 2014). Phagocytic cells act primarily to prevent or mitigate the initial spread of the infectious organism and its growth (Magnadottir, 2006; Neumann et al., 2011). Macrophages are typically mononuclear and normally peroxidase negative, being present in all body cavities (Secombes, 1996). Neutrophils, on the other hand, are normally polymorphonuclear, being encountered in blood and in a reserve pool in the hematopoietic organs, and more scarcely, in tissues and body cavities (Afonso et al., 1998; Secombes, 1996). Neutrophils are identified due to their granules staining in reaction to specific dyes and enzymes, such as peroxidase (Afonso et al., 1998). Both these phagocytic cells are responsible for a process called phagocytosis that includes chemotaxis, attachment, ingestion, degranulation, intracellular killing and intracellular digestion (Parkin, 2001). One important reaction that takes place during this process is known as respiratory burst, which basically degrades pathogens and destroys bacteria through the release of reactive oxygen species and nitric oxide (NO),since these are powerful antimicrobicidal agents (Whyte, 2007; Costas et al, 2013; Muiswinkel, 2014).
Humoral factors relates to all kind of macromolecules responsible for immunity that are present in body fluids (Yano, 1996). Humoral factors are present both in the adaptive and innate immune system. For the innate system, the humoral factors consist of complement proteins (biochemical cascade with several pathways, responsible for complementing phagocytic cells in the elimination of pathogens) (Ellis, 2001) and antimicrobial peptides as well as other components also found in these extracellular fluids, such as lysozyme and interferons (Bols, 2001; Whyte, 2007). For instance, lysozyme is an enzyme found commonly in tissues and fluids of fish, particularly the mucous, acting on the walls of Gram-positive bacteria damaging them (it acts on the peptidoglycan layer of the wall disrupting the glycosidic bonds) (Bols, 2001; Ellis, 2001). Interferons are essential in the host immune defense against viruses, bacteria, parasites and tumor cells, being capable of inducing apoptosis and inhibiting cell proliferation (Samuel, 1991; Bols, 2001; Ellis, 2001; Seppola et al., 2007; Whyte, 2007; Secombes, 2011).
11
Effects of hypoxia and hyperoxia in fish
When a body is not supplied with enough oxygen - having in that case a low oxygen level in its organic tissues - it is considered that the body suffers from the pathologic condition named hypoxia. Although there are many definitions of this condition, the more widely used is the one that considers any level of dissolved oxygen that is low enough so as to cause negative effects on the physiology and behavior of an organism (Boleza et al., 2001). Hypoxia naturally occurs in aquatic systems, being caused by a great number of factors, for example pollution, eutrophication, natural phenomenon like photoperiod and temperature, water flow rate, etc. (Boleza et al., 2001).
The availability of oxygen in water is one of the most important water quality parameters in aquaculture (Timmons et al., 2001). Most of modern day aquaculture facilities produce fish at high densities and, since oxygen consumption is way higher than normal, the oxygen provided to the system may not be enough to supply all the fish with oxygen, thus they will start suffering from hypoxia. If this is left unchanged high mortalities will naturally ensue (Bunch and Bejerano, 1997).
Furthermore, hypoxia facilitates the susceptibility of fish to pathogens, as has been shown in several studies made with tilapia and carps where hypoxia levels contributed to an increase of infection with Streptococcus sp. (Bunch and Bejerano, 1997; Boleza et al., 2001). Also, outbreaks of diseases occur more easily, as is the case with mycobacteriosis in fish (Vogelbein et al., 1999). There is an increase of carbon dioxide pressure in the organism due to respiration, which typically leads to respiratory acidosis (low pH), as the level of dissolved oxygen is too low to maintain an equilibrium, following up to the increasing carbon dioxide in the system (Bunch and Bejerano, 1997). If exposed to hypoxia conditions, an increase of ammonia toxicity naturally follows as was proven in studies with freshwater fish, Sparus aurata and turbot (Scophthalmus maximus) (Thurston et al., 1981; Wajsbrot et al., 1991; Person-Le Ruyet et al., 1997). Exposure to hypoxia causes an increase in hemoglobin concentration and erythrocyte number. Hemoglobin is also capable of binding oxygen in a more effective way. Hypoxia induces other type of physiological changes, such as increasing gill diffusion and increasing the gill surface area so that the oxygen levels can be maintained at an appropriate level (Randall and Kuiter, 1982; Randall and Taylor, 1988; Wu and Woo, 1984).
Hypoxia seems to affect negatively the immune system of organisms, limit and in more severe cases shut down mechanisms of the immune system. One of these cases is the respiratory burst of phagocytic cells (Feldman et al., 1990). Moreover, the complement
12
system may also be suppressed but the reports are still conflicting on this case, as one particular study showed a decrease in the complement haemolytic activity on channel catfish, yet other studies showed no changes to the complement system (Ortuño et al., 2002; Welker et al., 2007).
While hypoxia is associated with low oxygen levels in the water, the opposite case also exists, and is defined as hyperoxia – an excess of oxygen in body tissues or in the environment (Mach et al., 2011).
Having in consideration that many fish farms need to concern with the levels of oxygen - due to increasing stocking densities, deficient water supply and organic waste - inducing these systems with oxygen supplementation may in fact benefit fish (Person-Le Ruyet et al., 2002). Many factors have to be taken in consideration to determine the optimum level of O2 saturation for farmed fish, the most important ones being growth rate and the cost of O2 (Crampton et al., 2003). If a farming facility is capable of maintaining the oxygen saturation at an optimum level that leads to an increase in the growth rate while not consuming too much oxygen, production as well as income will augment significantly (Bergheim et al., 2005). One way of improving saturation levels is by increasing water exchange rate, adding O2 in the water or simply by reducing the biomass of the rearing units. However, supplementing oxygen to the water, spending more energy to improve water exchange and reducing stocking density will affect the total income of the facility. All these variables incur on higher costs due to increased use of energy and oxygen, or because of reduced productivity as biomass is decreased (Bergheim et al., 2005).
Some farming industries, such as the salmon one, are known for supplementing oxygen to supersaturate the water with O2, as farmers believe it will improve the potential growth and even increase the pathogen resistance in salmons (Calldwell and Hinshaw., 1994). There are still doubts as to what extent and how, especially on the long term, the supersaturation of oxygen affects fish (Person-Le Ruyet et al., 2002). And while there are some studies that tried to indulge on this subject, the conclusions were not sufficient to support the idea of O2 supersaturation enhancing growth and improving the immune system. Some evidence does exist that moderate hyperoxia can improve growth of fish as was proven in some studies (Sargolia et al., 1995; Foss et al., 2002; Hosfeld et al., 2008), but still other studies failed to prove any improvement in the growth of fish under hyperoxic conditions when compared with normoxic conditions (Edsall and Smith, 1990; Calldwell and Hinshaw, 1994; Person-Le Ruyet et al., 2002). Growth in other flat-fish has also been studied but no significant growth was noticed, as was the case with turbot
13
exposed to 147% and 223% saturation compared with normoxic conditions (Person-Le Ruyet et al., 2003). Also, ammonia tolerance can be improved in rearing fish by increasing oxygen saturation above normoxia, as was proven with spotted wolfish (Foss et al., 2003). Nevertheless, supersaturation can still be harmful to fish depending on the concentration of O2 and the duration of exposition, and in more severe cases even cause mortalities (Calldwell and Hinshaw., 1995; Lygren et al., 2000; Ritola et al., 2002; Fridell et al., 2007). One needs to have in consideration the toxicity of oxygen and how it may vary depending of the species, life stage and overall conditions in which the animals are kept, as a hyperoxic threshold exists for every single organism (Colt and White., 1991).
The physiological effects caused by hyperoxia are a decrease in breathing due to decreased ventilation frequency that leads to accumulation of CO2 in the blood causing respiratory acidosis (Dejours, 1977), imbalance in gill ion concentrations induced by respiratory acidosis (Brauner et al., 2000), as well as reduced branchial chloride cell fractional surface area (Goss et al., 1994). In some cases, during transportation, pure O2 is added to the water and some negative effects are registered such as plasma ion imbalance, hypercapnia, respiratory acidosis and stress in Atlantic salmon smolts (Brauner et al., 2000). Other kind of disturbances are also observed when measuring stress indicators, with effects on hematocrit, hemoglobin, osmolality, cortisol, lactate and glucose (Calldwell and Hinshaw., 1995), and plasma chloride (Brauner et al., 2000). Immunologically, hyperoxia was found to increase the antibody levels in a study developed on the effects of water oxygenation on the immune system of the European sea bass, as higher concentrations of antibodies were present in the sera of fish held under hyperoxic conditions than in the sera of fish held under normoxic conditions (Mazzini et al., 1998), although more studies are needed to discover how fish may benefit from this, since there is still a lack of information about the influence of oxygen concentration on the antibody response in fish (Bowden, 2008).
14
Oxidative stress
Exposure to hypoxia and hyperoxia can be potentially dangerous to aquatic organisms such as fish, causing overall damages to the organism limiting its growth and causing a lower biomass production, aggravating therefore aquaculture production (Wedemeyer, 1997). The exposure to hyperoxia causes a reduction of gill ventilation and an elevation of the partial pressure of CO2 in blood, contributing to respiratory acidosis. While respiratory acidosis can easily be nullified or compensated within days, the major problem derives from gill oxidative damage (Brauner et al., 2000). The extreme ambient conditions of both hypoxia and hyperoxia may cause serious damage in tissue lipids, proteins, DNA and other key molecules (Kregelet Zhang, 2007; Kowaltowski et al., 2009). Damages are mostly done by reactive oxygen species (ROS), these being essentially by-products of the reduction of O2 into energy and water. ROS, such as superoxide radical, hydrogen peroxide and hydroxyl radical are known to cause oxidative stress in fish in case the antioxidant defenses are overwhelmed and cannot fight back the pro-antioxidant forces, leading to changes in molecular and membrane structures that end up causing cell and tissue damage (Reznick et al., 1998). These antioxidant forces, protecting the aquatic organisms, refer mainly to antioxidant enzymes and low molecular weight scavengers. Antioxidant enzymes may therefore serve as possible markers of oxidative stress in aquatic organisms (Armstrong, 2002). Antioxidant enzymes include: Cu/Zn superoxide dismutase (SOD) which are metaloenzymes that act as catalyzers of the dismutation of superoxide anion into O2 and hydrogen peroxide (H2O2); Catalase (CAT) which reduces H2O2 to water in the peroxisomes while glutathione peroxidase (GPX) has the same function in cytosol. From these antioxidant enzymes, GPX activity is considered the most important one for measuring oxidative stress, since it is also the one that provides greater protection against this stress (Livingstone, 2003; Valavanidis et al., 2006).
Early studies with hypoxia actually considered ROS levels would be lower as the main substrate needed for ROS generation would be less available. However, such was not the case, as was determined in studies with mammals, showing ROS levels increasing when exposed to hypoxia (Abramov et al., 2007; Bell et al., 2007; Bickler et al., 2007). In non-mammals the same results seemed to occur, with an increase in ROS levels. Oxidative damage was observed in fish after hypoxia exposure and specifically in hypoxia-sensitive species (Lushchak et al., 2005; Behn et al., 2007)
15
Hyperoxia studies in fish focusing on pro-oxidant and antioxidant effects are relatively scarce (Ritola et al., 2000; Ritola et al, 2001; Livingstone et al., 2002; Welker et al., 2013). Nonetheless, effects on both antioxidant defenses and oxidative damage were observed. Continuous exposure to hyperoxigenation has been known to cause DNA stand-breaks in gills and activate hepatic glutathione-dependent defense systems in rainbow trout (Livingstone., 2001; Livingstone et al., 2002; Ritola et al., 2002), as well cause increases in lipid peroxidation and oxidized glutathione (Lushchak et al., 2006; Finne et al., 2008).
Activation of antioxidant defenses causes an overexpression of GPX, SOD and CAT mRNAs levels triggered by hyperoxia levels (Finne et al., 2008; Welker et al., 2013). mRNA levels provide an analysis of cell activity, with single mRNA expressions being useful as biomarkers of a particular stress in animals. The hyperoxia-induced regulation of gene expression in fish is still poorly known. A study made with Atlantic salmon exposed to slight hyperoxia (130% oxygen saturation) for a prolonged period of time showed that levels of hepatic CuZnSOD, catalase and GPX mRNAs had no significant differences when compared to the levels under normoxia (Olsvik et al., 2005). Rainbow trout hepatocytes maintained in hyperoxia conditions showed an increase of mRNA levels of GPX and SOD (Finne et al., 2008). Atlantic cod (Gadus morhua L.) also showed an increase in hepatic GPX mRNA levels after an exposition to hyperoxia (140% oxygen saturation) in comparison to the normoxia group (Olsvik et al., 2006). In a study with Solea senegalensis, there was an overexpression of hepatic antioxidant-related proteins after exposure to hyperoxia (223% O2 saturation) (Salas-Leiton et al., 2009).
16
Scope of thesis
Indeed, few studies have been developed to completely understand the full consequences of hypoxia and hyperoxia on the immune system of fish as well as how affected is the specific gene expression of a possible biomarker of oxidative stress in Senegalese sole (Glutathione peroxidase), with no study being focused on both these subjects in this particular species. While hypoxia is known to affect fish in a negative way, there are still many uncertainties on how fish may actually cope with hyperoxia and to what extent, especially at the immune system level. Thus, the aim of this work is to give further insights on Senegalese sole’s immune system, gene expression, gill morphology and cellular status following hyperoxia exposure, being fish submitted to different O2 saturations ranging from mild hypoxia to O2 supersaturation.
17
Material and Methods
Experimental design
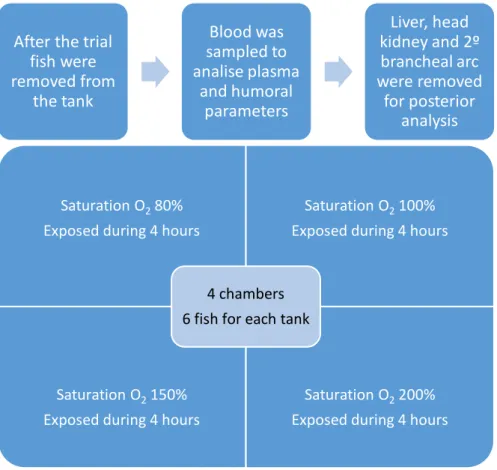
The trial was performed at the Centro Interdisciplinar de Investigação Marinha e Ambiental (CIIMAR) facilities (Porto, Portugal). Healthy Senegalese sole juveniles (30 ± 4.65 g wet weight) were obtained from a commercial fish farm, located in north-west Portugal (Aquacria, Aveiro, Portugal). Fish were maintained in recirculating aerated sea water according to standard protocols, with daily control of water parameters in a stock tank. The water was kept around 20°C, salinity at 24 ppm and dissolved oxygen at 96%. The fish were kept at a photoperiod of 12 hours of light and 12 hours of darkness. Fish were fed once a day to apparent satiety. Necessary cleanings were frequently done as well as daily parameter control of the water with control of the ammonia and nitrite levels, and in case these levels were not appropriate the proper adjusts would be made, such as doing regular water changes. Prior to each experiment, fish were removed from the stock tank and distributed among 18 L tanks filled with 8 L of seawater. The same daily procedures described above were performed in these experimental tanks to guarantee acclimatization. These tanks were all connected to a sump having constant water flux, with filtration being obtained through mechanical and biological filters. Six fish were assigned to each tank and exposed to different levels of dissolved oxygen. Mild hypoxia was established at 80% (negative control) while 2 hyperoxic conditions were tested (150, 200%). Fish reared under normoxic conditions (100% dissolved oxygen) served as positive control. Following 4 and 24 hours fish were removed from the tanks and sampled to assess gill damage, hematological (total and differential blood cell counts, hematocrit and hemoglobin) and innate immune (lysozyme, peroxidase) parameters as well as bactericidal activity using Photobacterium damselae subsp. piscicida (Phdp) strain PP3 (Costas et al., 2011; Costas et al., 2013a; Costas et al., 2013b). Sampled head-kidney tissue was posteriorly used for analysis of gene expression.
18
Figure 5 – Diagram explaining the experimental design. The same procedure was developed for the 24 hours trial.
To achieve an oxygen saturation level of 80% in the tank, all air-stones were removed during the trial (the level of oxygen was stable and controlled using an oxygen analyser). To achieve normoxia, two air-stones were used in each tank, and the same oxygen analyser was used to control the O2 level. The supersaturation was obtained by injecting O2 gas to the experimental tanks using an oxygen cylinder. To adjust the supersaturation level within the chambers, an oxygen regulator and an analyzer were used (Oxy-Reg, Loligo Systems, Denmark) - (Figure 6). The valve from the O2 cylinder would open or close every single time the level of oxygen dropped or increased, to maintain the supersaturation level stable in the tank. This was achieved thanks to a solenoid valve that served as an intermediary between the oxygen cylinder and the Oxy-Reg analyser, and was connected to both devices. As soon as the oxygen level dropped below the saturation level needed for the trial, the solenoid valve would be opened by the Oxy-Reg analyser, allowing pumping of O2 from the cylinder to the tank. As soon as the oxygen saturation increased to the pretended level, the solenoid valve would receive orders to close from the Oxy-Reg analyser, stopping the O2 release into the tank.
After the trial
fish were
removed from
the tank
Blood was
sampled to
analise plasma
and humoral
parameters
Liver, head
kidney and 2º
brancheal arc
were removed
for posterior
analysis
Saturation O2 80%Exposed during 4 hours
Saturation O2 100%
Exposed during 4 hours
Saturation O2 150%
Exposed during 4 hours
Saturation O2 200%
Exposed during 4 hours
4 chambers 6 fish for each tank
19
For a constant and more precise monitorization of the O2 saturation, a temperature compensated, oxygen meter named Fibox-3 Trace Device (Figure 7) was used at the same time together with the Oxy-Reg analyser to be absolutely sure the correct amount of O2 was being released into the tank. An oxygen-sensitive optic fiber minisensor was placed in the tank to read the O2 saturation, with values being collected by the Fibox-3 Trace Device and in turn transmitted directly to the PC (Figure 8). Fibox-3 Trace software was used to register the values in a 1-second interval. This way, O2 level never deviated much from the saturation necessary for the respective trials, and was kept always at a stable level.
Figure 6 – Oxy-Reg analyzer. Source:
http://www.loligosystems.com
Figure 8 – Mounted system: In the left image, chamber shown with probes measuring the O2
saturation as well as temperature; in the middle image, it is shown the cylinder used for pumping O2 into the chambers; in the right image, values of O2 saturation being registered by
the Fibox-3 Trace Device are shown in the graphic.
Figure 7 – Fibox-3 Trace Device. Source: http://www.presens.de
20
Hematological procedure
After sampling the blood from the fish an analysis of the blood was made, involving these parameters:
1) Hematocrit, which is defined as packed cell volume or erythrocyte volume fraction is the volume (expressed in percentage) of red blood cells present at the total volume of blood. Basically, one fills a capillary tube with blood and then covers one of its ends with plasticine. Then these capillary tubes are placed in a hematocrit centrifuge during 10 minutes. After these 10 minutes, using a graphic reader, it is determined the percentage of red blood cells in the volume of blood, defined as RBC.
Figure 9 – Display of capillary tubes and hematocrit centrifuge in the left image (Source:
http://www.hawksley.co.uk) and hematocrit chart in the right image.
2) Hemoglobin was then determined using the Drabkin colorimetric method (SPINREACT, ref.:1001230, Spain), with the following indices indicating information about the size of red blood cells and hemoglobin content.
3) Mean corpuscular volume (MCV) is the average size of a red blood cell: (Hematocrit (%) / RBC (106μl)) × 10
4) Mean corposcular hemoglobin (MCH) is the average amount of hemoglobin distributed for each red blood cell: (Hemoglobin (g/dl / RBC (106μl)) x 10
5) Mean corposcular hemoglobin concentration (MCHC) is the average concentration of hemoglobin for each unit volume of red blood cells: Hemoglobin (g/dl) / Hematocrit (%)) x 100
6) For the counting of red blood cells (RBC) and white blood cells (WBC) 2 solutions were prepared: for the white blood cells the solution was prepared from a dilution of 1/20 of homogenized blood in Hank’s balanced salt solution mixed with heparin
21
(10 units/ml); for the RBC the solution was prepared mixing a dilution of 1/200 of homogenized blood in Hank’s salt solution with heparin at the exact same concentration used for the WBC. After these solutions were prepared the counting of the cells was made using an optic microscope and a Neubauer chamber. As the concentrations of both solutions were different, WBC results are provided in the concentration of 104/μl and RBC are presented in 106/μl.
7) Preparation and counting of blood smears:
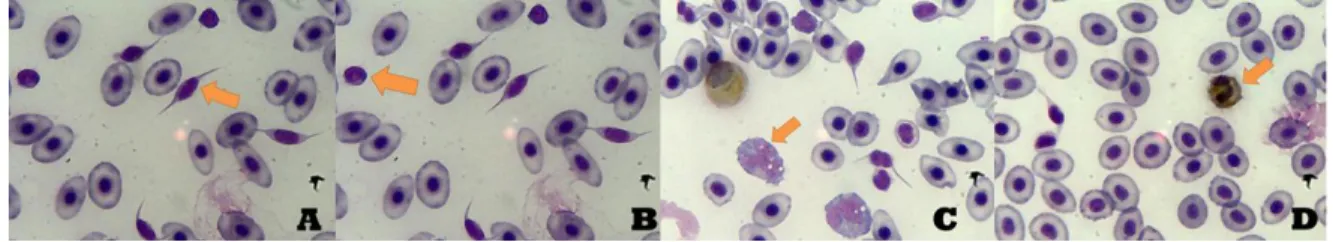
After the blood extraction from the fish was made, a blood smear was prepared by placing a drop of homogenized blood in one of the ends of the slide, and then, using another slide, spreading the entire drop through the slide. It was then left to dry. Afterwards, the smear was stained with Wright’s stain, fixation occurred during 1 minute using formol-ethanol (10% of formol and 90% of ethanol). After that a technique named Antonow’s was executed, with the blood smear being left in the Antonow’s stain for 15 minutes – this technique stains neutrophils as it detects the peroxidase activity performed by these cells (Afonso et al., 1998). The slides were counted at the microscope using the 100x objective. Oil immersion was necessary to observe the cells or else they would appear blurred, as oil immersion increases the resolution considerably. A total of 200 WBC were counted, with differentiation being made between these cells and catalogued under thrombocytes, lymphocytes, monocytes and neutrophils. Percentage and total concentration of each type of cell were determined after this procedure.
Figure 10 – During the microscope observation after the stain of the slide, these were the primarily identified white blood cells. Letter A corresponds to thrombocytes, B to lymphocytes, C to monocytes and D to neutrophils.
22
Humoral parameters analysis
Lysozyme –
Lysozyme activity was measured using a turbidimetric assay based on the method described by Ellis (1990) with some modifications (Wu et al., 2007). The turbidimetric method is used to determine the concentration of a substance in a solution. Measuring the loss in intensity of a light beam (with known wavelength) through a cuvette containing a solution with suspended particulate matter, a measurement is then given for the amount of absorbed light, that allows the determination of the substance concentration (Mary et al., 1994).
Using the samples collected, a standard bacterial suspension was added, and in turn read the absorbance in a spectrophotometer immediately after the addition of the bacteria and 4.5 minutes later. The difference found in the results is due to the bacterial lysis that occurs leading to a decrease in the number of bacteria present, and therefore less absorbance.
The solution was prepared by adding 0.05 M of sodium phosphate buffer (Na2HPO4) to 0.05 mg/mL-1 of Micrococcus lysodeikticus, with a pH of 6.2. After the solution was prepared, it was added to a microplate, and afterwards 15 μl of sampled plasma was added. Each well of the microplate was filled with a total of 265 μl of solution (15 μl from the plasma and 250 μl from the bacterial suspended solution), with triplicates being made for each sample. The absorbance was read at 450 nm in a Synergy HT microplate reader, 0.5 and 4.5 minutes later. For the determination of the amount of lysozyme present, a standard curve was made, since the equation of the curve is what allows the calculus of the lysozyme present in the plasma samples. This was achieved using Lyophilized hen egg white lysozyme and diluting it in 0.05 M of sodium phosphate buffer, once again in a pH of 6.2. Each solution had a decreasing amount of lysozyme present.
Peroxidase Activity -
For the determination of total peroxidase activity in plasma, the following procedure was executed:
15 μl of plasma serum was diluted in 135 μl of HBSS free of Ca2+ and Mg2+ in a 96-well plates. After that, 50 μl of 10 mM 3,3’, 5,5’- tetramethylbenzidine hydrochloride (TMB; Sigma) as well as 50 μl of 5 mM H2O2 were added into the solution. A reaction occurred
23
immediately after the addition of these compounds, resulting in a color change. This reaction was stopped after 2 minutes as 50 μl of 2 M sulphuric acid (H2SO4) was added into the solution. The optical density was read at 450 nm in a Synergy HT microplate reader, Biotek. 150 μl of HBSS free of Ca2+ and Mg2+were added to three wells to serve as blanks. Peroxidase activity was then measured having in account that one unit of peroxidase inflicts an absorbance change of 1 unit in the optic density (OD).
Bactericidal Activity –
Photobacterium damselae subsp. piscicida (Phdp) strain PP3 was used in the bactericidal activity assay. Bacteria were cultured for 48 h at 25 °C on tryptic soy agar (TSA; Difco Laboratories) and then inoculated into tryptic soy broth (TSB; Difco 21 Laboratories), both supplemented with NaCl to a final concentration of 1% (w/v). Bacteria in TSB medium were then cultured during 24h at the same temperature, with continuous shaking (100 rpm). Exponentially growing bacteria were collected by centrifugation at 3500 × g for 30 minutes, resuspended in sterile HBSS and adjusted to 1 × 10⁶ cfu ml-1. Plating serial dilutions of the suspensions onto TSA plates and counting the number of cfu following incubation at 25 °C confirmed bacterial concentration of the inoculum.
In a round-bottom 96-well plate, in triplicates, 20 µl of plasma and 20 µl of Phdp were incubated for 2.5h at 25°C. Hank´s balanced salt solution instead of plasma was used for positive control. To each well, was added 25 µl of MTT (3-(4,5 dimethyl-2-yl)-2,5-diphenyl tetrazolium bromide) and incubated for 10 minutes at 25°C to allow the formation of formazan. Plates were then centrifuged at 2000 x g for 10 min. The precipitate was dissolved in 200 µl of DMSO (dimethyl sulfoxide) and transferred to a flat-botom 96-well plate. The absorbance of the dissolved formazan was recorded at 560 nm. Bactericidal capacity is calculated by comparison with the reference sample (positive control) and is expressed in percentage.
% 𝐯𝐢𝐚𝐛𝐥𝐞𝐛𝐚𝐜𝐭𝐞𝐫𝐢𝐚
=
𝐒𝐚𝐦𝐩𝐥𝐞𝐀𝐛𝐬. 𝐱𝟏𝟎𝟎 𝐀𝐛𝐬. 𝐨𝐟𝐭𝐡𝐞𝐫𝐞𝐟𝐞𝐫𝐞𝐧𝐜𝐞𝐬𝐚𝐦𝐩𝐥𝐞24
Gill analysis
Gill sampling -
Samples were immediately fixed in phosphate buffered formalin (4%, pH 7.4) for 24h and subsequently transferred to ethanol (70%) until further processing.
Histology -
Gills samples were submerged in 1:50 w/v EDTA (0.5M; pH=7.8) for 5 days, to decalcify, and further processed and sectioned using standard histological techniques. Sections were stained with hematoxylin and eosin. Blinded evaluation was performed with particular attention to hyperplasia and /or cell hypertrophy, edema and telangiectases, abnormal vacuolization or gas bubbles in the primary lamellae, abnormal frequency of mucous and chloride cells, and infiltration of inflammatory cells. Three qualitative classes were established to classify the histomorphology of the gills: 1) normal, 2) with mild alterations and 3) with severe alterations.
Gene expression
RNA Extraction from head-kidney and gene expression analysis -
Total RNA was extracted from head-kidney slices using Trizol reagent (Invitrogen, Life Technologies) according to the manufacturer’s instructions and stored in 100·μL
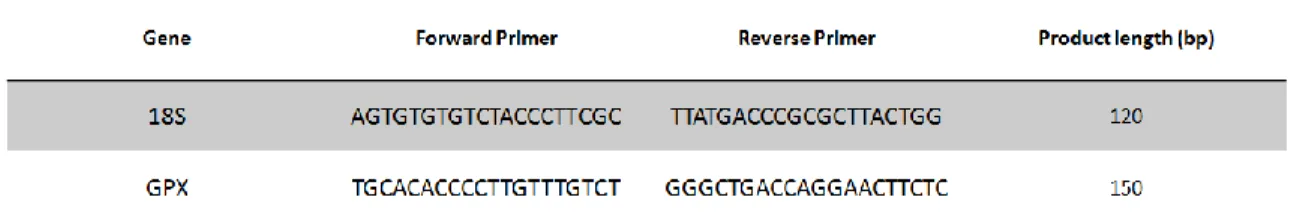
RNase-free MilliQ H2O. Genomic DNA was eliminated from the samples by DNase treatment according to the manufacturer’s instructions (Grisp, Portugal). The RNA was stored at -80ºC before further processing. The concentration and integrity of total RNA were assessed by measuring the absorbance at 260 nm and electrophoresis on 0.8% agarose gel, respectively. Total RNA (1μg) from each sample was reverse-transcribed using NZY First-Strand cDNA Synthesis Kit (NZYTech, Lisbon, Portugal) following the manufacturer’s instructions. The cDNA was then diluted in sterile distilled water (1:5 dilution), and the diluted cDNA preparation was used for semi-quantitative RT-PCR. The expression pattern was analyzed by semi-quantitative RT-PCR and the primer GPX1 was used for amplifying the GPX gene. The PCR condition consisted of a denaturation cycle of 94ºC for 5 min, followed by 30 PCR cycles each consisting of 94ºC for 30 s, 55ºC for 30 s and 72ºC for 30 s. Extension time in the last cycle was increased for 10 min. As an internal control, 18S mRNA was also amplified with 30 cycles by the primers of 18S-F and
25
18S-R. The PCR primers sequences used to quantify the mRNA levels of genes of interest are given in table 1. The RNA sequences of 18S and GPX were obtained from the following GenBank accession numbers: EF126042 and HM068301, respectively. A 5 μL product of each PCR reaction was electrophoresed through 1.5% agarose gel and stained with Green Safe (NZYtech, Lisbon, Portugal) and then detected under UV light. Multi-gauge Fujifilm was used for gel analysis.
Figure 11 – Agarose gel from PCR reaction detected under UV light Table 1 – Nucleotide sequences of PCR primers used for semi-quantitative RT-PCR. One housekeeping gene (18S) was run and used for the calculation of mean normalized expression.
26
Statistical analysis
Statistical analysis was made using the computer program Statistica 12 for Windows, with data being analyzed for normality and homogeneity of variance using Levene’s test, before proceeding with a two-way ANOVA test (since the data analysis was made for two parameters, Time and Saturation). In case it was needed, data would be transformed for posterior statistical analysis. Tukey’s test was used to assert significant differences between the different saturations as well as between the four and twenty-four hours trials. The level of significance was of P ≤ 0.05 for the tests made, and all results provided in tables and graphs are showed in means and standard deviation (means ± SD).
27
Results
Table 2 presents the absolute values of the hematological analysis. Hemoglobin and RBC levels increased significantly with the exposition time from 4 h to 24 h, for all saturations, while MCV decreased significantly with the exposition time from 4 h to 24 h, for all saturations.
Hematocrit and Hemoglobin levels showed significant differences between oxygen saturations, regardless of the exposure time. Hematocrit levels were significantly higher for fish reared at 80% when compared to 100% and 150% saturation. Hemoglobin levels also increased significantly in fish reared at 200% saturation, when compared to 80% and 100% saturation.
MCV, MCH and MCHC remained unchanged among different oxygen saturations and exposure time, while RBC and WBC did present significant differences in the interaction effect saturation x time. RBC increased significantly in fish reared at 200% saturation, from 4 hours to 24 hours exposition. Also, for the 24 hours exposition time, fish reared at 80% and 200% saturation showed a significant increase in RBC when compared to the control (100%). Regarding WBC, for the 4 hours exposition, a significant decrease was observed from 80% and 100% saturation to 150% saturation. For the 24 hours exposition, a significant decrease of WBC occurred from 80% and 100% saturation to 200% saturation.
Table 3 presents the absolute values of the different WBC and thrombocytes. Both WBC and thrombocytes showed significant differences among oxygen saturations, regardless of the exposure time. Both 150% and 200% saturation had overall the lowest concentration of these cell types, the only exception being for neutrophils with the lowest values being registered in the control group.
The interaction between saturation and time was significantly different for all cell types. Thrombocytes, for the 24 hours exposition, decreased significantly in fish reared at the 200% saturation when comparing to the 80% and 100% saturation. Lymphocyte levels presented a significant decrease in fish reared at 200% saturation, from the 4 hours exposition to the 24 hours exposition. Moreover, for the 24 hours exposition, a significant decrease of lymphocytes was observed in fish reared at 200% saturation when comparing with all the other saturations.
28
Monocyte levels decreased significantly with the exposition time from 4 h to 24 h, for all saturations. Also, monocytes presented a general decrease in the 150% saturation when compared to the control, after a 4h exposition. For the 24h exposition, monocyte concentration was significantly higher for the control and 80% saturation than 150% and 200%. Significant differences occurred for the same saturation at different exposition times, with the 200% saturation presenting monopenia in the 24h exposition when compared with the 4h exposition.
Finally, neutrophils concentration showed a significant increase in the 200% saturation in relation with the control and 150% saturation, after a 4h exposition. For the 24h exposition, a significant increase of neutrophils concentration was observed in the 80% saturation when compared to the 200% saturation. When comparing values of the same saturation but different exposition time, a significant decrease of neutrophils occurred in fish exposed to 200% saturation, from 4h to 24h of exposition.
29
Table 2. Hematocrit, hemoglobin, mean corpuscular volume (MCV), mean corpuscular hemoglobin (MCH), mean corpuscular hemoglobin concentration (MCHC), red blood cells (RBC) and white blood cells (WBC) in Senegalese sole exposed to different O2 saturations during 4 and 24 hours.
Presented values correspond to mean and standard deviation (means ± SD), respectively. Different letters determine that significant differences existed among saturations for the same time of exposition. The asterisk means that significant differences occurred for the same saturation at different times (2-way ANOVA, P≤ 0.05; n = 12).
30
Table 3. Concentration of Thrombocytes, Lymphocytes, Monocytes and Neutrophils from Senegalese sole exposed to different O2saturations after 4 and 24
hours exposition, respectively.
Presented values correspond to mean and standard deviation (means ± SD), respectively. Different letters determine that significant differences existed among saturations for the same time of exposition. The asterisk means that significant differences occurred for the same satu ration at different times (2-way ANOVA, P≤ 0.05; n = 12).