Correlations between Dynamic Penetrometer Light and Cone
Penetration Tests in Intermediate Soils: a Statistical Comparison
Claver Pinheiro;
CONSTRUCT-GEO, Universidade do Porto, Portugal, [email protected] Fausto Molina-Gómez;
CONSTRUCT-GEO, Universidade do Porto, Portugal, [email protected] Sara Rios;
CONSTRUCT-GEO, Universidade do Porto, Portugal, [email protected] António Viana da Fonseca;
CONSTRUCT-GEO, Universidade do Porto, Portugal, [email protected] Tiago Miranda;
ISISE, Universidade do Minho, Portugal, [email protected]
ABSTRACT: This paper presents a statistical approach to evaluate the variation between current correlation models of Dynamic Penetrometer Light (DPL) against Piezocone Penetration Test (CPT) results. Work methodology included the execution of three DPL tests and three CPT at the left bank of Ave River (Vila do Conde, Portugal) and the calculation of the cone resistance through DPL correlations. Besides, addressed a comparison of the values obtained from such correlations and the measured values by the CPTu device by the measures profiles technique. Statistical analyses allowed identifying the level of parallelism, horizontality and coincidence between results in depth. From the results, it was found that the existing correlations between DPL and CPT are not accurate for intermediate soils and it is necessary to develop a new correlation for this type of materials.
KEY WORDS: cone resistance, in situ tests, repeated measures profiles, statistical analysis.
1 INTRODUCTION
Soil identification on the field includes several testing techniques. One of the most popular of such techniques is cone penetration test (CPT). This test provides an in situ characterization of the soil almost continuously. Besides, the CPT has a strong theoretical background, which allows identifying physical and mechanical soil properties.
However, some countries do not use the CPT for all its construction projects. For this reason, the literature presents models to correlate results between different field techniques. Such correlations relate CPT values with standard penetration test (SPT), pressuremeter test (PMT) dilatometer test (DMT) and light weight dynamic penetrometer test (DPL) (Ruge et al.
2018). Hamid (2015) presented a brief overview of the DPL and its historical development, correlations with soil parameters, and relationship with different instruments. Lingwanda et al. (2015) compared, statically, DPL test results with CPT to facilitate the transformation of DPL data and increase its applicability in Tanzania. Dos Santos & Bicalho (2017) provides some insights about DPL-CPT correlations and the proposed new correlations between such tests for the city of Vitoria (Brazil). The aim of this paper is to present a statistical comparison between the dynamic cone resistance (qd) obtained from the energy
transformation of the DPL results against the cone resistance (qc) measured through CPT
device. Both types of tests were performed very close to each other the shipyard on the left bank
of Ave River (Vila do Conde, Portugal). The statistical assessment addressed the analysis of repeated measures profiles (RMP) and the linear regression assessment. Therefore, the document structure is the following. The first section corresponds the materials and method of the work research, which includes a description of the study site, DPL test and RMP technique. The second section presents the tests results and the statistical analysis. Finally, the third section shows the conclusions of this work.
2 MATERIALS AND METHODS
2.1 Site description
The tests were performed in the left bank of Ave River, near the city of Vila do Conde in north Portugal, where the new shipyards of “Vila do Conde” were installed. This area is very close to the river mouth, which means that it suffers from the tidal influence. The tides in this region of the Atlantic coast are very wide frequently achieving 4 m of water height between the low and the high tide. Such aspect had an important effect not only for the tests execution but also in the water table evaluation.
On another hand, this area was the deposition place of dredged sediments from Ave River in the past due to the current need of assuring river navigability. Therefore, the soil formation of this site was a product of the deposition of fluvial sediment and so the selection of this area. Figure 1 displays the location of the points of exploration.
Figure 1. Identification of the three test points (adapted from Google Earth).
2.2 DPL test
DPL test is a field technique based on the same principle of the SPT test. Hence its test procedure involves the falling of a hammer from a specific height. However, unlike SPT device, DPL device has a cone instead of a sampler. The test measures the effort required to drive the cone through the soil and then obtain resistance values that correspond to the soil mechanical properties. Besides, it allows visualizing the variation of penetration resistance with depth. Figure 2 presents a schematic description of DPL components.
The results of this test are represented by the number of blows to achieve 10 cm penetration (N10). The main limitation of DPL is that in
higher depths, the initial energy is dissipated along the tubing and the device does not advance. For that reason, the maximum depth of the test is 8 m and rarely reaches firm layer or bedrock. Furthermore, the test could be rejected if N10>100.
Usually, DPL results are correlated to found its equivalent values with other tests (as the CPT) and allow obtaining a better identification of the ground. Moreover, DPL results complement CPT results and provide additional information about the mechanical behaviour of the soil at different depths (Martins & Miranda, 2003). The International Organization for Standardization, in its standard procedure ISO 22476-2 (2005), presents a model to transform the DPL results into dynamic cone resistance (qd). Such model is
presented in equation 1. The results depend only on the energy of the hammer falling (specific energy) in each blow per unit area of the nozzle section. Equation 1 presents the Dutch formula, where 𝑞𝑑 represents the resistance values in Pa;
𝑚 is the mass of the hammer in kg; 𝑔 is the acceleration of gravity in N / kg; ℎ is the fall height of the mass (m); 𝐴 is the base area of the cone in m2; 𝑒 corresponds to the mean
penetration; and 𝑚′ is the total mass of rod, hammer and guide rods in kg.
𝑞𝑑 = 𝑚2
𝑚+𝑚′∙
𝑔ℎ𝑁10
𝐴𝑒 (1)
Nowadays, it is common to correlate 𝑞𝑑 with
the 𝑞𝑐, since the CPTu tests are not used in many
countries and the DPL tests are fast and economic. Nevertheless, the models obtained to correlate such results are not theoretically well-founded because the procedures are conceptually different (the DPL is dynamic and the CPT is static). The above indicates a different soil behaviour during the execution of one or another. Viana da Fonseca (1996) introduces a model to correlate the qd values with the qc
values (equation 2).
Ke = qc⁄qd (2)
Viana da Fonseca (1996) affirmed that in homogeneous soils the value of Ke= 1 and Dos Santos & Bicalho (2017) indicated such values varies from 1.3 to 2.5 in sands.
2.3 Repeated measures profiles
The repeated measures profiles (RMP) is a statistical technique, which analyses the mean variation of the values measured at the same level (Molina-Gómez, 2017). Furthermore, this technique allows estimating the variation of a response variable subjected to different treatments. Tabachnick & Fidell (2013) mention that the data set may come from a dependent variable measured several times under the same level; for example, data collected at the same depth.
RMP technique focuses mainly on the comparison of variances. Thereby, it evaluates if the mean vectors of the measured values are equal (Friendly, 2010). To establish the above approach is necessary to evaluate three null hypotheses (Davis, 2002). Those hypotheses are parallelism, flatness and coincidence. Harrar & Kong (2016) affirm that such hypotheses seek to respond the following questions: (i) whether there is the interaction effect between the measurements and within-subject factors (ii) whether there is a between-subject factor effect, and (iii) whether there is a within-subject factor effect. Figure 3 presents a graphical representation of the null hypothesis.
(a) (b) (c)
Figure 3. Null hypotheses representation (Molina-Gómez, 2017): (a) parallelism; (b) flatness; (c) coincidence.
Molina-Gómez, Moreno Anselmi, & Arévalo-Daza (2016) recompiled the theoretical background of RMP and presented procedure to analyse the data in RStudio by using the profileR package (Bulut & Desjardins, 2017). In this work such procedure was applied.
3 RESULTS
3.1 Field test
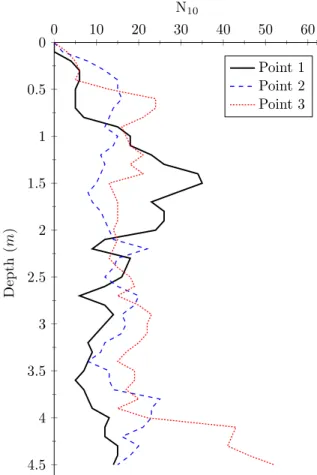
Three different DPL and CPT tests at 4.5 m depth were performed. The separation between both types of tests was of 2 m. Figure 4 presents the DPL results. These results allowed obtaining a previous identification of the soil and verifying that does not exist a layer, which could cause damages to the CPT device. Hence, the DPL tests guaranteed a preliminary inspection of the soil before of the CPT execution.
Figure 4. Number of blows for the 3 points
By other hand, CPT tests were interpreted according to the unified approach proposed by Robertson (2009). The calculation routine was the proposed by Rios, da Fonseca, Cristelo, & Pinheiro (2018) which involved the basic CPT parameters (cone resistance, qc and sleeve
friction, fs). The Robertson chart is based on the
classification of normalized soil behaviour type (SBTn) zones by means of the Ic parameter
(equation 3). Such parameter represents the
radius of concentric circles that define the boundaries of soil types.
I𝑐 = [(3.47 − log 𝑄𝑡)2+ (log 𝐹𝑟+ 0.22)2]0.5 (3)
Where Qt is the normalized cone penetration
resistance and Fr is the normalized friction ratio.
Rios et al. (2018) explains what the boundary represented by Ic = 32 represents the lower
boundary for most sand like ideal soil and is like SBTn zones 4 and 5 for normally consolidated soils. The boundary I (Ic = 22) represents the upper boundary for most claylike ideal soils and is like the original boundary between SBTn zones 3 and 4 for normally consolidated soils. The region represented by 22 < Ic < 32 is defined as “transitional soil” to represent soils that can have a behaviour somewhere between that of either sandlike or claylike ideal soil. For these soils, an expected partial drained behaviour may be expected during a CPT test, and so these soils are also called as intermediate soils. Figure 5 presents the SBTn results.
(b)
(c)
Figure 5. Soil classification based on SBTn: (a) point 1; (b) point 2; (c) point 3.
Figure 5 shows the presence of transitional soils between 1.8 and 4.2 m depth at all points. Intermediate materials are the silty soils and the mixtures of sand and clay. The geotechnical behaviour of sands and clays is already well understood by different constitutive models. However, intermediate soils have different tendencies. The behaviour in this type of materials can be transitional between sands and clays or can exhibit unique behaviour, which differs from both granular and fine soils. Hence, the intermediate soils may exhibit, simultaneously, properties of sand and clay. In addition, the correlations between DPL and CPT do not present an acceptable fitting for particular kind of soil.
In addition, it was recuperated a soil sample from point 2 at 4 m depth. This sample was taken to the laboratory in order to obtain its physical characteristics (Table 1) and grain size distribution (Figure 6). Results validated that the material at such depth is an intermediate soil, due to according to the USCS is classified as Silty Sand (SM).
Table 1. Geotechnical properties of the intermediate soil. Geotechnical Property Value Unit
Specific gravity 2.66 - Plastic limit NP % Liquid limit NP % D60 0.40 mm D50 0.35 mm D30 0.25 mm D10 0.02 mm
Fines fraction (sieve Nº 200) 12.77 % Uniformity coefficient 16.83 -
Curvature coefficient 7.41 -
Figure 6. Grain size distribution of the intermediate soil.
4 ,7 6 0 2 ,0 0 0 0 ,8 4 1 0 ,2 5 0 0 ,1 8 0 0 ,1 0 5 0 ,0 7 4 0 10 20 30 40 50 60 70 80 90 100 0 10 20 30 40 50 60 70 80 90 100 0,001 0,01 0,1 1 10 % r e ta in e d % p a s s e d Grain size (mm)
ASTM Sieves series (mm)
CLAY SILT SAND GRAVEL
3.2 Statistical Analyses
Figure 7 shows the profiles of the cone resistance (CR) between both field tests. Profiles data were obtained from the computation of equation 1 (qd)
and direct records of CPT (qc). Profiles displayed
a good tendency of the correlation is fitted with the real values along the depth in all points.
(a) (b) (c)
Figure 7. RMP of cone resistances: (a) point 1; (b) point 2; (c) point 3.
Table 2 presents the analysis of RMP results by the evaluation of the three null hypotheses of such statistical technique. It was established if the profiles of cone resistance are parallel, flatness or coincident under a significance level of 95% (=0.05) according to the values obtained from profileR results. The value of was selected according to established in the experiments design literature by Kuehl (2000) and Ramachandran & Tsokos (2009). The analysis results were based on the p-value criterion.
In Table 2 it was evidenced that the p-values are less than the value selected. Therefore, it exist statistical evidence to reject all null hypotheses (Habiger, 2015; Wackerly, Mendenhall, & Scheaffer, 2008) and validate that the profiles in all tests points are parallel, flatness and coincident.
Table 2. Analysis of RMP results.
Point H0 p-value 1 Parallelism 7.03e-21 Flatness 2.02e-16 Coincidence 1.46e-24 2 Parallelism 4.05e-18 Flatness 8.99e-4 Coincidence 8.71e-28 3 Parallelism 1.55e-20 Flatness 2.12e-16 Coincidence 6.86e-27
Due to the null hypotheses were non-rejected and the profiles of both tests are not transposed, it was evaluated the correspondence between the
qd and qc values. Such evaluation was made
through the linear regression method with an intercept equal to zero as suggest Dos Santos & Bicalho (2017).
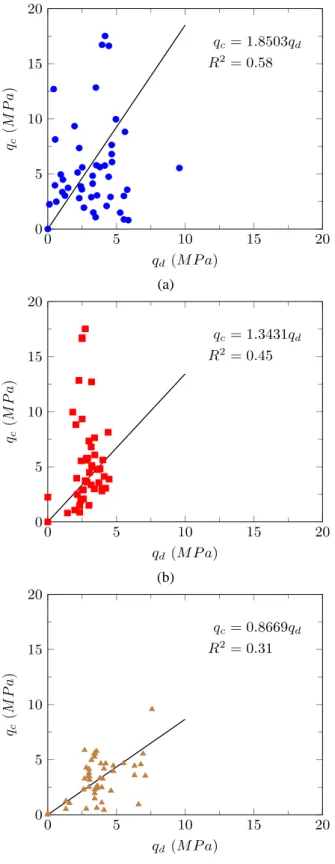
This analysis allowed the calculation of the Ke
value presented in equation 2. Figure 8 shows the regression results. Results presented coefficients of correlation lower than 0.60, which indicates that the linear models do not represent, acceptably, the correlation DPL and CPT in all points. Moreover, the parameters of the linear models showed that points 1 and 2 have Ke
values within the range presented by Dos Santos & Bicalho (2017). However, for point 3 such value is not included in the [1.3-2.5] range, conversely to points 1 and 2 since these points have fewer layers of silty sand and sandy silt. Nevertheless, in point 3 small differences were observed between qd and qc profiles as observed
(a)
(b)
(c)
Figure 8. Linear regression results: (a) point 1; (b) point 2; (c) point 3.
On the other hand, it was assessed the descriptive statistics in order to identify the range of Ke values in this type of soil. Table 3
summarizes the descriptive statistics and Figure 8 displays the box plots with these parameters. Results did not indicate significant differences between mean and median values. In addition, six outliers (four in point 1, one in point 2 and one in point 3) were observed. Such outliers are in the zone of intermediate soils (at 2-4 m depth), except the value at 0.1 m in point 1, which is
Ke=0 at the start of the tests. Box plots indicates
differences between Ke values obtained from clean sand and intermediate soils.
Table 3. Descriptive statistics.
Point Descriptive Value
1 Mean 1.97 Median 1.97 Standard deviation 1.05 2 Mean 0.96 Median 0.86 Standard deviation 0.69 3 Mean 0.87 Median 0.83 Standard deviation 0.50
Figure 9. Box plots of Ke results.
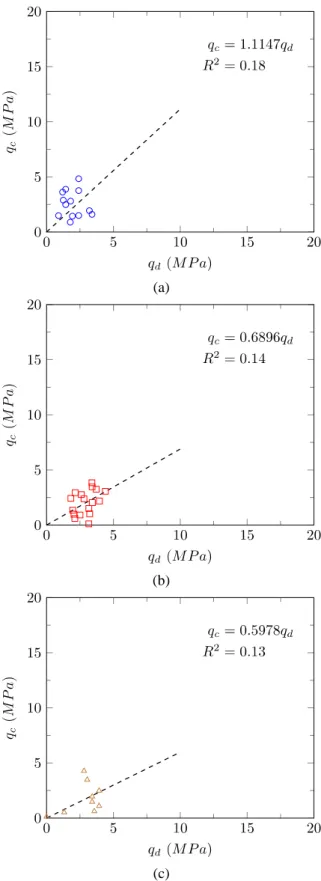
Due to the differences of Ke values obtained
in regression models, such value was calculated again only for the transitional layers. Figure 9 shows the results of the new analysis. It was found different values of Ke, which indicated that
the range presented by Dos Santos & Bicalho (2017) is not appropriate for transitional soils. In addition, the coefficients of correlation were lower than 0.20 and lower than in the first regression calculation. Correlation results verified that there is no linear correspondence
between qd and qc values for intermediate soils.
In this way, it confirmed that the linear model is not accurate to correlate DPL with CPT in this type of material.
(a)
(b)
(c)
Figure 9. Linear regression results in intermediate soil layers: (a) point 1; (b) point 2; (c) point 3.
4 CONCLUSIONS
This paper addressed a statistical comparison between the results of two different field tests in intermediate soils. In this study were analysed correlations between DPL and CPT tests. Practical and academic conclusions are the following:
• It was identified an intermediate soil product of fluvial sediments. Based on the soil classification based on SBTn (Robertson, 2009), the soil presented dilative transitional behaviour of silty sand to silty clay. Such materials can have characteristics typical of granular and fine grained soils at the same time. In addition, the correlation analysis revealed that correlation values between both tests are not within the typical values reported in the literature for granular materials.
• A graphical statistical approach for the two different types of field tests, DPL and CPT, was implemented. The analysis of RMP allowed estimating parallelism, flatness and coincidence level between test records. It was found the symmetry, stability and coincidence of the profiles under a confidence level of 95%. Therefore, the qd
and qc profiles in all points are parallels,
flatness and equally from a statistical point of view. It was found that the DPL is a good preliminary soil recognition method before performing the CPTu, even though there are differences between the execution of both tests.
• The records between DPL and CPT tests were compared. Results showed that for intermediate soils the correlation between qd
and qc is not described by linear models. In
the layers of clean sands, the Ke values are
acceptable, whereas in the transitional soil layers the Ke values are more disperse than
the values for sands. In addition, the coefficients of correlation were not suitable to establish a correlation between qd and qc
results obtained from DPL and CPT tests. Hence, it is necessary to propose new alternative models to estimate the results of such among tests, which involve the particular characteristics of the intermediate soils.
ACKNOWLEDGMENTS
This work was financially supported by Project POCI-01-0145-FEDER-007457 – CONSTRUCT – Institute of R&D in Structures and Construction, funded by FEDER funds through COMPETE2020 – Programa Operacional Competitividade e Internacionalização (POCI) – and by national funds from the FCT - Fundação para a Ciência e a Tecnologia through SFRH/BPD/85863/2012 scholarship and PTDC/ECM/GEO/1780/2014 project. It was also funded by CNPQ (the Brazilian council for scientific and technological development) for its financial support in 201465/2015-9 scholarship of the “Science without borders” program.
REFERENCES
Davis, C. S. (2002). Statistical methods for the analysis of
repeated measurements (2nd ed.). New York:
Springer.
dos Santos, M. D., & Bicalho, K. V. (2017). Proposals of SPT-CPT and DPL-CPT correlations for sandy soils in Brazil. Journal of Rock Mechanics and
Geotechnical Engineering, 9(6), 1152–1158. https://doi.org/10.1016/J.JRMGE.2017.08.001 Edil, T. B., & Benson, C. H. (2005). Investigation of the
DCP and SSG as Alternative Methods to Determine Subgrade Stability. Madison. Retrieved from
http://wisconsindot.gov/documents2/research/01-05final1.pdf
Friendly, M. (2010). HE Plots for Repeated Measures Designs. Journal of Statistical Software, 37(4), 1– 40. https://doi.org/10.18637/jss.v037.i04
Habiger, J. D. (2015). Multiple test functions and adjusted p-values for test statistics with discrete distributions.
Journal of Statistical Planning and Inference, 167,
1–13. https://doi.org/10.1016/j.jspi.2015.06.003 Hamid, A. M. (2015). The dynamic cone penetration test:
a review of its correlations and applications. In
International Conference on Advances in Civil and Environmental Engineering (pp. 1–16). Kuala
Lumpur: Faculty of Civil Engineering, Universiti Teknologi MARA Pulau Pinang.
Harrar, S. W., & Kong, X. (2016). High-dimensional multivariate repeated measures analysis with unequal covariance matrices. Journal of Multivariate Analysis, 145, 1–21. https://doi.org/10.1016/j.jmva.2015.11.012
ISO, I. O. for S. ISO 22476-2:2005 - Geotechnical investigation and testing - Field testing - Part 2:
Dynamic probing (2005).
Kuehl, R. (2000). Design of experiments: statistical
principles of research design and analysis (2nd ed.).
Duxbury/Thomson Learning.
Lingwanda, M. I., Larsson, S., & Nyaoro, D. L. (2015). Correlations of SPT, CPT and DPL Data for Sandy Soil in Tanzania. Geotechnical and Geological
Engineering, 33(5), 1221–1233. https://doi.org/10.1007/s10706-015-9897-1
Martins, J. B.; Miranda, T. (2003). “Ensaios de Penetração nos Solos Graníticos da Região Norte de Portugal. Algumas Correlações.” Revista de Engenharia Civil, Universidade do Minho. n.º 17, pp. 5 a 18.
Molina-Gómez, F. A. (2017). Análisis de perfiles de
medidas repetidas en la evaluación de la granulometría de bases granulares. Fundación
Universitaria Los Libertadores.
https://doi.org/10.13140/RG.2.2.24413.31206 Molina-Gómez, F. A., Moreno Anselmi, L. Á., &
Arévalo-Daza, C. E. (2016). Aplicación del análisis de perfiles de medidas repetidas en exploraciones geotécnicas. In XV CONGRESO COLOMBIANO
DE GEOTECNIA (p. 7). Cartagena.
Ramachandran, K. M., & Tsokos, C. P. (2009).
Mathematical statistics with applications.
Elsevier/Academic Press.
Rios, S., da Fonseca, A. V., Cristelo, N., & Pinheiro, C. (2018). Geotechnical Properties of Sediments by In Situ Tests. In W. Frikha, S. Varaksin, & A. Viana da Fonseca (Eds.), GeoMEast 2017. Sustainable Civil
Infrastructures (pp. 59–68). Cairo: Springer, Cham.
https://doi.org/10.1007/978-3-319-61902-6_6 Robertson, P. K. (2009). Interpretation of cone penetration
tests - a unified approach. Canadian Geotechnical
Journal, 46(11), 1337–1355.
Ruge, J. C., Mendoza, C. C., Colmenares, J. E., Cunha, R. P., & Otalvaro, I. F. (2018). Analysis of the undrained shear strength through the standard penetration test with torque (SPT-T). International
Journal of GEOMATE, 14(41), 102–110. https://doi.org/10.21660/2018.41.81190
Tabachnick, B. G., & Fidell, L. S. (2013). Using
multivariate statistics (6th ed.). Prentice Hall.
Viana da Fonseca, A. (1996). Geomecânica dos solos
residuais do granito do Porto: criterios para dimensionamento de fundações directas.
Universidade do Porto. Retrieved from https://repositorio-aberto.up.pt/handle/10216/11101 Wackerly, D. D., Mendenhall, W., & Scheaffer, R. L. (2008). Mathematical statistics with applications. Thomson Brooks/Cole.