Master’s Thesis
Mergers and Acquisitions:
A Case Study on Liberty Global Inc. and Virgin Media Inc.
Author: Elsa N. Shichilenge Hand-in date: 16th of September, 2013.
Supervisor: Peter Tsvetkov
Program: Master of Science in Economics Major in Finance
This thesis is a part of the MSc program at Universidade Católica Portuguesa. The school takes no responsibility for the methods used, results found and conclusions
The reasonable man adapts himself to the world; the
unreasonable one persists in trying to adapt the world to himself.
Therefore, all progress depends on the unreasonable man.
M&A: A Case Study on Liberty Global Inc. and Virgin Media Inc. | Elsa Nabenge i
Acknowledgements
The most exciting part of my program was having the opportunity to apply knowledge gained thus far, to a real-life deal. The experience has been more than pleasant with many lessons learnt along the way, making the many hours of hard work with school pressure at hand, worthwhile. This said, this work could not have come to a close without the support, advice and guidance given by a number of individuals. First and foremost, I would like to extend my utmost gratitude to Peter Tsvetkov for his availability to mentor, review and provide feedback and recommendations to improve this work.
In addition, I would love to express great appreciation to Professor Teresa Lloyd-Braga and Priscillia Mão-Cheiafor their persistent support during the whole of my program at CLSBE, my mentor João Pedro Paul, not forgetting classmates as well as colleagues met during internship for being co-operative and supportive.
Last but not least, my heartfelt gratitude goes to my beloved family and friends for all their support, their faith in me and mostly, their enthusiasm towards this thesis. Lisbon, September 2013.
M&A: A Case Study on Liberty Global Inc. and Virgin Media Inc. | Elsa Nabenge ii
Abstract
M&A deals have increased with time as a result of ease of access to information, market liberalization and globalization as a whole. On a broader note, Cross-border M&A may also be seen as a current trend, one which is still to expand in the next few years. The benefits of Cross-border M&A extend to the economy in which the acquiring firm expands to and this can therefore be seen as a form of Foreign Direct Investment.
The liberalization of markets overall makes them integrated to some extent therefore imposing more pressure on the competitiveness of each firm. The Technology, Media & Telecommunications industry is one of the most competitive industries with rapid changes in technology which if not quickly adopted may cost firms in the industry their value and existence on the market. This work studies a real-life deal that occurred this year, 2013 between Liberty Global Inc. and Virgin Media Inc. The acquirer Liberty Global Inc. like many firms, had the motive of expansion to its existing empire which is mainly across Europe.
This work assesses the worthiness of implementing the deal and prospects after the deal is made. After thorough assessment, it is then discovered that the deal and 24% premium paid are worthy as the target firm proves to be currently undervalued with great potential in the next five years. Cost synergies given the efficiency of operations mainly by the target firm are also a possibility. However, it is worth noting that all the discovered benefits are only to be realized provided that the merged firm is managed efficiently with great caution of the risks at hand.
M&A: A Case Study on Liberty Global Inc. and Virgin Media Inc. | Elsa Nabenge iii Table of Contents 1. Introduction ... 1 2. Literature Review ... 2 2.1. An insight on M&A ... 4 2.1.1. Motives of M&A ... 4
2.1.2. The due-diligence process ... 5
2.2. Valuation Techniques ... 6
2.2.1. The Discounted Cash Flow (DCF) Model ... 6
2.2.2. The Cost of Capital and risk parameters ... 8
2.2.3. WACC-based DCF vs. Adjusted Present Value (APV) ... 13
2.3. M&A, CBMA Consideration and the price they pay ... 17
3. Firm and Industry Review ... 20
3.1. Liberty Global Inc. (LGI), (Ticker: LBTY) ... 20
3.1.1. Financials ... 21
3.1.2. Stock Market Performance ... 26
3.1.3. Industry Review in Countries/Regions of Operation ... 26
3.2. Virgin Media Inc., (ticker VMED) ... 29
3.2.1. Financials ... 30
3.2.2. Stock Market Performance ... 33
3.2.3. Industry Review in Countries/Regions of Operation ... 33
3.3. Conclusion and justification of proposed merger ... 34
4. Performance Forecast ... 35
4.1. Liberty Global Inc. Performance Forecast ... 36
4.1.1. Financial Leverage and cost of capital... 42
4.1.2. Valuation Results ... 44
4.1.3. Sensitivity Analysis ... 45
4.2. Virgin Media Inc. Performance Forecast ... 46
4.2.1. Financial leverage and cost of capital ... 50
4.2.2. Valuation Results ... 50
4.2.3. Sensitivity Analysis ... 52
4.3 Decision Based on Standalone Valuations ... 53
5. Valuation of the Merged Firm ... 54
5.1 Valuation without Synergy ... 54
M&A: A Case Study on Liberty Global Inc. and Virgin Media Inc. | Elsa Nabenge iv
5.2.1 Potential Synergies ... 56
5.2.2 Operational Synergy ... 58
5.2.3 Financial synergy ... 61
5.3 Integration and Restructuring Costs ... 63
6. The Merger ... 67
6.2. Closing the deal ... 71
6.3 Justifying the Premium ... 71
6.3.1 The Synergy-Premium Model ... 73
6.3.2 What does all this mean for shareholders? ... 74
6.4 The merger financing ‘after shock’ ... 76
7. Conclusion ... 77
8. APPENDICES ... 78
M&A: A Case Study on Liberty Global Inc. and Virgin Media Inc. | Elsa Nabenge v
List of Appendices
Appendix A: Liberty Global Inc. Brands and Regions/Countries of Operation ... 78
Appendix B: Liberty Global Average Revenue Share of Segments, RGU by product, RGU Additions and Bundling Opportunity (2012) ... 79
Appendix C: Liberty Global Inc. SWOT Analysis... 80
Appendix D: Virgin Media Churn Rates Per Bundle ... 81
Appendix E: Virgin Media Inc. SWOT Analysis ... 82
Appendix F: LGI Forward Looking Statements ... 83
Appendix G: Virgin Media’s Safe Harbor Statement ... 85
Appendix H: Liberty Global Inc. and Virgin Media Inc. Peers ... 86
Appendix I: Industry Unlevered Beta Estimation with a broader selection of Peers ... 87
Appendix J: Liberty Global Inc. Income Statement (in $million) ... 88
Appendix K: Liberty Global Inc. Balance Sheet (in $million) ... 90
Appendix L: Liberty Global Inc Cash Flow Maps (in $million) ... 91
Appendix M: Virgin Media Inc. Income Statement (in £ million) ... 92
Appendix N: Virgin Media Inc. Balance Sheet (in £ million) ... 94
Appendix O: Virgin Media Inc. Cash Flow Maps (in £ million) ... 95
Appendix P: Potential Synergies in Continental Europe ... 96
Appendix Q: Valuation of the Merged Firm Summary 1 (values in $million) ... 97
Appendix R: Valuation of the Merged Firm Summary 2 (Values in $million) ... 98
Appendix S: Valuation of the Merged Firm with Synergies Summary (Values in $million) ... 99
M&A: A Case Study on Liberty Global Inc. and Virgin Media Inc. | Elsa Nabenge vi
List of Tables
Table 1. Liberty Global Historical Net Income and Projections (2013-2017) ... 41
Table 2. Estimation of LGI’s Valuation Parameters ... 43
Table 3. Sensitivity to Terminal Growth-LGI ... 46
Table 4. Sensitivity to Interest Rates-LGI ... 46
Table 5. Virgin Media’s Projected Net Income ... 50
Table 6. Exchange Rate Forecast ... 51
Table 7. Sensitivity to Terminal Growth- VMED ... 52
Table 8. Merged Firm Costs of Capital and parameters... 55
Table 9. Computation of cost of capital ... 62
Table 10. Synergy Estimates and Composition in Millions ... 64
Table 11. Net Synergy Distribution ... 66
M&A: A Case Study on Liberty Global Inc. and Virgin Media Inc. | Elsa Nabenge vii
List of Figures
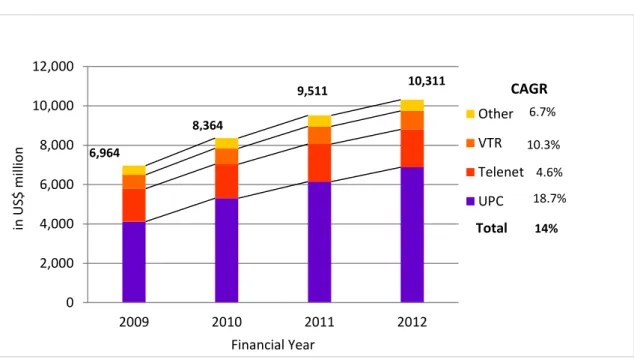
Figure 1. LGI Revenue: Segment Information ... 22
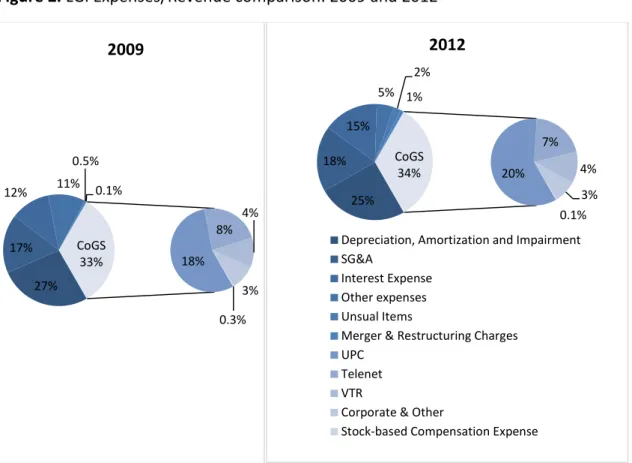
Figure 2. LGI Expenses/Revenue comparison: 2009 and 2012 ... 24
Figure 3. LGI Consolidated Financial Performance ... 24
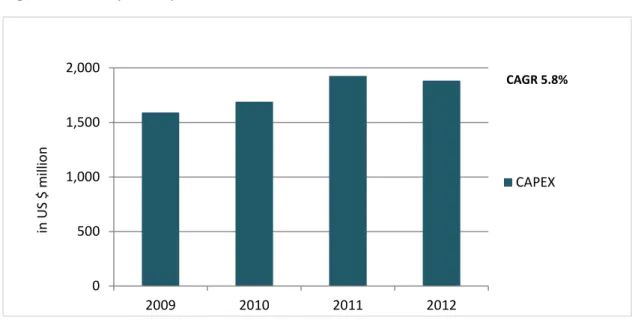
Figure 4. LGI Capital Expenditure ... 25
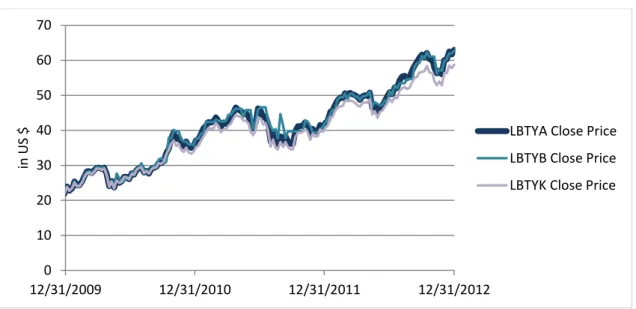
Figure 5. LGI Close Price Evolution ... 26
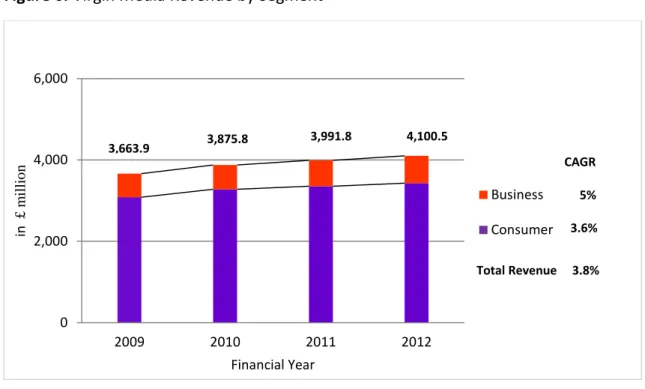
Figure 6. Virgin Media Revenue by Segment ... 30
Figure 7. Virgin Media Expenses/Revenue Comparison: 2009 and 2012 ... 31
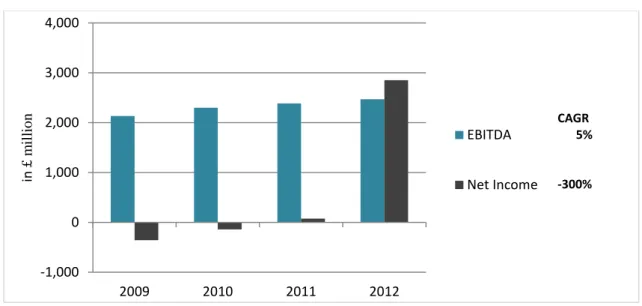
Figure 8. Virgin Media’s Financial Performance... 32
Figure 9. Virgin Media’s CAPEX ... 32
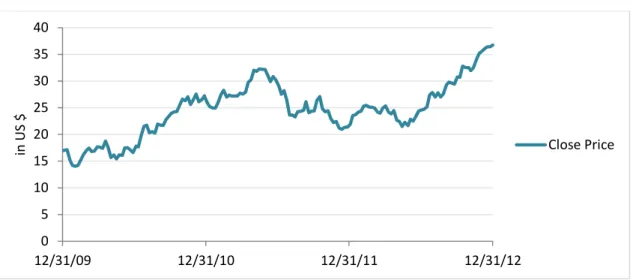
Figure 10. VMED Stock Close Price Evolution ... 33
Figure 11. LGI Segment yoy and Percentage Share of Revenue ... 38
Figure 12. VMED Sector yoy and Percentage Share of Revenue ... 48
Figure 13. Cable operators by customer base (in millions, as at 31st Dec, 2012). ... 57
Figure 14. Capex/Revenue (Combined firm) ... 60
Figure 15. CaPEx /Revenue (Combined firm Synergy) ... 61
Figure 16. Synergy Breakdown ... 65
Figure 17. The Synergy-Premium model ... 74
Figure 18. NPV to LGI shareholders in millions ... 75
M&A: A Case Study on Liberty Global Inc. and Virgin Media Inc. | Elsa Nabenge viii
List of Abbreviations
%SynC Percentage Cost Synergy
%SynR Percentage Revenue Synergy
Probability of default APV Adjusted Present Value
ARPU Average Revenue Per User
CAGR Compound Annual Growth Rate
CAPEX/CapEx Capital Expenditure
CBMA Cross Border Mergers and Acquisitions
CFD Cost of Financial Distress
CoGS Cost of Goods Sold
DCF Discounted Cash Flows
EBIT Earnings Before Interest and Tax
EBITDA Earnings Before Interest, Tax, Depreciation and Amortization
ERP Equity Risk Premium
FCF Free Cash Flows
FDI Foreign Direct Investment
FV Future Value
IT Information and Technology
LGI Liberty Global Inc.
LLU Local Loop Unbundling
M&A Mergers and Acquisitions
MVNO Mobile Virtual Network Operator
PV Present Value
RGU Revenue Generating Unit
M&A: A Case Study on Liberty Global Inc. and Virgin Media Inc. | Elsa Nabenge ix SVAR Shareholder Value at Risk
TMT Technology, Media and Telecommunications
VMED Virgin Media Inc.
WACC Weighted Average Cost of Capital
M&A: A Case Study on Liberty Global Inc. and Virgin Media Inc. | Elsa Nabenge 1
1. Introduction
Over the past two decades, there has been a rapid volume increase in Mergers and Acquisitions (M&A) activity as a result of deregulation, corporate integration and globalization. Cross-border M&A (CBMA) have since become a norm, with industries seizing investment opportunities and expanding operations on a global scale. This paper will define Cross-border M&A as that which occurs between firms with operations and headquarters in different countries and will study the case of a recently announced merger between Liberty Global Inc. and Virgin Media Inc. of which, both are prestigious and well governed firms in the telecommunications and television industry in their respective countries- the U.S and U.K. The prime objective is to analyze the impact of Cross-border M&A activity on both parties by valuation in order to realize any benefits and/or openings of any sort. The expansion of Liberty Global Inc. which will be further discussed is another essential to the study in order to see the effect of the newly added firm on the shareholders of its many others within and outside the US.
This paper will firstly discuss the different academic views, arguments, advances and contributions to the study of M&A activity, the valuation and its many influences and outcomes, with its main focus being in specific relation to Cross-border M&A. The methodology will then be based on these past arguments raised in the theoretical framework, of which valuation techniques are efficient, given the characteristics of the transaction at hand.
The second part of the paper will explore each of the firms and industry in detail including their corporate culture, performance and capital structure policy. The essence of this exploration is to use a well-tailored valuation procedure so as to obtain precision and a clearer understanding of what impacts the transaction will have on either or both firms.
Thereafter, individual valuation of both firms will be implemented with forecasts incorporating any firm-specific data in order to have a precise view of both firms’
M&A: A Case Study on Liberty Global Inc. and Virgin Media Inc. | Elsa Nabenge 2
capacities. Lastly, the impact of the merger between the two firms will be analyzed by bringing together, the findings from separate valuation as well as assessing the worthiness of the merger consideration.
2. Literature Review
Cross-border M&A similar to domestic M&A, are driven mainly by the need for expansion and profitability strategies. Moeller and Schlingemann (2005) provide clearer distinctions between border and domestic transactions in that cross-border M&A usually involve large acquirers, higher free cash flow, public targets, relative deal size, cash payments, tender offers and hostile takeovers. Mantecon (2009) finds that in terms of volume, cross-border M&A have increased to nearly three times as much as that of domestic M&A. Although the year 2011 had a plunge in M&A activity due to an economic downturn, the Grant Thornton International Business Report (2012) after a survey of 12,000 businesses in 40 economies established that 34% continue to stand significantly interested in the activity compared to 2010 which only represented 26% of businesses globally.
Branching from early schools of thought on International Production, using an eclectic approach (Dunning, 1980), striking growth opportunities abroad induce participation in international investments, provided the right incentives. The company then markets its ownership-specific qualities such as organizational, technological or financial, among others, to foreign firms which are used to its advantage as entry modes (Pan and Tse, 2000). Recent studies in addition, also reveal that firms with high stock prices are more acquisitive both for the reason of growth and an extension to easier liquidity access (Mago, Marks, Matthews and Zenner, 2008); not forgetting the importance of technological innovation as the core of many strategies (Kim, Suh and You, 2013).
Participation in CBMA can however, be more challenging than domestic M&A as usually, international market forces or drivers may be unknown. The acquiring firms may face a legal system that supports property rights different from that of its home which may be a threat to future cash flows (Rossi and Volpin, 2004); this type of uncertainty also known as ‘’liability of foreignness’’ (Zaheer, 1995). Additionally, more
M&A: A Case Study on Liberty Global Inc. and Virgin Media Inc. | Elsa Nabenge 3
disclosure of information or unfamiliar accounting practices may be encountered during the due diligence process (Mantecon, 2009). Past academic research dated back to the 70s, studied CBMA in an economic framework as a form of Foreign Direct Investment (FDI) with examples of Dunning (1993) and Williamson (1975). Put this way, Froot and Stein (1991) establish that with information asymmetry, there is a significant correlation between FDI and foreign exchange rates. On the other hand, Hitt, Shimizu, Vaidyanath and Vincenzo (2004) dispute the economic framework stating its limited insight for M&A implementation processes and therefore argue that there’s need for additional insights as well as wide-ranging emphases.
Akin to other transactions, M&A players incur costs during the process such as contracting, auditing and legal advice fees. However, CBMA have higher information asymmetry leading to costs higher than would be in a domestic transaction (Luo, Suh and Zhao, 2004). Many academics argue on whether on average, CBMA yield positive or negative returns regarding expectations of corporate managers and analysts. The first argument of information asymmetry and resulting costs has been recently tackled by Ragazzino, Reur and Shenker (2004) who suggest that the risk may be reduced by simply changing the deal structure during the evaluation process. Unsurprisingly, Williamson (1975, 1979) on the notion of Transaction Costs Economics (TCE) which basically relates entry mode choice as a macroeconomic threat to company governance, had earlier argued in a similar manner by recommending an organizational structure designed in a way such that risks are minimized. Developing aforementioned literature on reduction in asymmetric information, Boeh (2011) studies a sample of over 3,000 M&A deals of both types- domestic and cross-border in which he incorporates contracting costs borne and time taken to execute the deals. From this assessment, it is concluded that CBMA compared to domestic are more costly yet take shorter execution time. This is probably due to the level of asymmetry involved in CBMA transactions as stated by Luo et al. (2004). It is worth noting however, that the given literature so far proposes further research on cost reduction mechanisms implemented in CBMA transactions (Boeh, 2011).
M&A: A Case Study on Liberty Global Inc. and Virgin Media Inc. | Elsa Nabenge 4
Given the main motives and the greatest risk faced in CBMAs as noted by academics, the following section which will discuss in detail M&A procedure, expectations, valuation and outcome from previous studies.
2.1. An insight on M&A
In order to understand an outcome of any transaction, one must closely analyze the whole procedure from motives, considerations of the transaction and the valuation procedure. M&A usually take the following categories: i) horizontal where competitors or same industry level firms combine; ii) vertical where firms have a buyer-seller relationship, for example, a distribution firm can merge with its main supplier; and iii) conglomerate where firms neither have an industrial nor buyer-seller relationship. The latter is often associated with diversification.
2.2. Motives of M&A
As stated earlier, the board, management and its shareholders usually feel the need to extend their knowledge base, productivity and competitiveness for returns of growth in different aspects. Gӧrg, Hijzen and Manchin (2008) using a sample of OECD countries, find that the number of mergers increases in both the market size of the acquisition and the target country; and that mergers are positively affected by the size of financial markets in both countries.
Synergy
In all transactions, the one word that management have in mind is Synergy; which is ‘’…the additional value that is generated by combining two firms, creating opportunities that would not been available to these firms operating independently.’’ (Damodaran, 2005). Damodaran (2005) further classifies this additional value into two groups: operational and financial. Operational synergy involves the value added by combination of firms in terms of cost efficiency, profitability, higher growth and market power. While, financial synergy captures tax benefits, increase in value, debt capacity and diversification. Synergies imply that the value of the merged firms after the merger announcement should be actually greater than that during consideration.
M&A: A Case Study on Liberty Global Inc. and Virgin Media Inc. | Elsa Nabenge 5
Realized synergies should however be split among the parties and in order to be done fairly the strengths brought forth by each firm are considered as the underlying measure. This therefore means the larger proportion is allocated to the firm which contributes the most in order to realize the determined synergies (Damodaran, 2005). Academics have closely studied the types of synergy, creating empirical evidence such as the likes of Berger and Ofek (1995) and Maquiera, Megginson, and Nail (1998) who find that diversification is only beneficial if the deals have related fields of business or operation. Devos, Kadapakkan and Krishnamurthy (2009) study a set of 264 large mergers and find that operational synergies are higher in focused mergers while tax savings generate a larger portion of gains in diversifying mergers.
The main evidence drawn by the authors is that gains are well derived from mergers with improvement in resource allocation. The other motives are true depending on either sides of the parties involved whether the bidder, or the target. This will be explained further after understanding the nature of the case study.
2.3. The due-diligence process
Similar to domestic M&A, CBMA have to examine their target and all its operational activities in order to have a definite background and information on the overall value and risk. Earlier work by Kish, Madura and Vasconcellos (1991) branch their findings from capital budget theory concluding that CBMA decisions are based on an asset valuation model. Recently, Erel, Liao and Weisbach (2012) established that valuation plays a major role in rousing mergers; firms that tend to be acquirers are usually those that have experienced a rise in stock market value, have currency appreciation and relatively high book-to-market values, while those with weaker economic performance tend to be targets.
However, CBMA as seen in the theoretical framework is more complex and involves more factors, hence resulting in crucial considerations. Angwin (2001) points out corporate and national cultural differences and how they can affect perception of the parties involved and the value of the deal. Corporate cultural differences include organizational routines, managerial practices and styles, communication systems; while national imply on a large scale: individual values, risk propensity, acceptance of
M&A: A Case Study on Liberty Global Inc. and Virgin Media Inc. | Elsa Nabenge 6
uncertainty, among others (Hitt et al., 2004). Influence of the aforementioned should therefore be closely considered in valuation.
2.4. Valuation Techniques
The assessment of how much an investment is actually worth is very essential in every form of transaction. In M&A, as mentioned earlier, firms are valued in order to give precise information to decision-makers on their investment. Overtime, a number of valuation techniques have developed, with improvements in some. Pandian and Woodlock (2013) point out three types of valuation; the asset method, guideline method and income method. In detail, the asset method values a firm on its net assets which is the difference between the market value of assets and liabilities. On the other hand, the guideline method uses market prices of comparable firms in order to obtain a price for the firm being valued while the income method uses estimates of a firm’s future cash flows incorporating the risk associated with them. The Discounted Cash Flow model (DCF) , established in the 70s may be seen as the core of valuation as other methods rely on it directly or indirectly to obtain the present value of assets, so as to have better insight on the deal. Of the three types of valuation, the income method is popularly used and is can be comprehended as a development of the DCF model. It is therefore important to study the developments of this model and the different parameters it captures.
2.5. The Discounted Cash Flow (DCF) Model
Traditional valuation theory defines valuation as a function of three prime factors, which are cash, timing and risk. The DCF approach implies that the value of a business is the sum of its expected future free cash flows, discounted at an appropriate rate that reflects the cost of capital. Luehrman (1997a) shows how the model is built from a simple relationship between the present and future values branching from the following basic financial concept:
; Which then yields the relationship:
M&A: A Case Study on Liberty Global Inc. and Virgin Media Inc. | Elsa Nabenge 7
Where; FV is the Future value, PV is the present value and r is the interest rate.
When applying the fundamental relationship to a business, the present value equals the sum of the future cash flows adjusted for timing and risk:
∑
Where; in this case corresponds to which are expected cash flows or future
cash flows and k is a discount rate which incorporates a risk premium.
The expected future cash flows are discounted at a rate with a risk premium because the cash flow pattern is uncertain and to compensate for the risk, investors demand a higher return. The DCF model requires short and long-term cash flow projection (usually 4 to 10 years) in order to execute valuation of the firm. The cash flows include new investments, revenues and expenses. To be more precise, Free Cash Flows to the firm (FCF or FCFF) are used which are earnings after tax, including depreciation net of capital expenditure and working capital. The estimates of short and long-term growth and return on invested capital should be essential to the FCFs being projected as a firm is expected to grow over time or renovate via occurring reinvestments. In addition to that, forecasted FCFs should be made considering any changes such as synergies, economies of scale, expected overhead reductions and changes in strategy.
Projection of FCFs cannot be made on a large time scale which thus explains why it is usually between four to ten years. A terminal value is therefore required to denote the present value after the forecast period of all FCFs generated by a firm. This can be written as:
Where; is the terminal value and g being the growth rate; the terminal value
can be obtained by estimating the future value of the last projected FCF at time T, , using the expected growth rate after the forecast period i.e.
M&A: A Case Study on Liberty Global Inc. and Virgin Media Inc. | Elsa Nabenge 8
Note: assuming that, , the growth rate after the forecast period, is perpetual.
2.6. The Cost of Capital and risk parameters
The DCF model although widely used has academic dispute concerning what discount rate to use. From this arise two different DCF valuation methods which are the Weighted Average Cost of Capital (WACC)-based DCF and Adjusted Present Value (APV) which uses the unlevered cost of equity and the cost of financing separately. WACC is a tax-adjusted discount rate that is meant to capture the value of tax benefits that are gained from debt financing, subsequently reducing the discount rate (Luehrman, 1997a). It is denoted as follows:
Where; is the equity-firm value ratio, the debt-firm value ratio, the cost of equity, the cost of debt and is the marginal corporate tax rate.
The opportunity costs, and , are each comprised of a risk premium and time value. The time value is the return one earns for not bearing any risk over time. This implies that they are both risk adjusted. It is important to note that the costs should be current, reflecting current financial market conditions and not sunk or historical costs. In addition to that, they should equal investors’ expected internal rates of return on future cash flows respective of each form of capital and weights should be based on market-value mixes of debt and equity (Bruner, Eades, Harris, and Higgins, 1998).
The cost of debt, , the rate at which funding was borrowed can be decomposed
simply yielding the sum of the current risk-free rate and a default spread. Where the default spread is obtained from the corresponding credit rating set. In a case where bonds have different ratings, the median rating may be used (Damodaran, 2013).
The cost of equity is denoted as follows when using the Capital Asset Pricing Model
(CAPM):
M&A: A Case Study on Liberty Global Inc. and Virgin Media Inc. | Elsa Nabenge 9
Where; is the risk-free rate, the equity beta which is the sensitivity of the firm’s equity to market patterns and is the equity risk premium- the difference between the expected return and the risk-free rate. The risk-free rates are obtained from Government securities. An investment is risk-free if it neither has default risk nor reinvestment risk (Damodaran, 2013) or as stated by CAPM, if it has a zero . It further implies that an expected return with a of one is equal to the market return. The beta is estimated by regressing returns against market returns while historical risk premiums are used. Collectively, the CAPM can be defined as a linear model used to assess the cost of capital centered around the expected return on its assets, incorporating the firm’s risk in relation to that of the market and it’s underlying assumption being that investors hold a well-diversified portfolio.
The CAPM, developed by Sharpe (1964) and Lintner (1965) still stands, for almost half a century, as the most common method in cost of capital estimation and portfolio performance evaluation. Conversely, academia have overtime, developed faults in the use of the model. Faults include; imperfect measures of the market portfolio, non-normality of returns, deviating borrowing and lending rates, tax effects and the lack of existence of a pure riskless asset. Of all arguments, one still stands- Roll (1977) disputes the possibility of observing the Market Portfolio and concludes that it’s thus impossible to test the validity of the CAPM, and opts for the Arbitrage Pricing Theory (APT) established by Ross (1976) which allows additional factors; mostly macroeconomic with factor specific betas for a fair estimation of discount rates. Dayala (2012) finds Roll’s critique significant in that CAPM still reflects invalidity and suggests further investigation. However, Roll’s critique can also be used as a guideline to determine whether the portfolio market is Mean-Variance Efficient (MVE) depending on whether CAPM tests hold or not.
Basu (1977) additionally points out strong evidence that the beta misses variation in expected return captured by other variables. Scholars of behavioural finance question the assumptions of homogeneity in investor rationality and market efficiency in the face of future uncertainty (Miller, 1977; Kahneman and Tversky 1979; Daniel, Hirshleifer and Subrahmanyam, 1997). Fama and French have in their work (1992,
M&A: A Case Study on Liberty Global Inc. and Virgin Media Inc. | Elsa Nabenge 10
modified the model according to the average-return anomalies missed by it. The model is a three-factor model of which, excess market return is one of the added factors. The inclusion proves its importance and is crucial as it captures robust common time-series variation in returns. They further advise using the CAPM as an introduction to Portfolio Theory because of its simplicity and from there, more complex and extensive models may be used such as the Intertemporal Capital Asset Pricing Model (ICAPM) by Merton (1973) which incorporates more variability factors such as state variables and wealth and can provide a better description of average returns. Nevertheless, it is important to note that the perceived limitations of the CAPM are mostly a result of the way in which the model is applied; mainly in estimating the risk premium and the beta (Pettit, 1999). Despite the many disputes of the model, CAPM is still fundamental in understanding Performance Evaluation and Portfolio Management, can be used as a benchmark and is also a foundation of the alternative models that have been established overtime.
Risk-free rate and the Equity Risk Premium (ERP)
ERP implies that the expected return on a portfolio exceeds the risk-free rate. Finance theory states intuitively the relationship between investment returns and risk- the riskier the investment, the higher return expected or demanded by investors (Damodaran, 2012). The choice of the risk-free rate to be used is essential as it determines the size of the ERP included in the cost of equity (Pandian and Woodlock, 2012). Bruner et al (1998) after a survey of leading corporations and financial advisors in the US, recommend that the risk-free should be well-tailored with the cash flows being valued and conclude that for most corporate acquisitions and projects, the yield on the US government bond with maturity of at least ten years would be appropriate. However, the use of current yields on US Treasuries as a proxy measure of risk-free rates of return has been highly doubted after the Standard & Poor’s (S&P) recent debt downgrade. Booth (1999) measured total bond risk using standard deviation of returns over 20 years and from this discovered that over time, there has been a significant increase and at times has almost equaled that of equity. The demand for the use of the US Treasuries still stands relatively high thus suggesting it being a haven or ‘’risk-free’’ if so, although longer-term average yields should be used until the current unrest
M&A: A Case Study on Liberty Global Inc. and Virgin Media Inc. | Elsa Nabenge 11
stabilizes (Pandian and Woodlock, 2012). Failure to adjust risk-free rates may result in overvaluation when measured from historical norms. In order to obtain a risk-free rate for CBMA valuation, forward rates and the riskless rate are used in an index currency to estimate the riskless rate in the local currency, taking into account the inflation rate as the analysis should be in real terms.
The standard approach for ERP estimation is by use of historical data where actual returns earned on equity over a period of time are obtained as well as returns on a risk-free asset from which the difference between the two is computed to yield a historical risk premium (Damodaran, 2012). Damadoran questions the efficiency of this model and further suggests an alternative way which adjusts for country-specific risk. Grabowski (2009) in concurrence with Damodaran, point out that ERP is cyclical during the business cycle and therefore rename ERP as ‘conditional ERP’, implying it changing according to whether there’s a boom or recession in the cycle. Bruner et al (1998) add that the choice of an ERP is a subject of controversy concerning its value and estimation. From their survey, most of the best-practice companies were found to use a premium of 6% or lower while financial advisors and many texts were seen to use higher rates. Prospective equity risk premiums which can be derived by use of expected future, dividend yields, analyst consensus, estimates of future growth in nominal and real earnings, average payout ratios, and current stock market valuations as well as surveys (as seen by Bruner et al, 1998) can be used as an alternative (Pandian and Woodlock, 2012).
Applying this to CBMA valuation with the risks faced, it should be taken into account that historical premiums vary across economic cycles and the difference between estimation techniques of ERP will yield different results. If the risks in question are non-diversifiable and not captured by the beta used in the cross-border project, then a risk premium should be incorporated in the discount rate. For practicality’s sake, it is safer to adjust the discount rate by adding a premium in order to reduce any distortions of the true value of the project (Froot and Kester, 1995).
Beta Estimation
Beta measures the relative movement of the business’ excess returns on equity with that of the market. The market returns are normally measured using indices such as
M&A: A Case Study on Liberty Global Inc. and Virgin Media Inc. | Elsa Nabenge 12
S&P 500, NASDAQ, FTSE, CAC40 etc., respective of where equity is being invested and listed. The standard procedure for beta estimation involves regression of stock returns on market returns. However, this is usually associated with a high standard error, the firm’s business mix that’s reflected is not the current one but that of the period of the regression and the average leverage shown is not the current one but, as with the business mix, is over the period of regression (Damodaran, 2013). In order to correct this, Bruner et al (1998) suggest practical compromise such as an increase in the number of time periods used so as to improve the statistical reliability of the estimate yet caution should be taken as ‘stale and irrelevant’ information may be included. Shortening the observation period from monthly to weekly or daily on the other hand, will increase the sample size but result in observations that are not normally distributed and additionally, unwanted random noise. The choice of a market index is also a practical compromise in that it is an ‘unobservable portfolio’ consisting of all risky assets. Kaplan and Peterson (1998) recommend the use of a cluster of firms in the industry similar to that being evaluated so as to obtain a more precise beta as individual firm beta estimation as established by academia, has a high concentration of statistical noise. It is important to note nonetheless that for firms that operate on a large scale, it is more difficult to collect well-matched clusters.
Financial theory decomposes a firm’s beta defining it as a composition of operating risk and financial risk. Financial risk is faced when a firm is levered and an increase in leverage results in a high beta. Hamada’s (1972) denotation of the levered beta is popularly used and written as follows:
[ ]
Where; is the levered beta, the unlevered beta (also known as the Asset beta),
is the marginal corporate tax and is the ratio of debt to equity. Inferring from the given formula, the unlevered beta is always lower than the levered beta complying with the traditional notion of higher risk being associated with higher leverage.
Applying this to M&A valuation, beta decompositions should be routinely performed during the due-diligence process. CBMA have overall, a lower beta given that
country-M&A: A Case Study on Liberty Global Inc. and Virgin Media Inc. | Elsa Nabenge 13
specific non-diversifiable risk may prove diversifiable in the context of a global market portfolio. The beta differs according to the market portfolio used in estimation (Froot and Kester, 1995).
Drawing from the derivations discussed thus far, the two types of DCF valuation will now be reviewed.
2.6.1. WACC-based DCF vs. Adjusted Present Value (APV)
WACC-based DCF
The standard financial firm valuation technique has been the WACC-based DCF. Like other discount rates, it is adjusted in order to capture any value generated or destroyed by the financing of a project (Luehrman, 1997a). The value, , of a project or firm using this valuation technique is calculated in two steps as follows:
i) PV of Planning Period- this is the present value of the cash flows during the
projection, year t to T.
∑
ii) Value of Residual Cash flows (Terminal Value)- this is the value of the
residual cash flows in year T, which begin in year T+1.
The present value of the TV is estimated as follows:
The value is then:
This technique has fewer computations yet with current computing software, is only suitable for the simplest and most static of structures. Ezzell and Miles (1980) argue in favor of WACC provided that the firm maintains a constant debt-to-equity ratio in market value, of which Inselbag and Kaufold (1997) prove. Luehrman
M&A: A Case Study on Liberty Global Inc. and Virgin Media Inc. | Elsa Nabenge 14
(1997a) advises that the application of WACC to firms with complex tax positions will yield poor results and is more unrealistic in cases such as cross-border capital budgeting problems. Since WACC by computation assumes the capital structure of the project or firm being valued i.e. the target, will be constant over time, Froot and Kester (1995) recommend re-estimation of the WACC for each period to account for the changes in the target’s capital structure. This in earlier years of the field of Finance would have been a tedious procedure nevertheless given sophisticated software it can be used if still preferred although it then defeats its purpose. However, if the patterns are known in advance, it may be better to implement the APV method.
APV (or Valuation in Parts)
This technique separates the effects of the capital structure on value from the estimation of asset values. This very useful for complex investments so as to decompose cash flows in order to have precision on what effects each financial maneuver has. The valuation is as follows:
i) Base Case Value- the firm is valued as though it were 100% equity financed.
To do this, the firm’s equity beta, is unlevered to obtain the asset
beta, as shown below:
or
The asset beta is then used to obtain the cost of assets, kA using CAPM:
Given the cost of assets, the FCFs can be discounted by it using the traditional DCF model to obtain the value, VU, which is the all-equity value of the firm.
ii) Financing Side Effects- these include interest tax shields, costs of financial distress, subsidies, hedges, issue costs and any other costs that may exclusively have an impact on the value, VU. Expected tax savings are
denoted as: . The present value of tax shields is estimated according
M&A: A Case Study on Liberty Global Inc. and Virgin Media Inc. | Elsa Nabenge 15
If absolute debt, is expected to remain stable, then the expected tax
savings, are discounted by the cost of debt, yielding;
.
If relative debt, is expected to be stable, then the expected tax savings, are discounted by the cost of assets, therefore yielding;
Therefore, APV is the sum of the separate valuation:
Deducing from the valuation, it is seen that APV is more informative as it gives a clear picture of where the value comes from. The discount rates used contain nothing but time value and a risk premium respective of the cash flows being discounted (Luehrman, 1997b). Inselbag and Kaulfold (1997) suggest that it is more practical to apply the APV technique when firms target absolute levels of debt outstanding in the future while the WACC is more efficient when firms plan to maintain the relative level of debt in the future.
Valuation of CBMA
Applying both techniques to cross-border valuation require caution because of the differences in currency which can have a weighty impact on the NPV of the deal, cost of capital, and the level and volatility of future financial performance (Pettit, 2004). Therefore, differentials between long-term riskless interest rates in the countries being valued should be used to convert discount rates in order to match the respective denomination, whether home or foreign. The use of this implies the difference in the time value of money between the two currencies Froot and Kester (1995). The cost of capital will then be calculated as follows:
M&A: A Case Study on Liberty Global Inc. and Virgin Media Inc. | Elsa Nabenge 16
( )
Where is the foreign-denominated cost of capital, the
home-denominated cost of capital and
is the interest differential.
and are the nominal yields during the investment period on
comparable-risk home- and foreign-denominated debt respectively (Froot and Kester, 1995). The cost of capital computed captures any currency risk associated with the given forex rate. Given a risky currency, while the other is constant means interest rates denominated in the risky currency will be higher than the comparable currency. If given the case of foreign-denominated cash flows and there is need to discount them to home-denominated cash flows, the interest differential is used once more in order to generate the exchange rate to be used for cash flow conversion. This approach is useful in cases where the foreign investment’s value in home currency is sensitive to exchange rates and a sensitivity analysis is required. It can also be used in cases where the computation of the cost of capital is more complex to determine than future exchange rates, and is computed as follows:
[
]
Where; is the expected exchange rate in the next period(s), the spot rate,
the number of years forward and
is the factor that determines the annual
change in the exchange rate.
Quoted interbank forward rates may be used in conversion yet are problematic as reliable quotes for most currencies are usually only available for a limited number of periods into the future (Froot and Kester, 1995).
It is important to note that this paper will not showcase the asset method and the guideline method in detail as with mere M&A procedure, the DCF technique still stands as the most convenient and efficient. However, the additional use of the guideline method is considered handy in performance analysis provided that the
M&A: A Case Study on Liberty Global Inc. and Virgin Media Inc. | Elsa Nabenge 17
comparable is well-matched within the industry (Kaplan and Ruback, 1996). Goedhart, Koller and Wessels (2005) nonetheless advise that finding firms with the right criteria for comparable values is challenging as industries are loosely identified and conclude that the DCF method stands the most reliable. Given the case of cross-border valuation, more parameters are involved- the more the expansion of firms, the larger the variation in growth rates, capital structure and other returns therefore making valuation complex, requiring close and informative valuation.
After the costs pointed out under the insight on M&A, and the valuation techniques are shown, the question still stands- whether M&A are worth the current global hype and how the transactions are paid for.
2.7. M&A, CBMA Consideration and the price they pay
M&A transactions may be paid for wholly with cash or securities- stock or debentures, or a combination of both cash and securities. Payment with use of stock may use a fixed or floating exchange rate; where the use of a floating rate involves an offer of stock value in absolute currency terms while the fixed rate an offer of a number of shares by made by the bidder. Most M&A are fixed exchange transactions where the number of acquirer shares to be exchanged for a target shares is revealed during the merger announcement. The release of new information has an impact on stock prices depending on investors’ sentiments. In the case of floating exchange rates, the number of shares to be exchanged is determined three months, after the announcement of the deal, known as the pricing period (Mitchell, Pulvino and Stafford, 2004). Mitchell et al (2004) with a sample of 2,130 announced M&A between 1994 and 2000, further establish that the reaction to floating exchange rate deals is positive upon announcement yet drifts to an average of -3.2% during the pricing period as it is indeterminate whether the deal consideration is approved or not. Securities-only transactions may, however bring about uncertainty on the seller’s end and therefore, a mix of both cash and securities is optimal. Additionally, there is over-payment and a strong link between negative price shocks when M&A deals are security-financed due to portfolio rebalancing as opposed to cash-financed deals. This destroys shareholder value for the acquiring firm (Mitchell et al, 2004). Andrade, Mitchell and Stafford (2001)
M&A: A Case Study on Liberty Global Inc. and Virgin Media Inc. | Elsa Nabenge 18
after studying a sample of publicly-traded US-based firms, find that acquiring firms that use at least some stock to finance their deals significantly have three-day average abnormal returns of -1.5% while those that don’t use stock have abnormal returns of 0.4%.
Moreover, target firms’ shareholders are better-off when there is no stock-financing in the transaction with three-day average abnormal returns slightly over 20% and 13% for stock-financed transactions. In addition, Hazelkorn and Zenner (2004) from their empirical analysis of 1,500 non-US financial transactions, conclude that the market reacted more positively to cash-financed acquisitions than to stock-financed acquisitions in both the short and long run as this shows more confidence in the acquiring firm’s future cash flows. However, use of cash leaves the acquiring firm’s shareholders bearing all the risk than with use of stock. Christofferson, McNish, and Sias (2004) prove that mergers achieve cost synergies more often than revenue synergies and sequential acquirers have a higher chance of succeeding than first-time acquirers.
In accordance with payment, the acquiring firm has to pay a premium over the price to settle the deal. Premiums are based on historical market values, strategic considerations and estimated synergies. Premiums are said to be worth it provided that the value of synergies realized is greater. Sahni and Sirower (2006) come up with a benchmark which shows how much of the firm’s is at risk assuming no synergies are realized after the acquisition, which they call Shareholder Value at Risk (SVAR). The SVAR is simply computed as follows:
Concluding with Hazelkorn and Zenner’s (2004) drawings; ‘acquisitions of foreign companies and assets created more shareholder value than domestic acquisitions, suggesting that the synergies and benefits underlying overseas expansion have been a source of significant strategic value.’
M&A: A Case Study on Liberty Global Inc. and Virgin Media Inc. | Elsa Nabenge 19
2.8. Conclusion
Different perspectives have been highlighted in this chapter from different academics and researchers with the main motive explaining the essence of M&A deals and why firms are highly driven to participate. However, the realization of pre-deal expectations are proven based on the structure of the parties involved in the deal and what type of deal whether vertical or horizontal. It’s nevertheless important to emphasize the conclusion of Devos et al (2009) which is that regardless of the structure or nature of the deal, given efficient resource allocation by management, synergies may actually be realized reducing the SVAR.
M&A deals are all expected to add value or maintain that which exists. In the same way, CBMA may also be looked at not only beneficial to the firms involved, but the economy in which the deal is made, as a type of FDI. Cross Border M&A have more sophisticated details in contrast to domestic deals therefore making the valuation process more involving with a call for vigilance. Provided this, the aforementioned APV valuation when applied in this work will carry a greater weight regardless of the results the other valuations yield.
Given the literature and overview of M&A and CBMA, the following section analyses the firms involved in one of the pronounced biggest deals in the cable industry between the US and the UK.
M&A: A Case Study on Liberty Global Inc. and Virgin Media Inc. | Elsa Nabenge 20
3. Firm and Industry Review
Telecommunications, Technology and Media (TTM) Industry is currently highly concentrated yet large media/telecommunications firms known over the past decade(s) still stand as the strongest, most influential and most competitive. The industry demands for many factors with consistent improvement over time in order to maintain competitiveness and client loyalty and credibility. Given the firms at hand, this section will give an insight on the firms involved and the industry of operation in their respective countries/regions.
3.1. Liberty Global Inc. (LGI), (Ticker: LBTY)
Liberty Global Inc., US-based and established in 2005 as a merger between Liberty Media and UGC, is an international provider of video, broadband internet and telephony services, serving 19.8 million customers, both residential- and business-based across 13 countries, primarily in Europe and Chile. Its business strategy has a higher weight of emphasis on superior organic growth, opportunistic M&A activity and commitment to superior equity returns which is done through an appropriate leverage mix and constant equity repurchases. It is listed on NASDAQ and its operations are run through its wholly-owned subsidiary, Liberty Global Europe Holding BV (Liberty Global Europe) where European countries include; Austria, Belgium, Czech Republic, Germany, Hungary, Ireland, Netherlands, Poland, Romania, Slovakia and Switzerland; while other countries of operation are from Latin America- Chile and Puerto Rico (Liberty Global Inc., 2012).
The cable-provider multinational firm’s services to European countries cover broadband networks and leads in most of the markets of operation. Under Liberty Global Europe is a wholly-owned subsidiary, UPC BV Holding, which provides the aforementioned services to nine European countries; Austria, Czech Republic, Hungary, Ireland, Netherlands, Poland, Romania, Slovakia, and Switzerland; and Chile. Other subsidiaries are wholly-owned Unitymedia KabelBW in Germany, and majority-owned Telenet in Belgium. Services provided to countries of operation in Latin America are under VTR Global Com SA, a subsidiary that is 80%-owned in Chile, and Liberty Global Puerto Rico a 60%-owned subsidiary in Puerto Rico. Liberty Global’s consolidated programming interests in both Europe and Latin America are primarily
M&A: A Case Study on Liberty Global Inc. and Virgin Media Inc. | Elsa Nabenge 21
held by another wholly-owned Liberty Global Europe subsidiary, Chellomedia BV, which also owns or manages investments in other businesses mainly in Europe (Liberty Global Inc., 2012).
3.1.1. Financials
Liberty Global Inc. is a highly leveraged firm with an increase in the year 2012 resulting in a debt-to-capital ratio of 93.55% (Bloomberg, 2013), of which most is at subsidiary level and is not liable to LGI as the parent. LGI has 85% of its total debt due 2017 and thereafter and managed to reduce fully-swapped borrowing costs by 80 basis points dropping to a year-over-year of 7.2%. The increase in debt in the preceding year was mainly due to the closing of its Puerto Rican OneLink transaction. In order to suffice attractive equity returns without incorporating unexpected risk, LGI targets a consolidated leverage level between four to five times of its consolidated operating cash flow. It is important to note however that timing of acquisitions and financing transactions may drift the level from the target. The year 2012 ended with the adjusted ratio of consolidated debt to that of annualized consolidated operating cash flows being 5.3x, while the ratio of consolidated net debt (which is total debt less cash and cash equivalents) to annualized consolidated operating cash flows was 4.7x (Liberty Global Inc., 2012a).
LGI’s consolidated liquidity at the end of the financial year 2012, was approximately $5.3 billion, including adjusted cash of $3.1 billion (of which $1.8 billion was at the parent level) and $2.2 billion in aggregate borrowing capacity as per credit facility. The firm’s ability to service or refinance debt and to maintain compliance with leverage covenants in credit agreements and indentures of its subsidiaries predominantly rests on its capacity to sustain or increase the operating cash flow of its operating subsidiaries, and achievement of sufficient returns on capital expenditure and acquisitions (Liberty Global Inc., 2012b).
Liberty Global’s financial year ended 31st December 2012 had recorded consolidated revenue of $10.3 billion with an 8.4% year-over-year growth rate of which, as shown in Figure 1, UPC maintained its place as the highest in growth and revenue generation over the 4- year trend. The surge of revenue from the firm’s preceding financial year was mainly due to the positive contributions of acquisitions, primarily KabelBW as well
M&A: A Case Study on Liberty Global Inc. and Virgin Media Inc. | Elsa Nabenge 22
as the Revenue Generating Units’ (RGU) organic growth of 34%. Adjusting for impacts of foreign exchange and acquisition, the rebased year-over-year revenue growth rate of the year 2012 was at 5.8%, which is seen to have increased by 1% compared to the year 2011, making it the best top-line performance in five years.
Figure 1. LGI Revenue: Segment Information
Source: Liberty Global Annual Report, 2011; 2012.
The firm’s products have, overall increased total organic additions i.e. RGU organic additions (see appendix), of which over the trend, the television unit has performed the worst in video subscription although improving by 7% as a result of the launch of Horizon TV in 2012, the unit is still yielding losses at net additional success level. The telephony and broadband units on the other hand, have maintained upright growth over the trend and reveal year-over-year growth of 32% and 19% respectively (Liberty Global, 2012b).
Liberty Global’s operating cash flow had an upward growth in the same manner as its revenue of 4% after adjustments made of acquisition and foreign exchange effects and operating cash flow margin 10 basis points up to 42.7% compared to the previous year. The year over year growth increase was mainly from Western Europe operations as a result of its consolidation of Kabel BW of which businesses in Germany, Ireland and the Netherlands contributed largely.
0 2,000 4,000 6,000 8,000 10,000 12,000 2009 2010 2011 2012 in US$ m ill ion Financial Year Other VTR Telenet UPC 6,964 8,364 9,511 10,311 CAGR 6.7% 10.3% 4.6% 18.7% Total 14%
M&A: A Case Study on Liberty Global Inc. and Virgin Media Inc. | Elsa Nabenge 23
The increase in revenue year by year has a corresponding expense of marketing its products i.e. advertising, delivery of mobile handsets to retail locations and third-party sales commissions. The cost of goods sold (CoGS) includes programming, network operations, interconnect, customer operations, customer care, stock-based compensation expense and other direct costs, while SG&A include human resources, information technology, general services, management, finance, legal and sales and marketing costs, stock-based compensation and other general expenses. CoGS have over the trend, only increased by 1% relative to its respective revenue in the corresponding financial year, as shown in Figure 2. Interest expenses have, compared to 2009 increased due to higher average outstanding debt of which some costs of borrowing have reduced by 80 basis points as stated earlier. Liberty Global has however, currently issued €500 million ($660 million) of 5.125% senior secured notes in Germany with the proceeds to be used to refinance its existing 8.125% senior secured notes. The slight increase in other expenses reflects the impact of the firm’s M&A activity including stock-based compensation (Liberty Global, 2012b).
Although Liberty Global has had an upward-oriented revenue growth rate and EBITDA with a CAGR of 11% over the 4-year trend, Figure 3 shows that net income has been relatively low with losses in years 2009 and the most in 2011 which was a result of interest payments on its high leverage and foreign exchange risk. The financial year ended 2012 brought forth, close to a 200% growth in net income making it positive primarily due to progressive acquisition impacts and better foreign transactions (Liberty Global; 2011, 2012b).
M&A: A Case Study on Liberty Global Inc. and Virgin Media Inc. | Elsa Nabenge 24 Figure 2. LGI Expenses/Revenue comparison: 2009 and 2012
Source: Liberty Global Annual Report, 2009; 2012.
Figure 3. LGI Consolidated Financial Performance
Source: Liberty Global Annual Report, 2011;2012.
27% 17% 12% 11% 0.5% 0.1% 18% 8% 4% 3% 0.3% CoGS 33% 2009 25% 18% 15% 5% 2% 1% 20% 7% 4% 3% 0.1% CoGS 34% 2012
Depreciation, Amortization and Impairment SG&A
Interest Expense Other expenses Unsual Items
Merger & Restructuring Charges UPC
Telenet VTR
Corporate & Other
Stock-based Compensation Expense
-2,000 0 2,000 4,000 6,000 8,000 2009 2010 2011 2012 in U S$ m ill ion EBITDA Net Income CAGR 15.4% -192%
M&A: A Case Study on Liberty Global Inc. and Virgin Media Inc. | Elsa Nabenge 25
The financial year 2012 for LGI reported a decrease in CAPEX of $43 million compared to the corresponding prior year due to working capital efforts as non-cash vendor financing and capital lease arrangements were $170 million higher year-over-year.
Figure 4. LGI Capital Expenditure
Source: Liberty Global Annual Report, 2011;2012.
Given the financials, Liberty Global with its borrowing capacity, liquidity, access to capital markets and operating momentum expects a continuation in growth of RGUs, improvement in its products, potential use of excess capital including primarily, M&A activity and stock buybacks. The firm continues to incorporate competitive and economic factors in its markets of operation and the availability of accretive M&A opportunities and the impact of M&A activity on its operations and financial performance, and other updated information and statements. It is worth noting however that activities and operations are exposed to a level of risk and may not yield results as expected in forth-coming years. The risks include most importantly, subscription of customers which may be maintained by technological improvement of products and advanced offerings in order to capture potential subscription subsequently increasing RGUs over time. Other risks include law and regulation of which can be minimized by compliance in order to close acquisitions and dispositions (Liberty Global, 2012b). 0 500 1,000 1,500 2,000 2009 2010 2011 2012 in US $ m ill ion CAPEX CAGR 5.8%
M&A: A Case Study on Liberty Global Inc. and Virgin Media Inc. | Elsa Nabenge 26
3.1.2. Stock Market Performance
Liberty Global has its stock listed and traded on the NASDAQ Global Select Market with three classes of common stock namely; LGI Series A with ticker LBTYA, LGI Series B with ticker LBTYB and LGI Series C with ticker LBTYK. The transaction basis is that each share of LGI Series A and Series B Common Stock held on the record date for the distribution will receive 1 share of LGI Series C Common Stock. The transaction is generally intended to be tax-free to holders of LGI Series A and Series B Common Stock for U.S. federal income tax purposes (Liberty Global, 2005). Figure 5 shows the evolution of the respective stocks’ close price over the 4-year trend.
Figure 5. LGI Close Price Evolution
Source: Bloomberg Data.
3.1.3. Industry Review in Countries/Regions of Operation
Most of Liberty Global’s footprint is across Europe of which it manages its operations across 11 countries bound by EU Regulation which includes Communication Regulation and Broadcasting Law. These cover formalities such as registration and licensing, distribution of media, data protection, retention and electronic commerce. Its European operating firms are also subject to both national and European level regulations on competition and on consumer protection, which are broadly harmonized at the EU level. The most influential of these countries including Chile will
0 10 20 30 40 50 60 70 12/31/2009 12/31/2010 12/31/2011 12/31/2012 in US $
LBTYA Close Price LBTYB Close Price LBTYK Close Price
M&A: A Case Study on Liberty Global Inc. and Virgin Media Inc. | Elsa Nabenge 27
be briefly analyzed to have a better understanding of the markets Liberty Global Inc. operates in and under what regulations.
Germany
Germany has altered the EU laws into national laws although under the German legal system competency is split between the Federal State (telecommunication law) and the German federal states (Bundesländer) (media law). As of December, 2011, The Federal Cartel Office approved the KBW Acquisition under conditions such as distribution of basic digital television channels (as opposed to channels marketed in premium subscription packages) on its entire network in unencrypted form commencing January 1, 2013 (Liberty Global, 2012a).
The Netherlands
The Netherlands has an electronic communications law that broadly transposes the Regulatory Framework. According to this electronic communications law, Onafhankelijke Post en Telecommunicatie Autoriteit ( OPTA ), the Netherlands NRA , should perform a market analysis to determine which, if any, operator or service provider has Significant Market Power . However, after several analyses, the television market proved to be independent of regulation as competition had increased over time leaving clients/consumers free to choose across providers (Liberty Global, 2012a).
Switzerland
Switzerland has a regulatory system which partially reflects the principles of the EU , yet it is different from the European regulatory system of telecommunications. The Telecommunications Act (Fernmeldegesetz) regulates, in general, the transmission of information, including the transmission of radio and television signals. Swisscom is a dominant provider and as per restrictions, is the only one with unbundled access to the local circle of third parties. This leaves LGI’s UPC Cablecom and other cable providers have no such access. UPC Cablecom ’s retail customer prices are subject to review by the Swiss Price Regulator. In October 2012, UPC Cablecom announced an agreement with the Swiss Price Regulator pursuant to which UPC Cablecom would make certain changes to its service offerings in exchange for progressive increases in