Faculdade de Ciências Departamento de Biologia Vegetal
Screening for RAG activity in haematopoietic
tumours using a novel reporter strategy
Inês Gomes de Noronha Trancoso
Mestrado em Biologia Molecular Humana 2009
Universidade de Lisboa Faculdade de Ciências Departamento de Biologia Vegetal
Screening for RAG activity in haematopoietic
tumours using a novel reporter strategy
Inês Gomes de Noronha Trancoso Dissertação de Mestrado orientada por:
Doutora Leonor Morais Sarmento – Instituto Gulbenkian de Ciência, Oeiras Professora Doutora Maria Margarida Telhada – Faculdade de Ciências da
Universidade de Lisboa, Lisboa
Mestrado em Biologia Molecular Humana 2009
Screening for RAG activity in haematopoietic tumours using a novel reporter strategy
Table of contents
Acknowledgements ... iii
List of Abbreviations ... iv
List of Figures ... vi
List of Tables ... vii
Abstract (Portuguese) ... viii
Abstract (English) ... xi
1. INTRODUCTION ... 1
1.1. Evolution of the Immune System Specificity ... 1
1.2. V(D)J Recombination ... 1
1.2.1. Regulation of V(D)J Recombinaion ... 4
1.3. RAG ... 5
1.3.1. Regulation of RAG expression ... 5
1.3.2. RAG and genomic instability ... 6
1.3.3. Quantification of RAG activity ... 8
1.3.3.1. The GFPi reporter ... 10
2. AIMS OF THE PROJECT ... 11
3. MATERIALS AND METHODS ... 11
3.1. Cell culture ... 11
3.2. In vitro Recombination Assay (IVRA) ... 12
3.3. Statistical analysis ... 12
3.4. Flow cytometry analysis ... 12
3.5. Immunoblot analysis ... 12 3.6. Molecular cloning ... 13 3.6.1. CMV-RAG Cloning ... 13 3.6.2. GFPi-Cons Cloning ... 14 3.6.3. GFPi 23-RSS Cloning ... 14 3.6.4. GFPi cRSS Cloning ... 14
3.7. Viral production and titers ... 14
3.8. Cell line infections ... 15
4. RESULTS ... 15
4.1. Optimization of the GFPi IVRA ... 15
4.2. GFPi sensitivity to 23-RSS sequence degeneration ... 17
4.4. Assessment of RAG-mediated PTEN cRSS functionality in vitro ... 22
4.5. Endogenous RAG activity detection in human tumour cell lines ... 23
5. DISCUSSION ... 24
5.1. Optimization of the GFPi IVRA ... 24
5.2. GFPi sensitivity to 23-RSS sequence degeneration ... 25
5.3. Assessment of RAG-mediated cRSS functionality in vitro ... 27
5.4. Assessment of RAG-mediated PTEN cRSS functionality in vitro ... 28
5.5. Endogenous RAG activity detection in human tumour cell lines ... 29
5. CONCLUDING REMARKS ... 30
6. REFERENCES ... 31
Screening for RAG activity in haematopoietic tumours using a novel reporter strategy Acknowledgements
À Leonor Sarmento, por me ter proposto este projecto, pelo empenho na orientação do mesmo, por me ter iniciado no verdadeiro trabalho de investigação, pelos numerosos ensinamentos de “truques” laboratoriais e também pela partilha dos sucessos e insucessos, pelos dias longos e ainda pelas brincadeiras.
À Professora Margarida Telhada, por ter aceite a co‐orientação desta dissertação, pela receptividade e entusiasmo que sempre demonstrou pelo meu trabalho. Também pelo enorme trabalho que lhe dei para poder ultrapassar todas as burocracias. To Jocelyne Demengeot, for opening the doors of her group, making me feel at home. Thank you for the constant interest for my work, guidance and availability. Aos Doutores João Barata e Andres Yunes por toda a informação que me permitiu estudar a mutação encontrada num paciente leucémico, bem como pelo fornecimento das linhas celulares. Ao Vasco Barreto por ter contribuído com sugestões valiosas no decurso deste trabalho. Ao Jorge Carneiro pelo aconselhamento estatístico, pelas discussões e ensinamentos. Ao Rui Gardner e à Telma Lopes pelo apoio técnico em citometria de fluxo, pela partilha do entusiasmo nos bons resultados e pela incansável disponibilidade, até aos fins‐de‐semana e feriados.
A todos os colegas com quem partilhei o laboratório durante este ano, pela troca de experiências, pela boa disposição e pelo excelente ambiente de trabalho. Em particular aqueles que tiveram uma partilha mais directa do trabalho de todos os dias: Ana Catarina Martins, Andreia Lino, Marie Louise Bergman e Ricardo Paiva.
Aos colegas de Faculdade que seguiram a vida de investigação no IGC, ou fora, juntamente comigo: Alexandre Leitão, Ana Ferreira, Isadora Monteiro, João Osório, Marta Marialva, Pedro Lima, Pedro Patraquim e Sara Esteves pela partilha de experiências, pelas discussões e pelo companheirismo.
Ao Vitor por ter estado sempre a meu lado e por ter trocado jantares por companhia durante o meu trabalho fora de horas.
À minha família pelo apoio transmitido ao longo de todo o meu trabalho, em especial aos meus pais.
Ao IGC, pela hospitalidade e oportunidade de desenvolver a minha tese num Instituto de excelência, onde a qualidade científica se faz partilhando e discutindo.
List of Abbreviations
AML Acute Myeloid Leukaemia AR Antigen Receptor
APL Acute Promyelocytic Leukaemia ALL Acute Lymphoblastic Leukaemia BCR B Cell Receptor
Bp base pair
cDNA complementary Deoxyribonucleic Acid CML Chronic Myelogenous Leukaemia CMV Citomegalovirus
cRSS cryptic Recombination Signal Sequence DN Double-negative
DNA Deoxyribonucleic Acid DSB Double-Strand Break ER Efficiency of recombination GFP Green Fluorescent Protein HEK Human Embyonic Kidney HRP Horse Radish Pedroxidase IVRA In vitro Recombination Assay
mRFP monomeric Red Fluorescent Protein MSCV Murine Stem Cell Virus
NHEJ Non-homologous end joining pt post-transfection
Screening for RAG activity in haematopoietic tumours using a novel reporter strategy RNA Ribonucleic Acid
RSS Recombination Signal Sequence TCR T Cell Receptor
TdT Deoxynucleotidyl Transferase μL microliter
List of figures
Figure 1. Schematic representation of V(D)J recombination ... 3
Figure 2. Models of RAG illegitimate activity ... 7
Figure 3. Representation of a number of existing RAG reporters ... 8
Figure 4. The GFPi reporter ... 10
Figure 5. Representative flow cytometry analysis of control (-) GFPi-Cons (left), H2k-RAG GFPi IVRA (middle) and CMV-RAG GFPi IVRA (right) ... 16
Figure 6. Efficiency of recombination values for GFPi-Cons upon CMV-RAG plasmid titration in IVRAs ... 17
Figure 7. Representative flow cytometry analysis of successive CMV-RAG GFPi IVRAs with decreasing titrated levels of CMV-RAG plamid amounts ... 17
Figure 8. p290T and H2k-RAG GFPi 23-RSS reporters’ ERs ... 18
Figure 9. Representative flow cytometry analysis plots of negative control GFPi-Cons IVRA (upper left) and H2k-RAG GFPi IVRAs ... 19
Figure 10. CMV-RAG 23-RSS GFPi reporters’ ERs ... 19
Figure 11. Representative flow cytometry analysis plots of CMV-RAG 23-RSS GFPi IVRAs20 Figure 12.Efficiency of recombination obtained for each GFPi-RSS/cRSS reporter ... 21
Figure 13. Representative flow cytometry analysis plots of CMV-RAG 12-RSS/cRSS-GFPi IVRAs ... 21
Figure 14. Efficiency of recombination obtained for GFPi-PTEN cRSS reporter ... 22
Figure 15. Representative flow cytometry analysis plots of negative control GFPi-Cons IVRA (left), CMV-RAG GFPi-Jβ (middle) and GFPi-PTEN (right) cRSS IVRAs ... 22
Figure 16. Flow cytometry plots of human tumour cell lines (HL-60, K-562, SUP-T1, Jurkat, NALM-6 and Reh) infected with control (MSCV-mRFP) or GFPi-Cons retroviral-based reporters at three weeks post-infection ... 24
Appendix Figure I. Phylogenetic representation of immune function characteristics, mechanisms of genetic organization and diversity generation events in selected species ... 41
Figure II. Schematic representation exemplifying an environmental regulatory mechanism affecting V(D)J recombination ... 41
Figure III. Expected GFPi-Cons PCR product sequence (5’ to 3’) ... 42
Screening for RAG activity in haematopoietic tumours using a novel reporter strategy
List of tables in Appendix
Table I. List of PCR products and respective reverse primers, 23-RSS ... 38 Table II. List of PCR products and respective reverse primers, 12-RSS ... 38 Table III. List of 23-RSS reporters and respective RIC score, average efficiency of
recombination (ER) and standard deviation (SD) in pT29084 and H2k-RAG GFPi IVRAs .... 38
Table IV. Fold difference coefficients between ER values of the p290T ... 39 Table V. Fold difference coefficients of between ER values of the H2k-RAG GFPi ... 39 Table VI. Coefficient of fold difference between ER values of p290T and H2k-RAG GFPi .. 39 Table VII. List of 23-RSS reporters, respective efficiency of recombination (ER) and standard deviation (SD) in CMV-RAG GFPi IVRAs ... 39 Table VIII. List of RSS (Cons, VH and Jβ) and cRSS (Lmo2, SCL) reporters, respective
efficiency of recombination (ER) and standard deviation (SD) in literature reporter assays and CMV-RAG GFPi IVRAs ... 39 Table IX. List of human haematopoietic cell lines and respective efficiency of recombination (ER) measured either in the literature (pGG49) or with the retroviral-based GFPi-Cons
Abstract (Portuguese)
A recombinação V(D)J, o rearranjo somático de segmentos génicos variable (V),
diversity (D) e joining (J), é o fenómeno responsável pela imensa diversidade de reportório
de receptores de antigénio (ARs) que medeiam o reconhecimento molecular pelo sistema imunitário dos vertebrados. Os Recombination-Activating Genes (RAG) 1 e 2 formam a endonuclease RAG que reconhece sequências sinalizadoras de reconhecimento (RSSs) adjacentes aos segmentos génicos do AR, gerando quebras na dupla cadeia de ADN. A junção e reparação destas quebras é realizada pela actividade da maquinaria de reparação não homóloga (non-homologous end joining ou NHEJ) em coordenação com a RAG, ultimamente gerando ARs funcionais.
A recombinação V(D)J é regulada a vários níveis. Pensava-se que a expressão de RAG estaria restrita a determinados estadios do desenvolvimento linfocitário (células pró/pré B e T). A nível molecular, a actividade RAG dá-se pelo reconhecimento direccionado de RSSs. Estes apresentam uma estrutura consensus, sendo constituída por um heptâmero, um espaçador de 12 ou 23 nucleótidos e um nonâmero, apresentando poucas sequências
consensus. Estas sequências são portanto consideravelmente degeneradas, favorecendo
uma panóplia de interacções com a RAG e consequentemente de diversidade de ARs. Contudo, existem sequências semelhantes a RSSs, os RSSs crípticos (cRSSs), que se presume existirem ao longo do genoma, devido à aleatoriedade da composição nucleotídica do mesmo ou simplesmente pela acção de mecanismos evolutivos. Alguns destes cRSSs são realmente substratos funcionais da RAG. Devido a tal, a RAG também tem sido denominada de “transposase promíscua”. Actualmente, existem três modelos de actividade ilegítima de RAG, o modelo de substrate selection error, envolvendo rearranjos entre um RSS e um cRSS ou dois cRSSs; o modelo de end-donation, em que os rearranjos são feitos entre um RSS e uma quebra de ADN em cadeia dupla independente de RAG; o modelo de
transposition que ocorre no âmbito de uma reacção legítima em que, por extensão do tempo
de vida do fragmento excisado, a RAG realiza uma reacção de transposição com reinserção do mesmo fragmento. Estes modelos têm como objectivo explicar como a actividade ilegítima de RAG pode eventualmente originar assinaturas nucleotídicas, e mutações como translocações, que estão na base da instabilidade genómica encontrada em tumores linfóides.
O padrão de expressão de RAG durante a hematopoiese permanece controverso. Existem evidências de expressão de RAG em estadios precoces do desenvolvimento hematopoiético, anteriormente ao estadio de comprometimento da linhagem linfóide. Adicionalmente, a presença de expressão de RAG, bem como de assinaturas nucleotídicas reminiscentes de rearranjos, foi descrita em doenças malignas hematopoiéticas quer de
Screening for RAG activity in haematopoietic tumours using a novel reporter strategy fenótipo linfóide como mielóide, nomeadamente em leucemias promielocíticas agudas (APL) e leucemias mielóides agudas (AML). Contudo, o papel da RAG na origem, manutenção e progressão de instabilidade genómica na transformação hematopoiética permanece obscuro.
Vários repórteres moleculares de actividade RAG têm vindo a ser desenvolvidos, com vista a compreender os fenómenos bioquímicos e fisiológicos de actividade RAG. As técnicas de quantificação de rearranjos moleculares mediados por RAG têm normalmente requerido grandes quantidades de material biológico, bem como procedimentos intrincados e morosos. Apesar de algumas limitações terem sido ultrapassadas, e de alguns repórteres possuírem um esqueleto retroviral (em vez de extracromossomal), vantajoso por mimetizar uma condição mais fisiológica, a detecção de actividade RAG requer ainda passos secundários. Até à data, nenhum repórter reuniu um substrato retroviral com um método simples e directo de leitura de actividade RAG.
O nosso laboratório gerou recentemente o GFPi, uma nova ferramenta molecular epissomal/retroviral baseada em fluorescência, que permite uma fácil avaliação da actividade RAG em vários tipos celulares por permitir o cálculo de um valor de eficiência de recombinação (ER) de RAG através da análise de células por citometria de fluxo.
Como primeiro objectivo deste trabalho, procurámos estabelecer este novo repórter optimizando a detecção de actividade RAG no ensaio de recombinação in vitro, através de um aumento de expressão dos genes RAG1 e RAG2, localizados nos plasmídios utilizados neste ensaio. Concluímos que o referido aumento de expressão permitiu alargar a janela de detecção de valores de eficiência de recombinação in vitro.
Com vista avaliar a sensibilidade do GFPi na detecção de actividade RAG em presença de sequências de reconhecimento degeneradas, reproduzimos o setup experimental abordado por Kelsoe e colaboradores com o repórter clássico pJH290, desta vez com o GFPi. Para tal, variámos a sequência espaçadora de 23 nucleótidos do RSS contido no GFPi e submetemos cada repórter a ensaios de recombinação in vitro, de maneira a observar a repercussão em valores relativos de actividade RAG. Observámos que o GFPi é realmente sensível a variações nucleotídicas nesta estrutura nucleotídica em particular, apresentando uma tendência de valores de eficiência de recombinação semelhante à literatura, apesar de não ter reproduzido fielmente a mesma.
Acoplando as vantagens do GFPi à optimização obtida na detecção de valores de eficiência de recombinação in vitro, nomeadamente por amplificação ERs até então residuais, decidimos testar a aplicabilidade do GFPi na medição de ERs de uma colecção de RSSs crípticos (cRSSs) conhecidos por estarem envolvidos no desenvolvimento leucémico. Não só validámos esta ferramenta como apta a ser aplicada nestas condições como analisámos a funcionalidade destes cRSSs, já descritos na literatura. Ao contrário do que é
mencionado nesta, o GFPi permitiu classificar o cRSS do gene stem cell leukaemia (SCL) como possuindo uma actividade RAG detectável, apesar de residual.
Este novo ensaio permitiu-nos ainda quantificar a eficiência de recombinação RAG de um cRSS previamente não detectado, encontrado no primeiro exão do gene phosphatase
and tensin homologue deleted on chromosome 10 (PTEN), conhecido por estar envolvido na
origem de leucemias. Provámos que o cRSS do gene PTEN é tão funcional como outros RSSs dos loci V(D)J, e que esta actividade RAG se correlaciona com uma mutação recentemente encontrada no mesmo local, num paciente oncológico com Leucemia Aguda Linfóide de células T.
Também usufruímos da forma retroviral do GFPi, com vista a quantificar actividade RAG endógena em linhas celulares hematopoiéticas tumorais humanas. Para tal, desenvolvemos a produção de pseudoretrovirus de GFPi, procedendo à infecção das mesmas linhas celulares, quer de origem linfóide como mielóide, de maneira a obter a forma integrada do GFPi em número baixo de integrantes por célula. Apesar de termos encontrado diferenças em actividade RAG específicas de linhagem (nomeadamente na linha de células B Reh que apresentou actividade RAG intensa), não encontrámos nenhum sinal de actividade RAG endógena promíscua num curto espaço de tempo, nas linhas celulares mielóides.
Não obstante, descobrimos que o repórter GFPi não só consegue providenciar uma medição quantitativa de forma transiente in vitro (na sua forma epissomal), como também o faz na sua forma integrada ex vivo (na sua forma retroviral), como substrato estável e mais próximo de uma condição fisiológica.
Assim, concluímos com este trabalho que o repórter GFPi reúne todos os requisitos para um repórter de actividade RAG eficiente, acoplado a um método fácil e de leitura directa. Como resultado, possuímos agora uma ferramenta robusta adequada a várias possíveis aplicações. Prevemos que o GFPi possa possibilitar a descoberta da relação entre a actividade promíscua da RAG e o desenvolvimento leucémico, que foi preliminarmente abordada neste trabalho, bem como aplicações bioquímicas (na compreensão da fisiologia da recombinação V(D)J) e biomédicas (numa perspectiva clínica, como ferramenta de diagnóstico).
Palavras-chave: RAG, recombinação V(D)J, repórter molecular, GFPi, cRSS, desenvolvimento leucémico, instabilidade genómica.
Screening for RAG activity in haematopoietic tumours using a novel reporter strategy Abstract (English)
Recombination-Activating Genes (RAG) 1 and 2, form the site specific recombinase that mediates V(D)J recombination at the antigen receptor loci, a process responsible for lymphocyte diversity. RAG can also interact with degenerated recognition signal sequences (cRSSs) distributed throughout the genome and potentially induce genomic instability. To this date, no available reporter of RAG activity has gathered the versatile features of a molecular tool with a simple method of readout. Our laboratory has recently generated GFPi, a novel episomal/retroviral fluorescence-based molecular tool that allows for fast assessment of RAG activity in various cell types.
We have found that the GFPi reporter can not only provide in vitro quantitative measurement transiently, being sensitive to RSS sequence degeneration, but also ex vivo in its integrated form as a stable substrate.
We have also optimized the in vitro recombination assay (IVRA) for the detection of a broader window of RAG activity values. This novel assay allowed us to quantify the efficiency of RAG recombination of a selected set of cRSSs, namely a previously undetected cRSS found in the first exon of the phosphatase and tensin homologue deleted on chromosome 10 (PTEN) gene, which is known to be involved in leukemogenesis. PTEN cRSS was proved to be as functional as other V(D)J loci RSSs, and this activity correlates with a novel mutation which was recently found in a leukaemic patient in this same site.
We also made use of the retroviral-based form of GFPi in order to quantify endogenous RAG activity in human haematopoietic tumour cell lines of lymphoid and myeloid origin. Although we have found lineage-specific differences on RAG activity (namely in Reh B-cell line which presented intense RAG activity), we found no signs of promiscuous endogenous RAG activity in myeloid cell lines in a short timespan.
Thus, we believe the GFPi reporter gathers all the requisites for an efficient RAG activity reporter, coupled with a fast and direct method of readout. Moreover, we now possess a robust tool that is suitable for a number of applications, namely unravelling the relation between RAG promiscuous activity and leukaemogenesis, which was preliminary addressed in this work.
Key-words: RAG, V(D)J recombination, molecular reporter, GFPi, cRSS, leukaemogenesis, genomic instability.
Screening for RAG activity in haematopoietic tumours using a novel reporter strategy 1. INTRODUCTION
1.1. Evolution of the Immune System Specificity
The generation of immune diversity is nowadays seen as a long story from the evolutionary point of view. Ever since pathogens exist, the host’s immune system has endured the difficult role of detecting foreign and harmful entities that are extremely diverse, ensuring their ablation. Currently two models contain evolutionary explanations regarding the host’s solutions for this struggle: a discrimination mechanism, between self and non-self entities1 and a danger discrimination mechanism2, with damage signals eliciting immune
responses. In both cases, the mechanism allowed for an amelioration of the specificity for pathogen recognition. This immune specificity was achieved by taking advantage of DNA recombination, gene conversion3 and hypermutation of recognition receptors4, generating a
diverse defence line. However, the innate immune system cannot cope with a great level of diversity since the generation of its germline-encoded receptors is limited by genome size5.
The adaptive immune system, which is to date only described in vertebrates, owes its success to the appearance of new cell types, new morphological innovations6, new
mechanisms of diversity generation and increased specificity for pathogen recognition5.
Moreover, these specialized cell types enhanced memory strategies, enabling a more efficient response to the pathogen’s subsequent attack. The crosstalk within and between the innate and the adaptive immune systems was also extremely important in this process7.
Recombination-Activating genes 1 and 2 (RAG1 and RAG2) had a pivotal role on generating the diversity of the adaptive immune system 8-11. They codify for the
endonuclease or recombinase complex (herein referred as RAG unless individual proteins are mentioned) which mediates the recombination of DNA segments, giving rise to unique antigen receptors (ARs) present in B and T lymphocytes, a phenomenon named as V(D)J recombination11. Due to its “cutting and stitching” properties, RAG allows for a major
manipulation of the germline information contained in the DNA of lymphocytes11, 12. The RAG
genes are present in all jawed vertebrates and RAG’s target sequences are highly conserved as well (Fig.I, App.5). Despite the existing discussion about the time of appearance of these
genes, it is thought that RAG evolved from a single transposition event which occurred approximately 500 million years ago13. Nevertheless, a RAG-like sequence was also found in
Echinoderms14 which may provide alternative explanations to RAG’s evolution. 1.2. V(D)J Recombination
V(D)J recombination, the somatic rearrangement of variable (V), diversity (D) and joining (J) segments, is the phenomenon responsible for the immense diversity of AR repertoires that mediate molecular recognition by the vertebrate immune system12. The RAG
endonuclease specifically recognizes recombination signal sequences (RSSs) adjacent to AR gene segments and generates DNA double strand breaks (DSBs)11, 12. Joining and repair
of the nicked strands are accomplished by the activity of the non-homologous end-joining (NHEJ) machinery, in coordination with RAG, to give rise to functional ARs of B and T cells (BCR and TCRs, respectively)15.
In mammals, the final protein structure originating the AR is a heterodimer: the BCRs are composed by an immunoglobulin heavy chain (IgH) which can be coupled either with an Igκ or Igλ light chain, whereas the TCRs are either αβ or γδ protein dimmers. Thus, there are seven AR loci present in the mammalian genome.
V(D)J recombination defines several stages of lymphocyte development. Concerning the development of B cells, taking place in the bone marrow, these cells recombine the IgH locus (from Pre-Pro to Pro-B stage), rearranging one of the possible light chain loci, Igκ or Igλ, (from Pro to Pre-B stage), in order to produce the BCR. If rearranging the Igκ, the cell represses the Igλ locus rearrangement: a mechanism known as isotypic exclusion. The cells are further subjected to negative and positive selection pressures, avoiding auto-reactivity and increasing specificity to a given antigen.
Concerning T cell development, αβ-T cells and γδ-T cells arise in the thymus from a common progenitor cell originated in the bone marrow16. T cells rearrange the TCRβ, γ, and
δ loci first at the double-negative (DN) stages (from DN2 to DN3 stage) but there is a strong bias for β-chain production. This chain couples to the invariant pre-TCRα chain, forming the pre-TCR. The pre-TCR checkpoint occurs from DN3 to DN4 stage enabling survival, proliferation and differentiation of these cells. Finally, the TCRα locus is rearranged (from DN4 to double-positive, DP, cell stage) and the cell produces the αβ-TCR. It is the TCR that allows for the positive-selection stage, where the cell commits either to the CD4 or CD8 single-positive (SP) lineage, before being subjected to negative selection pressures (which eliminate auto-reactive T cells) and exiting the thymus to the peripheral organs. γδ-T cell fate is still poorly understood.
The AR loci vary in number and order of V, D and J segments (also in between organisms17) and only the IgH, TCRβ and TCRγ loci bear D segments, which are located
between the Vs and Js. All segments are flanked by RSSs, which are composed by a palindromic seven-nucleotide consensus sequence (heptamer), followed by a 12 or 23-nucleotide spacer and a nine 23-nucleotide sequence (nonamer) exhibiting few consensus positions18, 19 (Fig.1 A). Even though this signature is essential for recombination, these three regions can vary in nucleotide composition, allowing for a degenerated permission and favouring a wide range of interactions with RAG, consequently affecting the efficiency of the rearrangement in course. During recombination, RAG obeys a 12/23 rule, meaning that, with few exceptions, it only assembles a 12-RSS with a 23-RSS, allowing for a less promiscuous
Screening for RAG activity in haematopoietic tumours using a novel reporter strategy
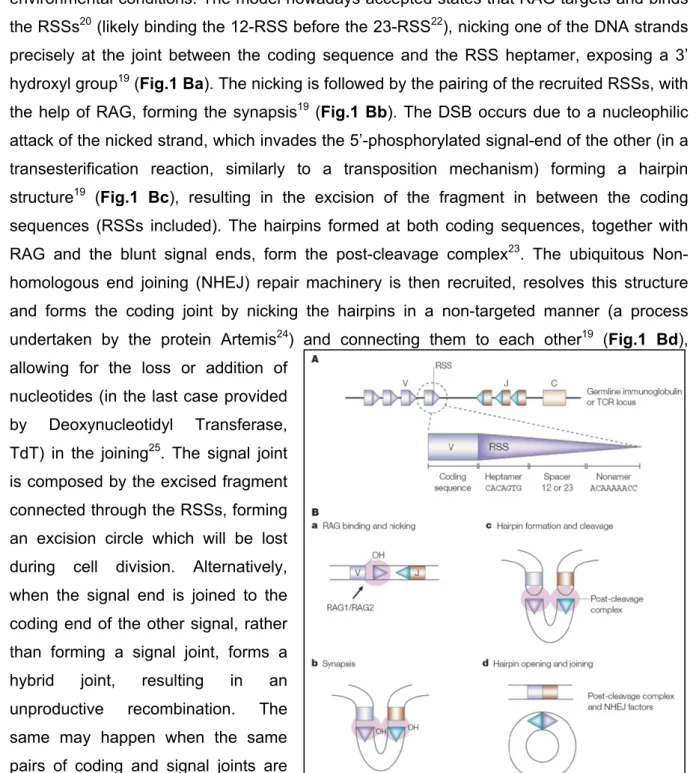
Figure 1. Schematic representation of V(D)J recombination. A. AR organization B. Snapshots of
V-J reaction Ba. RAG binding and nicking Bb. Synapsis Bc. Hairpin formation and cleavage Bd. Haripin opening and joining.Triangles represent RSSs and rectangles represent AR gene segments.
In Roth et al., 2003.
and more targeted activity20. The RSSs’ orientation is also important, since it determines if
the sequence between the rearranged segments will be inverted or excised21. The usual
organization of the RSS in the AR loci is such that the rearranged segments (coding sequences) remain in the chromosome and the intermediate sequence is excised, along with the RSSs (Fig.1 A).
V(D)J recombination is triggered during lymphocyte development by specific environmental conditions. The model nowadays accepted states that RAG targets and binds the RSSs20 (likely binding the 12-RSS before the 23-RSS22), nicking one of the DNA strands
precisely at the joint between the coding sequence and the RSS heptamer, exposing a 3’ hydroxyl group19 (Fig.1 Ba). The nicking is followed by the pairing of the recruited RSSs, with
the help of RAG, forming the synapsis19 (Fig.1 Bb). The DSB occurs due to a nucleophilic
attack of the nicked strand, which invades the 5’-phosphorylated signal-end of the other (in a transesterification reaction, similarly to a transposition mechanism) forming a hairpin structure19 (Fig.1 Bc), resulting in the excision of the fragment in between the coding
sequences (RSSs included). The hairpins formed at both coding sequences, together with RAG and the blunt signal ends, form the post-cleavage complex23. The ubiquitous
Non-homologous end joining (NHEJ) repair machinery is then recruited, resolves this structure and forms the coding joint by nicking the hairpins in a non-targeted manner (a process undertaken by the protein Artemis24) and connecting them to each other19 (Fig.1 Bd),
allowing for the loss or addition of nucleotides (in the last case provided by Deoxynucleotidyl Transferase, TdT) in the joining25. The signal joint
is composed by the excised fragment connected through the RSSs, forming an excision circle which will be lost during cell division. Alternatively, when the signal end is joined to the coding end of the other signal, rather than forming a signal joint, forms a hybrid joint, resulting in an unproductive recombination. The same may happen when the same pairs of coding and signal joints are
rejoined, forming an open-and-shut joint26.
Due to the combinatorial properties of the V(D)J segment assembly (which can generate 107 possible ARs27), the randomness of Artemis and TdT activity, pairing of the AR
heterodimers and to somatic hypermutation (in B cells) the diversity provided for AR generation is approximately 1010 possible ARs in B cells and 1017 in T cells28.
1.2.1. Regulation of V(D)J Recombination
V(D)J recombination is regulated at several levels. Lineage and developmental-stage restrictions of V(D)J recombination are controlled by RAG expression (which occurs in two waves of expression during lymphocyte development, mentioned in 1.2.) and by RAG’s differential accessibility to the loci29. Despite the little information on this mechanism, it is
known that locus accessibility is controlled by large-scale chromosome dynamics30, specific
histone methylation profiles31, secondary chromatin structures, chromatin remodelers32,
cis-acting elements33-35, transcriptional factors36 and RSS nucleotide composition itself37. All of
these factors dictate the chromosome region and the AR locus to be exposed to RAG, the segments to be recruited for rearrangement38, the order of AR and segment rearrangement39,
and some of them even regulate localized RAG deposition36. Concerning the cell cycle
regulation, V(D)J recombination is restricted to the G0/G1 stage, which is when RAG is expressed. The extracellular environment also conditions V(D)J recombination since it influences RAG and repair machinery components’ accumulation and degradation in the cell (eg. Fig.II, App.,30, 40). Besides serving as an intermediate for V(D)J recombination, RAG also plays a regulatory role in several stages of V(D)J recombination, namely in the hairpin opening stage, in stabilization of the post-cleavage complex and in the recruitment of the NHEJ machinery.
Allelic exclusion is also a regulatory mechanism inherent to V(D)J recombination, namely to all B cell and some T cell AR loci15. It guarantees the expression of a single BCR
in the cell, by silencing the allele which is not being rearranged at the AR locus, through a feedback inhibition mechanism. If the rearrangement is unproductive, then this restriction is withdrawn and the other allele is rearranged. Recently, new data provided evidence that RAG is implicated in the regulation of allelic exclusion41.
Additionally, V(D)J recombination does not require but is enhanced in vitro by the presence of the high mobility group proteins 1 and 2 (HMGB1 and 2)42, which suggests that
these proteins may regulate V(D)J recombination in vivo.
Due to this complex orchestrated sequence of events, a model of V(D)J recombination was recently published, hypothesizing that all of these regulatory features (chromatin remodelling complexes, RAG, transcription factors and repair machinery) were localized in a single sub-nuclear compartment known as a “V(D)J factory”, having RAG as a
Screening for RAG activity in haematopoietic tumours using a novel reporter strategy nucleating agent30. This nuclear configuration would facilitate the alterations of the
chromosome architecture, allelic pairing, V(D)J segment sub-nuclear repositioning, 12/23 long-range RSS assembly, all due to a more efficient coupling of events and a more regulated environment.
1.3. RAG
The organization of the RAG locus is not common, since both genes are located close to each other (separated by approximately 8kb), contain single large coding exons, and are convergently transcribed. This organization, as well as RAG’s ability to potentially induce a transposition-like reaction during V(D)J recombination, was the starting point for RAG’s evolutionary hypothesis as having been originated from a transposition event43 (mentioned in
1.1.).
The murine RAG proteins have 1040 (RAG1) and 527 (RAG2) residues each. Core RAG1 bears the binding domains required for activity: a heptamer and a nonamer binding domain (recently confirmed by crystal structure to bind the nonamer44) which bind the RSS,
and a RAG2 binding site. Interestingly, the Zn ions found to bind core RAG-1 are determinant for RAG-cleavage activity45. Although it is not known if RAG2 has additional RSS binding
sites (since some RAG-2 mutants impair DNA binding46), it is accepted that, as RAG1, RAG2
holds domains that induce DNA cleavage and hairpin formation46, 47.
Paradoxically, RAG1 was demonstrated to be more promiscuous than previously thought, since it may bind non-RSS sequences. This effect is masked by the RAG2 protein, which was recently proved to avoid RAG1 mistargeting of RSS binding48. RAG2 was also
described as playing a role at enhancing RSS recognition, increasing RAG1 affinity for DNA by 20-fold49. The non-core RAG domain functions lie mainly on the C-terminal portion of
RAG250. This region suppresses RAG-induced transposition51 (mentioned in 1.3.2.), restricts
V(D)J recombination to the G0/G1 cell cycle stage and contains a PHD motif which recognizes H3 methylated histone (found in the V(D)J segments in enriched amounts at specific residues)31. Overall, RAG1 is currently seen has having the primary specific binding
and cleavage activities, with RAG2 and HMGB1/2 functioning as its cofactors. 1.3.1. Regulation of RAG expression
As previously referred in 1.2.1., regulation of RAG expression directly influences V(D)J recombination. The controlling mechanisms underlying RAG expression fluctuations during lymphocyte development are still not well understood. The regulation of the RAG locus by cis-acting elements and transcription factors in a lineage-specific manner52-54 does not fully explain this phenomenon. However, greater attention has been given to other regulatory mechanisms such as cell cycle signalling, which regulates RAG degradation at the
protein level55 and AR signalling53, 56 which, in turn, regulates RAG transcription levels.
Additionally, it was thought that the RAG locus was controlled in a similar way to the AR loci, i.e. that it was meant to be closed unless an instructive environmental signal induced chromatin opening (such as cis-acting elements or transcription factors). Nevertheless, it was not until recently that a new finding provided the hint that the locus is exposed: NWC, a third evolutionarily conserved gene located within the RAG locus, was found to be ubiquitously expressed and controlled by the intragenic RAG2 promoter. Moreover, the exception was observed in immature and B/T mature lymphocytes in which its expression was driven by the RAG1 promoter, transcribed as a RAG1-NWC hybrid mRNA, therefore possibly representing a natural antisense transcript for RAG2 and consequently regulating RAG expression in a lineage-restricted and time-dependent manner57
It is also thought that receptor editing requires regulation of the RAG locus in immature B lymphocytes; although it is an unresolved issue, some claim mature B lymphocytes re-acquire RAG expression and undergo receptor editing too.
RAG expression pattern during haematopoiesis remains controversial. There is evidence showing that RAG is expressed at earlier stages of haematopoietic development, prior to lymphoid commitment58. Furthermore, occasional V(D)J rearrangements have been
observed in dendritic cells59, 60, suggesting that RAG activity it is not restricted to the
lymphoid haematopoietic compartment. 1.3.2. RAG and genomic instability
The genomic instability elicited by RAG during V(D)J recombination can be seen as the counterpart of the immune system’s physiology. However, that counterpart is astonishingly probable: taking place on a daily basis, RAG induces loads of targeted DSBs waiting to be repaired in an adequate manner within the lymphocyte population. Due to this demanding task of accurately remodelling the genome, V(D)J recombination has been seen as “a disaster waiting to happen”61. Oddly, RAG-mediated genomic instability events seem to
rarely trigger oncogenesis in a lifetime. It is thought that the cell’s protective regulatory properties and their influence on cell proliferation may be the reason 19.
Sequences similar to RSSs, cryptic RSSs (cRSSs), are predicted to exist throughout the genome62, originated by chance or due to evolutionary mechanisms63. They usually bear
conserved heptamer and nonamer motifs, which flank a 12- or 23-spacer-like sequence. Although some nucleotide positions are more required than others, all of these regions may vary in nucleotide composition. In the human genome, the predicted number of cRSSs is controversial: Lewis et al. prediction reaches 10 million62 whereas the in silico prediction from
Cowel et al. states it is ten-fold less63. Some of these cRSSs are functional substrates for RAG. Therefore, RAG has also been named “promiscuous transposase”19. Currently, three
Screening for RAG activity in haematopoietic tumours using a novel reporter strategy
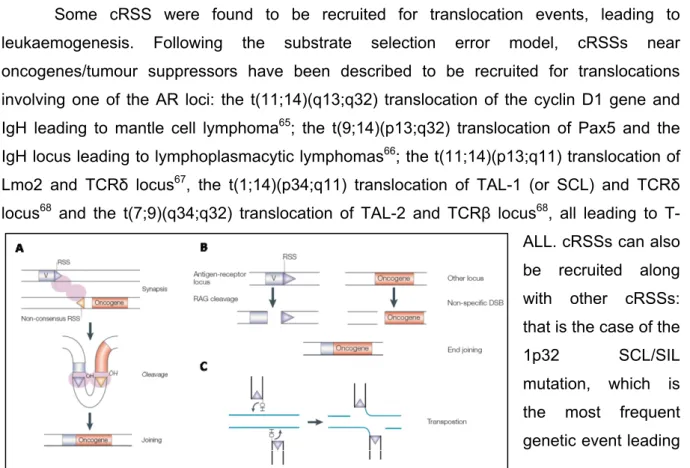
Figure 2. Models of RAG illegitimate activity. A. Substrate selection error model; B. End-donation
model; C. Transposition model. Triangles represent RSSs, blue rectangles represent AR gene segments and red rectangles represent an oncogene. In Roth et al. 2003
models of RAG’s illegitimate activity have been proposed19: the substrate selection error
model (Fig.2 A), involving rearrangements between a RSS and a cRSS or two cRSSs; the end-donation model (Fig.2 B), in which the rearrangements involve a RSS and a DSB with a RAG-independent origin; the transposition model10 (Fig.2 C), which occurs in the frame of a
legitimate reaction, in which by extending the half-life of the excised fragments, RAG drives a transposition reaction and fragment reinsertion. In all three types of events, the resulting configuration of the DNA sequence serves as a rearrangement signature of the event that took place. These signatures turned out to be extremely useful when studying RAG activity outside the lymphoid compartment and/or its improper activity in pathological conditions (as being associated to oncogenesis). All of these three phenomena may trigger oncogenesis in several ways (for example, bringing an oncogene in proximity to a strong promoter or enhancer, truncating a tumour suppressor protein or shifting the DNA sequence of a tumour suppressor gene out of frame).
Haematopoietic malignancies display a very high incidence of chromosomal aberrations and the mechanisms underlying this genomic instability are still under intense scrutiny. Regarding lymphoid leukaemias, it has been shown that, in some T-cell Acute Lymphoblastic Leukaemias (T-ALL), RAG expression persists and is found in T cell maturation stages normally devoided of RAG activity64.
Some cRSS were found to be recruited for translocation events, leading to leukaemogenesis. Following the substrate selection error model, cRSSs near oncogenes/tumour suppressors have been described to be recruited for translocations involving one of the AR loci: the t(11;14)(q13;q32) translocation of the cyclin D1 gene and IgH leading to mantle cell lymphoma65; the t(9;14)(p13;q32) translocation of Pax5 and the
IgH locus leading to lymphoplasmacytic lymphomas66; the t(11;14)(p13;q11) translocation of
Lmo2 and TCRδ locus67, the t(1;14)(p34;q11) translocation of TAL-1 (or SCL) and TCRδ
locus68 and the t(7;9)(q34;q32) translocation of TAL-2 and TCRβ locus68, all leading to
T-ALL. cRSSs can also be recruited along with other cRSSs: that is the case of the
1p32 SCL/SIL mutation, which is the most frequent genetic event leading
Figure 3. Representation of a number of existing RAG activity reporters. (not to scale) ampR –
ampicillin resistance gene; P-promoter; STOP – STOP codon; CAT- chloramphenicol acetyl transferase; LTR – long terminal repeat; Vk, Jk – coding segments of the Igk locus; neoR – neomycin resistance gene; gpt – guanine-xantine phosphoribosyl transferase gene; lacZ – β-galactosidase gene; VEX – GFP-variant gene; EGFP – GFP-variant gene; open and closed triangles represent 12- and 23-RSSs, respectively.
to T-ALL, in which a 100kb is deleted69.
RAG expression and rearrangement signatures have been described in haematopoietic malignancies with a myeloid phenotype, such as Acute Promyelocytic Leukaemia (APL)70 and Acute Myeloid Leukaemia (AML)71, 72. Little is known about RAG’s
influence in solid tumourigenesis. However, an isoform of the EGF receptor (EGFRvIII) is generated in the brain through internal deletion mutations on specific exons. Since the gene is flanked by cRSSs it was suggested to be rearranged by a RAG-mediated event, leading to gliomas73.
1.3.3. Quantification of RAG activity
Several molecular reporters have been developed in order to understand the biochemical21 and physiological74 features of RAG activity (Fig.3). Extrachromosomal
classical reporters, such as pJH290 served as molecular tools for RAG activity standardization measurements (Fig.3 A, 21, 75). The assessment of RAG efficiency of
recombination was very laborious and time-consuming since it required cell transfection, cell lysis, fragment digestion and purification for further transformation into bacteria. The final readout of the number of recombined molecules was provided either through the ratio of different antibiotic-resistant colonies or through PCR profiles. Moreover, the in vitro assays involved high amounts of biological material and intricate multi-step procedures21. This
caveat has been later tackled through the use of integrated recombination substrates76 (built
onto a retroviral backbone, Fig.3 B, C). Retroviral strategies are critical as they enable the targeting of poorly transfectable cells and the delivery of a stable integrated, more physiologic
Screening for RAG activity in haematopoietic tumours using a novel reporter strategy reporter substrate. Although the in vitro assay’s readout system has been improved over the years, through the use of reporters bearing genes that codify for fluorescent proteins detectable by flow cytometry (Fig.3 D, E,77), the detection still requires secondary steps76, 77,
such as enzymatic reactions or antibody stainings.
Through the use of these valuable molecular tools, quantification of RAG activity has been the vehicle for studying the influence of RSS sequence composition on RAG interaction not only with the V(D)J loci, dictating the diversity of the AR repertoire78, but also with the whole genome, where cRSSs exist and appear to participate in tumourigenesis19. The RSS
degeneracy allows for a not so nucleotide-restricted action of RAG: even some V(D)J loci RSSs exhibit variations in the most conserved nucleotide positions (for example in the nonamer or heptamer). Moreover, the synergistic effects of different nucleotide positions spread throughout the RSS are not completely understood, which may also be an influencing factor on RAG’s activity.
The first approach to RSS analysis was made by using a linear nucleotide comparison, i.e., the variation of single nucleotides at each position to find their individual importance. Simultaneously, the concept of consensus RSS (herein referred as “Cons”) appeared as the sequence that better depicts the average physiological efficiency of recombination of the RSSs found in the AR loci59. Recently, Kelsoe’s laboratory classified
RSSs according to an algorithm that accounts for the RSS’ nucleotide relative positional information and estimates its probability of occurrence in the population of mouse RSSs. By examining the nucleotide relationships within a given DNA sequence, the algorithm produces a RSS information content (the RIC score79) which is the sequence’s theoretical
recombination potential. The criterion of functionality for 12-RSS was established to be ≥-40, whereas for 23-RSS it was ≥-60. This in silico method defined a different consensus RSS (herein referred as “ConK”) as the most conserved 23-spacer (which does not exist in nature), as well as an ideal 23-spacer (“spaMI”) defined as having the most frequent nucleotide correlations and differing at five nucleotide positions from ConK (one single and two doublet mutations, named as “(MI)G4”, “(MI)G14/15” and “(MI)C19/20”, respectively)78.
spaMI was later found to exist in V(D)J loci mouse RSSs (near gene and pseudogene VH
segments at the IgH locus). spaMI was not associated with consensus heptamer and nonamer but with a low-efficiency non-consensus nonamer, composed of a 5’CAG motif (“CAGnon”). The authors progressed to dissect the contribution of different 23-RSS spacers to the recombination reaction78, by determining the in vitro efficiency of recombination associated with this set of spacers and respective point-mutated sequences in the context of a consensus heptamer and nonamer (Table I, App.), using a slightly modified version of the classical pJH290 excision reporter system (Fig.3 A, 75), the p290T, and a modified in vitro
Figure 4. The GFPi reporter. A. Linear representation of the MSCV-IRES-mRFP retroviral region
(not to scale); B. MSCV-GFPi-IRES-mRFP structure (not to scale); C. The resulting GFPi structure in the presence of RAG activity D. GFPi in vitro recombination assay was performed in the presence (R1/R2) or absence (mock) of RAG activity: Left, GFP/RFP flow cytometry dot plot analysis of 293T cells (representative experiment); right, bar graph with the average ER (n=8, t-test P value < 0.0001).
recombination assay (IVRA), by electroporation of murine pre-B cells which bear endogenous RAG activity.
1.3.3.1. The GFPi reporter
Our laboratory has generated a RAG activity reporter based on the murine stem cell-retroviral backbone, the MSCV vector80. The MSCV-mRFP version (L. M. Sarmento,
unpublished) was generated by replacement of the Green Fluorescence Protein (GFP) in MSCV-GFP80 by the monomeric Red Fluorescence Protein (mRFP1) gene81. The MSCV contains two long terminal repeats – LTRs – placed at both ends; the 5’LTR contains the viral promoter and is followed by a restriction multiple cloning site (MCS). Next, an internal ribosomal entry site (IRES) followed by the mRFP gene enables the direct detection of transfected or retroviral-infected cells, as mRFP positive, allowing for the expression of the bicistronic transcript encompassing the coding sequence cloned in the MCS, along with the mRFP marker (Fig.4 A).
The RAG reporter structure was cloned into the MCS of the MSCV-mRFP (Fig.4 B). It comprises an inverted GFP sequence, flanked by two RSSs, a 12- and a 23-spacer RSS, positioned, respectively, at the 5’ and 3’ ends of the inverted GFP. The RSSs are both oriented 5’ to 3’ (heptamer to nonamer orientation) and their nucleotide composition was defined according to the consensus sequences (Cons) used in the classical pJH290 reporter21. Therefore, this particular plasmid was named “GFPi-Cons”. The structural relation between the RSSs and their orientation determines that their recognition will lead to an inversion instead of an excision reaction18. The delivery of this reporter into cells will first render them mRFP positive. The presence of RAG activity will result in the inversion of the
Screening for RAG activity in haematopoietic tumours using a novel reporter strategy
GFP coding sequence and the acquisition of the GFP fluorescence (Fig.4 C). This reporter
construct can be used as an extrachromosomal substrate, in an in vitro recombination assay (IVRA), by direct transfection, or used to produce retroviral particles to infect primary cells and measure RAG activity in vivo.
Preliminary experiments have confirmed the functionality of the GFPi reporter. The GFPi reporter was used to measure RAG activity in an IVRA adapted from Hesse et al21. As
shown in Fig.4 D, in the absence of RAG, expression of GFP was not detected in the mRFP positive population, whereas in the presence of RAG1 and RAG2, an average of 1,94% (and a standard deviation of 0,43) mRFP positive cells were GFP positive. The efficiency of RAG activity was defined as “efficiency of recombination” or “ER”, corresponding to the frequency of GFP positive cells detected in the mRFP positive population.
2. AIMS OF THE PROJECT
In spite of the breakthrough of applying molecular reporters to study V(D)J recombination and RAG-mediated genomic instability, so far, no reporter has gathered the retroviral reporter structure with a direct and simple method of readout. In this work, we aimed at establishing a novel retroviral-fluorescent reporter of RAG activity by optimizing the detection of RAG activity (4.1.) and proving the reporter’s sensitivity to RSS sequence degeneration (4.2.). With this new tool, we aimed at assessing the functionality of a set of cRSSs known to be involved in leukaemogenesis (4.3., 4.4.) and characterize, qualitatively and quantitatively, the presence of endogenous RAG activity in human leukaemic tumour cell lines (4.5.).
3. MATERIALS AND METHODS 3.1. Cell culture
HEK (human embryonic kidney fibroblasts) 293T cells (4.1., 4.2., 4.3. and 4.4.) and 3T3 fibroblasts (4.5.) were cultured in DMEM82 media (GIBCO) supplemented with Fetal Calf
Serum 10%, Sodium Pyruvate 1%, L-Glutamine 1%, PenStrep 1% (Invitrogen), at a temperature of 37ºC and 5% CO2 conditions. The cells were harvested, washed and
re-seeded at low density every two to three days.
HL-60 ,SUPT1, Nalm6, Jurkat, Reh and K562 tumour cell lines (4.5.) were cultured in RPMI Glutamax media (GIBCO) supplemented with Fetal Calf Serum 10%, Sodium Pyruvate 1%, PenStrep 1% , at a temperature of 37ºC and 5% CO2 conditions. The cells were
maintained at a concentration of 0,25 x 10⁶ cells/mL. As so, cells were washed and
re-seeded every two to three days and purged from dead cells by Ficoll (Pharmacia) gradient when necessary.
3.2. In Vitro Recombination Assay (IVRA)
The IVRA protocol was adapted from Hesse et al21. Briefly, in 4.1., 4.2., 4.3. and 4.4.,
0,5 x 10⁶ HEK 293T cells were seeded in a 6-well plate well in 2,5 mL of media. After 24
hours, cells were co-transfected by replacing 600 L of media by a transfection mix containing 10 μL of Lipofectamine2000 (Invitrogen), 600μL of Optimem and a total of 10μg of pDNA: with 10μg of mock plasmid DNA or with 5μg of GFPi (or a GFPi-derived plasmid) and 5 g of mock plasmid (negative control) or 2,5μg of H2K-RAG1 plus 2,5μg of H2K-RAG2 (H2k assay) or 1,6g of pCMV-RAG1 plus 1,4g of pCMV-RAG2 plus 2g of mock plasmid (equimolar CMV assay). After 16 hours of incubation (over-night) in transfection mix-containing media, cultures were washed with fresh media. The cells were further cultured for 48 hours, harvested, and analysed by flow cytometry for GFP and mRFP fluorescence detection at the single cell level. Variations to the protocol are indicated in figure legends or results.
3.3. Statistical analyses
In 4.1., 4.2. 4.3. and 4.4., to every type of IVRA, an average and a standard deviation of ER were determined for each independent experiment, by pooling the replicates. When pooling experiments, the background average value was subtracted [corresponding to the (-) GFPi negative control] and the standard deviation was found by the formula SDfinal =
. When comparing groups of data, a non-parametric t-test was applied using the GraphPrism software. Whenever necessary, a Welch correction added.
3.4. Flow cytometry analyses
In 4.1., 4.2., 4.3., 4.4. and 4.5., flow cytometry data were acquired in MoFlo (RFP was measured on channel 7 (FL7) with a Krypton Crystal Laser CL-2000 Dioded 561nm Yellow Laser and a filter pass D630/75; GFP was measured on channel 1 (FL1) with an Argon Sapphire-200mV 488nm Blue Laser, with D530/40 filter pass). Data was further analysed using the Flowjo software. In 4.5., flow cytometry data were also aquired in FACS Calibur in order to calculate viral titers, respectively (GFP was measured on channel 1 (FL1) with a 15mW SPECTRA-PHYSICS Aircooled 488nm laser). Data was further analysed using the CellQuest software.
3.5. Immunoblot analysis
In 4.1., HEK 293T cells were transfected with equimolar amounts of H2K-RAG1 or CMV-RAG1 or H2K-RAG2 or CMV-RAG2, cultured for 36 hours, after which the cells were lysed and protein extracts run in a SDS-PAGE. Separated proteins were transferred onto a nitrocellulose membrane, and probed with antibodies anti-RAG1 (rabbit polyclonal diluted
Screening for RAG activity in haematopoietic tumours using a novel reporter strategy 1:100 or 1:500, K-20 SantaCruz) or anti-RAG2 (rabbit polyclonal diluted 1:50 or 1:500, M-300 SantaCruz) antibodies followed by the secondary anti-rabbit-HRP antibody (Thermo Scientific) probing. For the internal controls, the primary antibodies used were anti-α-tubulin (mouse monoclonal, diluted 1:500 or 1:1000, SIGMA) and anti-β-actin (goat polyclonal, diluted 1:1000 or 1:2000, C-19 SantaCruz) and the secondary were anti-mouse-HRP (Thermo Scientific) and anti-goat-HRP (Pierce), respectively. Immunoblot washes and incubations were performed in Tris-Buffer-Saline supplemented with 0.1% Tween-20. Detection was performed using the Thermo Scientific Pierce Fast Western Blot Kit and ECL Substrate chemioluminescent kit (Thermo Fisher). Prior to re-probing, membranes were subjected to a stripping solution of 0,0625M Tris-HCl pH6.8, 2% SDS, 1/100 (v/v) -mercaptoethanol and incubated at 56ºC for one hour.
3.6. Molecular cloning 3.6.1. CMV-RAG Cloning
In 4.1. CMV-RAG1 was obtained by excising a 4.7Kb fragment from a Bluescript pKS-RAG1 plasmid (L. Sarmento), comprising the RAG2 5’ mini-exon and the pKS-RAG1 coding sequence, through the use of XhoI/NotI restriction enzymes (NEB). This fragment was further ligated to a previously processed 3.6Kb pCMVβ vector (Invitrogen) cut by NotI and XhoI (NEB). Likewise, CMV-RAG2 was obtained by excising a 2.4Kb fragment containing RAG2 5’ mini-exon and RAG2 coding sequence with SalI/AseI (NEB) restriction enzymes. As the AseI site disrupted the TAA stop codon contained in the 3’ region of RAG2 coding sequence, the
AseI end was filled-in with Klenow (NEB) prior to SalI digestion. Likewise, the 3.6Kb recipient
vector pCMVβ was also cut by NotI followed by fill-in with Klenow and further digestion with
XhoI resulting in a XhoI/NotI(Klenow)-ended fragment allowing for TAG stop codon
reconstitution upon ligation with the RAG2 fragment.
CMV-RAG1 was obtained by excising a 4.7Kb fragment from an intermediate Bluescript pKS plasmid, used in the above H2k-RAG1 cloning, comprising RAG1 5’ mini-exon and RAG1 coding sequence, through the use of XhoI/NotI restriction enzymes (NEB). This fragment was further ligated to a previously processed 3.6Kb pCMVβ vector (Invitrogen) cut by EcorV (NEB) followed by NotI and XhoI, generating RAG1. Likewise, CMV-RAG2 was obtained by excising a 2.4Kb fragment containing CMV-RAG2 5’ mini-exon and CMV-RAG2 coding sequence with SalI/AseI (NEB) restriction enzymes. As the AseI site disrupted the TAA stop codon contained in the 3’ region of RAG2 coding sequence, this fragment was further processed by Klenow (NEB), as well as the 3.6Kb recipient vector pCMVβ, which was also cut by NotI, processed by Klenow and further cut by XhoI resulting in a
XhoI/NotI(Klenow)-ended fragment allowing for TAG stop codon reconstitution and
3.6.2. GFPi-Cons Cloning
In 4.1., The GFPi-Cons reporter was generated by PCR with the use of specific primers, a plasmid containing the GFP gene as a template (MSCV-GFP) and Pfu polymerase (Promega). The core of this strategy relied on the PCR primers’ design. As an example, an expected sequence of the GFPi-Cons PCR product is depicted in Fig.III and the respective primers used in Table I, both in Appendix I (App.).
Left to right (5’ to 3’), this sequence displays a XhoI restriction site, a 5’ to 3’ consensus 12-RSS, the reverse complementary sequence of a Kozak-GFP fusion, a 5’ to 3’ consensus 23-RSS and a SmaI site. The regions used for primers’ design are underlined and at least 20 nucleotides for GFP hybridization were included.
The fragment was further submitted to a Taq polymerase (Invitrogen) poly(A)-tail extension in order to allow for their ligation to the intermediate vector pGEM-Teasy (Promega). This vector was further amplified in Escherichia coli, and the selected clones were used to extract the final XhoI/SmaI fragments to be ligated to the MSCV-mRFP vector previously digested with XhoI and HpaI, generating GFPi-Cons (Sarmento, unpublished). The final vector was sequenced for fragment confirmation at the IGC Sequencing Facility. 3.6.3. GFPi-23-RSS reporters Cloning
In 4.2., GFPi-ConK, GFPi-spaMI, GFPi-(MI)G4, GFPi-(MI)G14/15, GFPi-(MI)C19/20 and GFPi-spaMI-CAGnon fragments were cloned using the exact same methodology as in 3.6.2., with the exception of the reverse primer oligonucleotide used for each 23-RSS reporter cloning. The 12-RSS forward primer was used in all PCR reactions and its sequence is an exact match of that underlined in Fig. III (App.). Table I (App.) lists the 23-RSS sequences contained on each GFPi-reporter and the respectively designed reverse primers. 3.6.4. GFPi-cRSS reporters Cloning
In 4.3. and 4.4., GFPi-VH, GFPi-Jβ, GFPi-Lmo2, GFPi-SCL and GFPi-PTEN reporter
versions were originated using the exact same methodology as in 3.6.2., with the exception of the reverse primer oligonucleotide used for each 12-RSS reporter cloning. Table II (App.) lists the 12-RSS and cRSS sequences used in this work, as well as their respective primer sequences.
3.7. Viral production and titers
In 4.5., the viral production was adapted by Naldini et al. Briefly, 2 x 10⁶ HEK 293T
cells were seeded on a pre-coated Poly-L-Lysine (SIGMA) 20cm2 6cm-diameter dish in 5 mL
of media and incubated for 24 hours. For viral production, cells were co-transfected for 16hours in 4 mL of media using the calcium phosphate method with 5g of pKAT retroviral packaging vector, 5g of pCMV-VSV-G envelope glycoprotein encoding plasmid and 10g of
Screening for RAG activity in haematopoietic tumours using a novel reporter strategy MSCV-GFPinv in a 1 mL transfection mix containing 0.165M CaCl2 in
Hydrogen-Phosphate-Buffer-Saline (HBS with 0.75mM Na2HPO4, 140mM NaCl, 5mM KCl and 6mM Dextrose).
Transfections were concluded by replacing the transfection media by 3mL of fresh media supplemented with HEPES 20mM for viral harvesting. Virus-containing media were collected, filtered with 0,45 filters at 24, 48 and 72h post-transfection conclusion.
Viral titers were estimated by using virus volumes (V.Vol) of 100μL or 200μL of 24, 48 or 72h stocks to infect 1x10⁵ 3T3 fibroblasts (pre-seeded 24 hours prior at 0,5x10⁵/condition)
in the presence of 8g/mL of Polybrene (Hexadimethrine bromide, SIGMA) by spin-infection at 2500 rpm, 30 min., RT. Frequencies of infection (FI) were determined by measuring the cells positive for the IRES-coupled fluorescence by flow cytometry 4 to 5 days after infection. The viral titer (VT) was calculated with FIs equal or lower than 0,5 since the n. of infectious particles (IP) is directly proportional to the number of cells (NC) when Multiplicity Of Infection (MOI) is equal or lower than 1 and considering that a retroviral infection carried out with a MOI of 1, i.e n. infectious particles (IP) = n. cells (NC), gives rise to a FI of 0,5. Therefore VT (IP /mL) = [FI x NC x (1/V.Vol)
]
/0,5 . The viral titers obtained were 1-2x10⁶ IP /mL.3.8. Cell line infections
In 4.5., 1 x 10⁵ cells of HL-60, K-562, SUPT1, Jurkat, NALM-6 and Reh tumour cell lines were infected on a previously retronectin-coated (5μg/cm2, TaKara) 2cm2 well-plate.
Viral suspensions of MSCV-mRFP or MSCV-GFPi were added at a MOI 5:1 and the cells were centrifuged for 2,5h at 2500rmp RT. Polybrene (Hexadimethrine bromide, SIGMA) was added in a concentration of 4μg/mL in order to facilitate viral adhesion. 24 hours later, the cells were submitted to a second round of infection in the exact same conditions.
4. RESULTS
4.1. Optimization of the GFPi IVRA
The efficiency of RAG activity detected in the preliminary GFPi in vitro experiment (ER = 1,94% ± 0,43) is lower than that described when using other reporters bearing the same consensus RSSs63. This could be either due to the presence of inhibitory nucleotide
sequences flanking the reporter cassette (in the MSCV-mRFP vector) and/or to suboptimal levels of RAG expression when using the Major-Histocompatibility-Class I (MHC-I) promoter, named H2K, present in the RAG expression plasmids used (H2k-RAG). To address this issue, we subcloned RAG1 and RAG2 coding sequences under the control of the CMV promoter to test the ER of GFPi-Cons by IVRA in a context of RAG overexpression. Firstly, H2k and CMV-driven RAG protein levels were compared by immunoblot analysis of 293T cells transfected with equimolar amounts of H2k-RAG1 or CMV-RAG1 (Fig.IV A and B,
Figure 5. Representative flow cytometry analysis of control (-) GFPi-Cons (left), H2k-RAG GFPi IVRA (middle) and CMV-RAG GFPi IVRA (right). Events were gated on RFP+ (x axis) and GFP+ (y axis); the frequency of double-positive events (ER) average and standard deviation is
highlighted in bold; n=3 replicates of one independent experiment.
App.), or H2k-RAG2 or CMV-RAG2 (Fig.IV C and D, App.). Since we have found a remarkable difference between H2k-RAG and CMV-RAG protein levels, we optimized the detection in order to better determine such different levels. CMV-RAG1 and RAG2 were successfully detected when titrating cell extracts to half, 1/5 and 1/10 of their original concentrations and using standard antibody concentrations (Fig.IV A and C, App.). Conversely, H2k-RAG1 and RAG2 were detected by doubling the amount of loaded cell extracts and using a higher antibody concentration, allowing for a comparison between H2K and CMV-driven expression (Fig.IV B and D, App.). Overall, this analysis indicates that
CMV-driven expression of RAG gives rise to at least 10 to 20-fold more protein than the H2k promoter.
Subsequently, CMV-RAG1 and CMV-RAG2 were used in an IVRA, along with the GFPi-Cons reporter, in equimolar amounts to H2k-RAG (Fig.5). CMV-RAG exhibited a 20-fold higher ER than H2k-RAG (60,85 ± 1,75 vs. 3,01% ± 1,01; n=9). This efficiency greatly exceeds the average of 4-6% described in the literature when using pJH29063, 78, which
measures the number of recombined substrate molecules. Detailed analysis of recombination in the RFP+ population, bearing the maximum number of reporters per cell and
which display maximum efficiency of recombination (MIFRFP=150), shows that CMV-RAG
expression, when compared to H2k-RAG, not only generates 10-fold higher frequency of GFP+ cells (95,92 ± 0,39 vs 8,49 ± 2,22) but also 10-fold higher number of recombined
substrates in average per cell, represented by the value of the mean intensity of GFP fluorescence (MIFGFP, 1145,12 ± 120,52 vs 88,75 ± 9,89). This data shows that the new GFPi
reporter is a competent substrate for RAG activity and that the designed IVRA, either using H2k-RAG or CMV-RAG, provides a broader window for quantitation of RAG activity.
We next sought to understand whether various baseline levels of recombination could be obtained when using the GFPi-Cons reporter along with the CMV-RAG expression system. We aimed at defining the assay that better allowed observing increasing or decreasing differences between different GFPi constructs. To that aim, we titrated down the amounts of CMV-RAG plasmids used along with GFPi-Cons in the cell transfection and proceed to determine RAG activity. Progressive 2-fold decreases in CMV-RAG plasmid
Screening for RAG activity in haematopoietic tumours using a novel reporter strategy
Figure 6. Efficiency of recombination values for GFPi-Cons upon CMV-RAG plasmid titration in IVRAs. CMV-RAG1 and CMV-RAG2 expression
plasmids were titrated down by half from 1,4μg and 1,6 μg (CMV-RAG) to 0,175 μg and 0,2 μg (0,0625x CMV-RAG), respectively; one to two independent experiments, each with n=3 replicates; ER = Efficiency of Recombination.
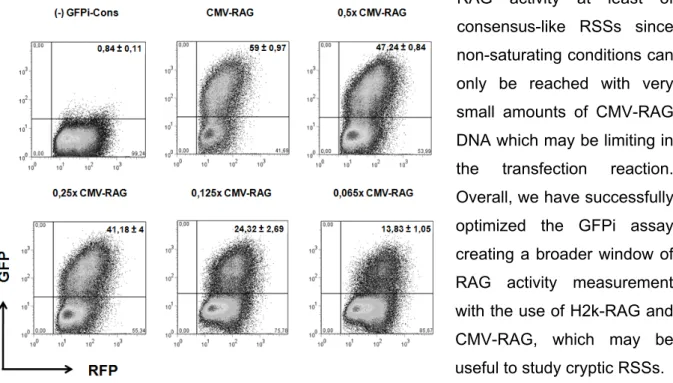
Figure 7. Representative flow cytometry analysis of successive CMV-RAG GFPi IVRAs with decreasing titrated levels of RAG plasmid amounts. GFPi-Cons IVRA in absence of
CMV-RAG was used as a negative control (upper left); CMV-CMV-RAG1 and CMV-CMV-RAG2 expression plasmids were titrated down by half from 1,4μg and 1,6 μg (RAG) to 0,175 μg and 0,2 μg (0,0625x CMV-RAG), respectively; events were gated on RFP+ (x axis) and GFP+ (y axis); the frequency of
double-positive events (ER) average and standard deviation is highlighted in bold; n=3 replicates of one independent experiment.
amounts, from 1,4-1,6 g to 0,175-0,2 g, did not correlate with significant differences in ER or with differences proportional to the plasmid reduction (Fig.6, Fig.7).
This observation suggested that CMV-RAG plasmid amounts express levels of protein which approach functional saturation. This conclusion is also supported by the ER values obtained for high amounts of substrate which reach 91-97% for a RFP Mean Intensity of Fluorescence (MIFRFP) around 150 and 400 (data
not shown).
Therefore, we propose that the CMV-RAG GFPi assay cannot be used to compare RAG activity at least of consensus-like RSSs since non-saturating conditions can only be reached with very small amounts of CMV-RAG DNA which may be limiting in the transfection reaction. Overall, we have successfully optimized the GFPi assay creating a broader window of RAG activity measurement with the use of H2k-RAG and CMV-RAG, which may be useful to study cryptic RSSs.
4.2. GFPi sensitivity to 23-RSS sequence degeneration
We aimed at determining whether the GFPi reporter was able to provide a fine quantitation of RAG activity in vitro, paralleling the pJH290 system. As so, Kelsoe and
A
B
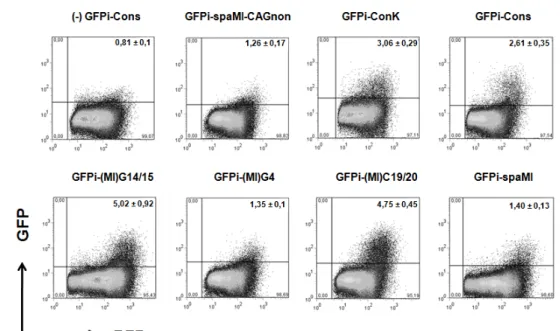
Figure 8. p290T and H2k-RAG GFPi 23-RSS reporters’ ERs. A. Graphical representation of
Kelsoe and colleagues p290T-23-RSS reporters IVRA results78 B. GFPi-23-RSS reporters IVRAs using H2k-RAG plasmids; two to three pooled independent experiments each with n=3 replicates; ER = Efficiency of Recombination.
colleagues’ RSS analysis was here reproduced by using the GFPi reporter. Six variations to the Cons reporter were generated (ConK, spaMI, (MI)G4, GFPi-(MI)G14/15, GFPi-(MI)C19/20 and GFPi-spaMI-CAGnon), bearing the same 12-RSS but differing in the 23-RSS (as described in 78), and were further used in IVRAs for ER
determination.
Despite the high values of ER obtained with CMV-RAG in this work, we decided to use H2k-RAG to test the 23-RSSs due to the fact that some RSS sequences which were predicted to be highly efficient78 (eg. spaMI) would not be properly assessed in the saturating
conditions observed previously with GFPi-Cons.
As a first approach, the 23-RSSs were analysed with the RIC algorithm developed by Kelsoe et al.79; all tested 23-RSS sequences were predicted to be functional, since their
score was ≥-60 (Table III, App.).
When comparing the literature’s 23-RSS analysis in the p290T setup (Fig.8 A,78) to
the H2k-RAG GFPi setup (Fig.8 B, Fig.9), we find a narrower window of ER values in the case of H2k-RAG GFPi, which ranged from an ER of 0,32% to 5,89%, contrasting to p290T which ranged from 0% to 33,3%. Nevertheless, we also observed a remarkable difference between standard deviations of both assays: H2k-RAG GFPi exhibited ratios average/standard deviation ranging from 15% to 37% while p290T ranged from 18% to 100%. Since the data points of the literature’s experiment were not available, it was not
possible to compare the p290T and GFPi IVRA RAG activity measurements by using powerful statistical testing. Thus, we took a simple though suitable statistical approach: the fold difference coefficient calculation between ER values of 23-RSS pT290 and GFPi constructs. Fold-difference values were calculated for every set of two constructs, by dividing the respective ER values, either in the p290T (Table IV, App.) or the H2k-RAG GFPi assay (Table V, App.). These were then compared between the two assays, by calculating the respective coefficient value for every pair of constructs (Table VI, App.). If both assays were