Urban trees facilitate the establishment
of non-native forest insects
Manuela Branco1, Pedro Nunes1, Alain Roques2, Maria Rosário Fernandes1, Christophe Orazio3, Hervé Jactel4
1 Universidade de Lisboa, Instituto Superior de Agronomia, Centro de Estudos Florestais Tapada da Ajuda, 1349-017 Lisboa, Portugal 2 INRA Zoologie Forestière, Orléans, France 3 European Forest Institute – Planted Forests Facility. 69, Route d’Arcachon 33612 CESTAS, Bordeaux, France 4 INRA (French National Institute for Agricultural Research), UMR 1202 BIOGECO, University of Bordeaux, 33610 Cestas, France
Corresponding author: Manuela Branco ([email protected])
Academic editor: Jianghua Sun | Received 28 May 2019 | Accepted 9 September 2019 | Published 11 November 2019 Citation: Branco M, Nunes P, Roques A, Fernandes MR, Orazio C, Jactel H (2019) Urban trees facilitate the establishment of non-native forest insects. NeoBiota 52: 25–46. https://doi.org/10.3897/neobiota.52.36358
Abstract
Cities, due to the presence of ports and airports and the high diversity of trees in streets, parks, and gar-dens, may play an important role for the introduction of invasive forest pests. We hypothesize that areas of urban forest facilitate the establishment of non-native forest pests. Based on scientific literature and a pan-European database on non-native species feeding on woody plants, we analysed where the first detec-tions occurred in European countries. We collected site data for 137 first detecdetec-tions in Europe and 508 first European country-specific records. We also estimated the percentage of tree cover and suitable habitat (green areas with trees) in buffers around detection points. The large majority of first records (89% for first record in Europe and 88% for first records in a European country) were found in cities or suburban areas. Only 7% of the cases were in forests far from cities. The probability of occurrence decreased sharply with distance from the city. The probability to be detected in urban areas was higher for sap feeders, gall mak-ers, and seed or fruit feeders (>90%) than for bark and wood borers (81%). Detection sites in cities were highly diverse, including public parks, street trees, university campus, arboreta, zoos, and botanical gar-dens. The average proportion of suitable habitat was less than 10% in urban areas where the species were detected. Further, more than 72% of the cases occurred in sites with less than 20% of tree cover. Hotspots of first detection were identified along the coastal regions of the Mediterranean and Atlantic, and near industrial areas of central Europe. We conclude that urban trees are main facilitators for the establishment of non-native forest pests, and that cities should thus be intensely surveyed. Moreover, as urban areas are highly populated, the involvement of citizens is highly recommended.
Copyright Manuela Branco et al. This is an open access article distributed under the terms of the Creative Commons Attribution License (CC BY 4.0), which permits unrestricted use, distribution, and reproduction in any medium, provided the original author and source are credited.
Keywords
Cities, forest pests, invasive species, surveillance, urban trees
Introduction
Forests, like other terrestrial ecosystems, are increasingly threatened by the establish-ment and spread of non-native pests worldwide (Brockerhoff and Liebhold 2017). Some examples of forest invasive species with large distribution range are the Pine wood nematode, Bursaphelenchus xylophilus, causing the pine wilt disease in Asia (Ki-shi 1995; Robinet et al. 2009) and Europe (Sousa et al. 2001); the Emerald ash borer,
Agrilus planipennis, in North America (Herms and McCullough 2014); Anoplophora glabripennis which was introduced into North America and Europe (Carter et al. 2010;
Roques et al. 2010); the invasion of the USA by the gypsy moth, Lymantria dispar (Liebhold et al. 1992); or the increasing numbers of Eucalyptus pests established in all continents where eucalypts are grown in intensive plantations (Hurley et al. 2016).
The increase of forest pest invasions in recent years is mostly the consequence of in-creasing global trade and international travel (Brockerhoff et al. 2006a; Roques 2010). International trade has remarkably increased during the 20th century, with a rate of 7.1 percent per year between 1987 and 2007, and is still increasing (Constantinescu et al. 2015). As a result, the invasion rate continues to rise, with no sign of saturation (Seebens et al. 2017).
The main pathways for the accidental introduction of non-native forest insects are the trade of live trees for planting, hitchhiking with containers, imports of timber, and use of wood packaging material (Brockerhoff and Liebhold 2017), all of which are much more frequent than in the past. A common feature of these pathways is that they often converge to urban areas. Cities, in particular large cities, are close to international airports and seaports and thus are expected to be main gateways for the entry of new, non-native insect species. Cities are also more populated, attracting more and more goods every day. It is expected that by 2050, almost 70% of humanity will be living in urban areas. In Europe, where urbanization occurred earlier, 82% of people are already living in cities (United Nations 2018).
There is little doubt that urbanization and population concentration in large cit-ies are of critical importance for the arrival rate of invasive speccit-ies (Paap et al. 2017). However, whether the convergence of main invasion pathways towards cities will ultimately result in more introductions, and most importantly in the establishment of non-native forest insects, remains an open question. Indeed, the establishment of non-native forest insects in urban areas depends not only on the probability of arrival, but also on the presence and abundance of suitable host trees. If the introduced pest species needs only a small number of trees or small tree patches to become established, then urban trees, even if isolated in parks, gardens, or streets might provide a suitable
environment for their establishment. In addition, trees are more likely to be stressed in warmer (urban heat island effect) (Debbage and Shepherd 2015) and drier urban areas, making trees then more susceptible to non-native secondary pests like bark or longhorn beetles (Meineke et al. 2013; Chakraborty et al. 2014). Species originating from warm regions, e.g. the Neotropical region, could particularly benefit from these microclimatic conditions to invade cities in temperate, cooler regions.
Most cities usually harbor a relatively high diversity of tree species, dispersed in many urban parks and gardens. These could provide a larger number of putative hosts and, thus, increase the risk of non-native pest establishment (Liebhold et al. 2018). According to these assumptions, the higher diversity of host tree species observed in cities than on countryside would aid the establishment of forest insects of different functional traits, like voltinism and diet breadth (Brockerhoff and Lieb-hold 2017).
To test these hypotheses, we compared the rate of first detection in urban vs non-urban areas of invasive pests feeding on woody plants in Europe. We focused on this continent because it is among the most affected by forest pest invasions in the world, and we have very good records of non-native species detection in European countries (Roques et al. 2010). We also estimated the distance of detection locations to small and large cities. We further investigated the habitat requirements in urban areas for the establishment of non-native tree pests, particularly in relation to their feeding re-quirements. By identifying areas of higher risk of establishment, we provide relevant knowledge to improve the methods for early detection of non-native forest pests. This is crucial as the success of eradication mainly depends on the speed and accuracy of first detection (Liebhold et al. 2016).
Methods Data gathering
Data sources. We first used the pan-European database for non-native organisms,
DAISIE (Delivering Non-native Invasive Species Inventories for Europe) (Hulme
and Roy 2010), which provides historical invasion data at the country level for the species introduced to Europe after 1700. Since the data from the DAISIE database were recently updated in the EASIN catalogue (European Alien Species Information Network), which additionally provided year and country of first records of species in Europe (Katsanevakis et al. 2015; Roques et al. 2016; http://easin.jrc.ec.europa.eu), we finally used EASIN to select the non-native insect species affecting woody plants, i.e. trees and palms. The EPPO Global Database (https://gd.eppo.int/) was also used to search for new non-native insects recently arrived in Europe. The bibliographic databases Google Scholar and Science Direct were additionally used. We searched for literature using specific keywords to detect papers reporting first records of new species
feeding on trees in Europe. The combination of keywords was the following: (First record or Introduction) and (Pest or Insect or Emerging or Non-native or Invasive or Non-native) and (Forest or Tree) and (Europe or Austria, Belgium, Bulgaria, Croatia, Republic of Cyprus, Czech Republic, Denmark, Estonia, Finland, France, Germany, Greece, Hungary, Ireland, Italy, Latvia, Lithuania, Luxembourg, Malta, Netherlands, Poland, Portugal, Romania, Slovakia, Slovenia, Spain, Sweden, UK).
Criteria for data selection. Only insect species introduced in Europe since 1950 were considered because most of the forest non-native species in Europe were introduced in the last five decades (Roques 2011). Previous introductions were disregarded to avoid inac-curacies from ancient reports.
For each country, a unique first record was retrieved with the exception of a par-ticular species detected in geographically well separated regions of a given country (e.g. mainland and distant islands). A case study was thus defined as a new species detected in a new country for the first time. The same introduced species could be reported sev-eral times in Europe as long as it was successively recorded for the first time in different European countries. We further distinguished between first record in Europe and first records in any of the European regions as a given species could use the first introduc-tion as bridgehead for spreading through Europe, or be introduced several times in dif-ferent European regions. Rare cases where two difdif-ferent European countries reported the first detection in the same year were both accounted as first records in Europe.
Complementary data. For each case study (one species × one country × one date of first detection) we documented information regarding the insect species, and the time and location of first record. For each species we retrieved from the literature the order, family, feeding guild (Bark & wood borers, Defoliators, Sap suckers, Gall makers, Root feeders, Seed and fruit feeders), host range (Broadleaves, Conifers, Palms, Polypha-gous), and body length (mm). For each first detection we recorded the year of detec-tion, the geographical coordinates of the site, the type of habitat (Urban if reported in a city or suburban urbanized areas, Forests, Rural areas, or Nurseries), and the distance in km to the border of the nearest city (with at least 10 000 inhabitants) or large city (at least 100 000 inhabitants or with an international transport system, e.g. airport, seaport, railway station).
The site coordinates were retrieved from the reporting articles. In several cases, exact site coordinates were not available. When the description of the location was reliable and narrow enough to delimitate a location area (e.g. Lisbon Zoo, Nepliget Park in Budapest), its central point was used to recalculate site coordinates. For records that had inaccurate location but with some useful geographical information, e.g. “in the town of Rome” (Migliaccio and Zampetti 1989), we used their central point to estimate distance to the nearest city but we did not use them to estimate habitat and tree cover in their surroundings. Lastly, records that did not have a location precise enough to deduce any specific geographic information, e.g. “the Italian region of Lombardy”, were discarded.
The Euclidean (straight-line) distance between the detection location and the external limit of the nearest city and nearest large city were calculated using ArcGIS 10.5 (ESRI, Redlands, CA, USA). Cities were visually identified using ArcGIS Online World Imagery map (Copyright ESRI). The distances were then reclassified in distance classes (×10 km).
Hotspot analysis was performed with Getis-Ord GI* spatial statistics (Ord and Getis 1995) using the Spatial Statistics Tools of ArcGIS 10.5. Hotspot analysis is fre-quently used in biological invasion studies (Liang et al. 2014; Shaker et al. 2017), as it enables the detection of spatial clustering patterns using a landscape-scale ap-proach. Getis-Ord GI is an index used to evaluate spatial autocorrelation. Z-scores and P-values indicate whether features, like detection points, are significantly spatially clustered. For statistically significant positive z-scores, the larger the z-score, the greater the clustering of high values (hotspot); for significantly negative z-scores, the smaller the z-score, the greater the clustering of low values (coldspot). For this analysis, we used only the first records in Europe. We used the false discovery rate (FDR) method of Benjamini and Hochberg (1995) to determine the confidence levels of 80%, 90%, 95%, and 99% of their respective GI z-score. This method allows controlling for false discoveries, i.e., the Type I errors.
Population size of cities near detection points was retrieved from the online Wiki-pedia encycloWiki-pedia. For each detection point the population density, i.e. inhabitants per square kilometer, by NUTS 2 region (Nomenclature of Territorial Units for Statistics, level 2) was obtained from Eurostat ( https://ec.europa.eu/eurostat/web/products-data-sets/product?code=tgs00024, assessed on 2019-8-22). The year 2015 was used as refer-ence. We then estimated the ratio between the average population density in the NUTS 2 region where the detection point was located and the population density of the respective country. For the analysis, we considered countries with two or more NUTS 2 regions.
Forest cover and suitable habitat around the point of detection. The percentage of forest cover was estimated using the Tree Cover Density (TCD) of the Copernicus Land Monitoring Service – High Resolution Layer Forest (https://land.copernicus.eu/ pan-european/high-resolution-layers/forests/view, 2012). TCD provides continuous-scale information on the proportional crown coverage (0–100%) detected per pixel (20 m of spatial resolution) at the European scale, including the following Land Use – Land Cover (LULC) classes: evergreen and deciduous broadleaved, sclerophyllous and coniferous trees, orchards, olive groves, fruit and other tree plantations, agro-forestry areas, transitional woodlands, forests in regeneration, groups of trees within urban ar-eas. The percentage of forest cover was calculated in four buffers (100, 500, 1000, and 5000 m of radius) around the detection points with precise geographical coordinates. The Set Null function was used to remove the no-data values from the databases.
Complementarily, to test the hypothesis that the percentage of tree cover within 100 m around the detection point was similar to that of any other 100 m radius buffer in the surrounding area, we randomly created three additional 100 m radius sampling areas within the 5000 m buffer area. These sampling areas were generated with the
con-straints of its central point being at least 200 m far from the central detection point and 200 m far from the other two random sampled areas. Additionally, any randomly cre-ated central point that was loccre-ated in the ocean or inland water surface was manually removed and replaced. The tree cover around each of the three random central points was calculated in the same manner as around the central detection point.
To estimate the percentage cover of suitable habitats in large cities we used the Ur-ban Atlas database from 2012, from the Copernicus Land Monitoring Service (https:// land.copernicus.eu/local/urban-atlas). Urban Atlas delivers pan-European comparable LULC data for Functional Urban Areas, i.e. city and its commuting zone (OECD 2012) including 17 urban classes with a Minimum Mapping Unit (MMU) of 0.25 ha. For the selection of suitable habitats, we used as criterion the probable occurrence of trees and retained the following five LULC classes: Green Urban Areas, Sports and Leisure Facilities, Orchards, Forests, and Herbaceous vegetation associations. The per-centage of suitable habitats was calculated in three buffers (radius of 500 m, 1000 m, and 5000 m) around the detection points.
Statistical analyses
To estimate the probability of detection in function of the classes of distance to the nearest city we used generalized linear models (GLM) with Binomial distribution and log link function. A model was applied to each feeding guild separately. A Gaussian GLM with log link function was further used to test the effect of body size on the distance to the nearest small city and large city. We also used Gaussian GLM to test temporal trends in detection years and distance of the detection points to the nearest city and nearest large city.
Paired t-test statistic was used to compare the percentage tree cover in the 100, 500, 1000, and 5000 m radius buffer. Paired t-test statistic was also used to compare the percentage of tree cover in the buffer area (100 m radius) around the detection point and the mean percentage of tree cover in the three buffer areas (100 m radius) sampled at random within the same 5000 m buffer area. One-way ANOVA was used to compare the percentage of tree cover in the buffer area (100 m radius) per feeding guilds. The relationship between the average population density per NUTS 2 and the country population density was tested by paired t-test statistics.
Results
Number of first detection, and distribution in Europe, of non-native forest insects
We retrieved data from 133 non-native insect species, belonging to six feeding guilds. Sap feeders (order Hemiptera) were the most represented guild (40% of the cases), followed by bark beetles and woodborers (29%). Defoliators, gall mak-ers, and seed and fruit feeders represented 14%, 10%, and 7% respectively. Only
one species was a root feeder, which was not used for comparisons between feeding guilds due to its low representativeness.
In total 508 first country-specific records were retrieved, from 38 regions (includ-ing mainland and separated islands) and 25 countries (Suppl. material 1: Table S1). The top 10 non-native species most frequently detected were reported from 12 or more different countries: Belonochilus numenius, Cameraria ohridella, Corythucha
cil-iata, Cydalima perspectalis, Dasineura gleditchiae, Dryocosmus kuriphilus, Halyomorpha halys, Leptoglossus occidentalis, Metcalfa pruinosa, and Obolodiplosis robiniae. On the
other hand, 57 non-native species were reported in just one country. More than 87% of first detections resulted from occasional visual observations, mainly made by scien-tists, naturalists, or forest technicians. Only a few first reports (11%) mentioned that observations were due to planned survey or trapping. Three cases were interceptions in ports. They were excluded from spatial analysis.
From our data, 137 cases were first records for Europe (mainland and islands). Italy registered the highest number of first records in Europe (36), followed by Spain (19), France (18), and Portugal (10). Eight first detections were made in islands of the Mediterranean Sea (Sicily, Corsica, and Balearics) or the Atlantic Ocean (the Canar-ies, Madeira, and the Azores). UK and Germany had intermediate values of 8 and 7, respectively. All other cases were distributed among 19 other countries.
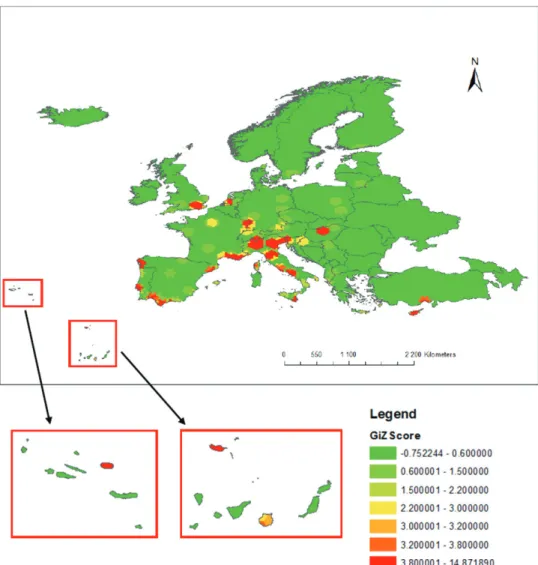
The hotspot analysis of first records in Europe revealed an uneven distribution at the European scale. Several hotspot areas with a Getis-Ord Gi* Z-score greater than 3.80 (p-value < 0.01) were identified in continental Europe (Fig. 1). The largest con-centration of hotspot clusters was located in coastal areas of the Mediterranean near large cites of Italy, southern France, Catalonia and Andalucía in Spain, and along the Atlantic coast, e.g. in Lisbon, Vigo in Galicia, Amsterdam, and London. Hotspots of first detection were also found around Switzerland (Zurich, Strasbourg, and Stuttgart) and in Hungary around Budapest. Hotspots also appeared in the islands of Corsica, Sicily, Cyprus, Madeira, the Azores, and the Canaries (Fig. 1).
Distance to nearest cities
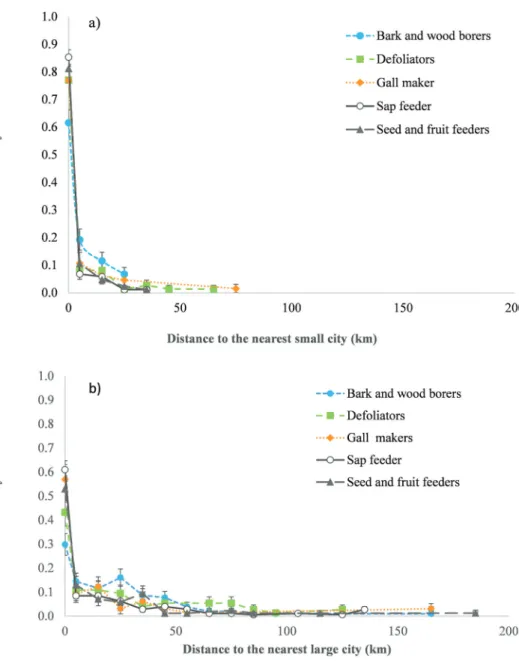
About 64% of first records in Europe occurred in large cities and 89% in cities or their suburban areas. Similarly, 62% of country specific detections were reported in large cities and 88% in cities or their suburban areas (i.e. within 10 km distance from their limit). The probability of first detection decreased sharply with distance from the nearest city or large city (Fig. 2). When fitting an exponential decline, the rate of decrease was on average (± SE) higher around small cities (−0.08 ± 0.016) compared with large cities (−0.02 ± 0.003). The probability of occurrence within the first two classes distances, i.e. within city (class 0) and up to 10 km distance (class 1), was 92 ± 2% for sap suckers and seed and fruit seeders, 88 ± 4.1% for gall makers, 85 ± 4.1% for defoliators and 82 ± 3.8% for bark & wood borers. Howev-er, differences between guilds were not significant (Wald Chi2 = 7.461, p = 0.113). Body size was not a significant predictor of the distance of first detection either
Figure 1. Hotspots map of first detection points in Europe of non-native insects feeding on woody plants, recorded since 1950. The Getis-Ord GI* (GiZ Scores) are provided to indicate different levels of clustering of either high values (Z-score positive, hotspot) or low values (Z-score negative, coldspot). The respective p-values are: Z Score > 3.8, p-value < 0.01; ZScore [3.2, 3.8], p-value < 0.05; ZScore [3.0, 3.2], p-value < 0. 1).
from small city (Wald Chi2 = 0.128, df = 1, p = 0.720) or large city (Wald Chi2 = 0.559, df = 1, p = 0.455).
In 69% of the cases the population of the nearest city to the detection point, i.e. located within a 20 km distance, was over 100 000 people, and in 35% of the cases above 500 000 people (Fig. 3). Average population density was 128 ± 18 people/km² at the country level and 697 ± 172 people/km² in the NUTS2 region with first oc-currence (paired t-test mean difference = −570 ± 163, p = 0.002, N = 28). The average
Figure 2. Probability (mean ± SE) of first detection of non-native insect feeding on woody plants in Europe (estimated by GLM) in function of distance class (in 10 km) to a) the nearest city and b) the nearest large city.
population density in NUTS2 region of the detection point was on average 6.2 ± 1.0 times higher than the population density of the respective country (Fig. 4). Highest invaded NUTS 2 to country ratios (above tenfold) were observed for Hungary (21.6), Austria (19.5), Bosnia and Herzegovina (12.5), UK (11.5), Finland (11.1), Belgium (10.7), and Norway (10.3) (Fig. 4).
Figure 3. Percentage and number of first detections of non-native forest insect species by class of city population (up to 20 km distance).
Type of recipient habitat for non-native species
Urban habitat was the most frequently observed land cover type around first detection points, accounting for 74% of the cases. Urban habitats reported were highly diverse, including schoolyards, university campuses and experimental stations, trees in airport and port areas, railway stations, industrial areas, urban arboreta, botanical gardens, public parks, zoos, and street trees. Arboreta, botanical gardens, gardens, and urban parks were the most often reported cases in cities (60% of the cases with site informa-tion). Only 11% of the cases were found in forest habitats. In 4% of the cases these for-ests were close to cities (i.e. at less than 10 km), while the other 7% were in forfor-ests far from cities. Other cases were reported in nurseries (4%) and rural landscapes (11%).
The percentage of first detection in the urban habitat significantly varied with the insect feeding guild (Chi2 = 19.519; p < 0.001). Sap suckers, gall makers, and seed and fruit seeders were more frequently found in urban habitats, 80%, 78%, and 81%, respectively, than defoliators (69%) and bark & wood borers (58%) (Fig. 5). Only a few detections were found in nurseries (Fig. 5).
Insects feeding on broadleaves were more frequently found for the first time in urban habitat (76%) than species feeding on conifers (59%). Still, the difference was not significant (chi2 = 1.130, p = 0.288). Polyphagous species, feeding on both conifers and broadleaves, were reported in nine cases only, but six of these cases (67%) were also in urban areas.
Temporal trend of detection
Temporal trend shows an exponential increase in the number of first records with dec-ade, with a steep increment since the 1990s (Fig. 6). However, overall mean distances
Figure 4. Average population density of the NUTS 2 regions where the non-native forest insect species were first detected and of the corresponding country (inhabitants per km2).
Figure 5. Distribution of first detections in Europe of non-native insects feeding on woody plants per feeding guild and habitat type.
to the nearest small city (Wald Chi2 = 0.291, df = 1, p = 0.589), or large city (Wald Chi2 = 0.479, df = 1, p = 0.489) did not vary with time (Fig. 6).
Land cover composition of recipient areas
The mean percentage of tree cover at 100 and 500 m around the detection point was 17.1% ± 1.3 and 17.2% ± 1.1, respectively, ranging from 1 to 85%, with no differ-ences between these two buffer sizes (t-test = 0.158, df = 307, p = 0.875). Considering these buffer radii, 55% of the detection points were in sites with only 10% or less of tree cover, and in 73% of the cases in sites with less than 20% of tree cover. However, within a buffer of 1000 m radius around the detection point, the mean proportion of tree cover was significantly higher (31.8% ± 1.9) than at 100 m (t-test = 14.6, df = 307, p < 0.001). Again, at 5000 m radius buffer size, the proportion of tree cover was higher (35.4% ± 1.0) than at 100 m (t-test = 14.5, df = 307, p < 0.001). Within the largest buffer radii, i.e. 1000 m and 5000 m around the detection point, there were no difference among feeding guilds for the percentage of tree cover (F4,300 = 2.179, p = 0.071, and F4,300 = 1.928, p = 0.106, respectively for 1 km and 5 km). However, at 100 and 500 m radius, we found differences among feeding guilds for the proportion of tree cover around the detection point (F4,300 = 3.065, p = 0.017 and F4,300 = 3.132, p = 0.015, respectively for 100 and 500 m). In both cases, defoliators tend to occur in sites with higher percentage of tree cover (which was 27% and 25%, respectively for 100 and 500) than for other feeding guilds.
A complementary analysis concerning the estimation of the percentage cover of suitable habitats (following five LULC classes: Green Urban Areas, Sports and Leisure
Figure 6. Temporal trend of first detection in Europe of non-native insects feeding on woody plants and mean distance to the nearest small and large cities.
Facilities, Orchards, Forests, and Herbaceous vegetation associations) in urban areas of large cities was conducted in 94 cases. The proportion of suitable habitat was on aver-age 9.7% ± 1.1, 9.0% ± 0.6, and 9.0% ± 0.6, for 500 m, 1000 m and 5000 m buffer radius, respectively. There were no significant differences between buffer sizes.
The comparison with surrounding landscape showed that the percentage of tree cover within a 100 m buffer radius around the detection point (focal point) was slight-ly, but significantly (t-test mean difference = −4.937 ± 1.471, p = 0.001), lower than tree cover in three buffer areas of the same radius randomly sampled within a distance of 5000 m (17% ± 1.3 vs 22% ± 1.2).
Discussion
Using European data on first detection records of non-native insect species feeding on woody plants since 1950, we could confirm the trend for an exponential increase with time. However, the most striking outcome of the survey is that 88% of first detections were made in cities and, for the majority, in large cities (62% in total, 70% of urban re-cords). Moreover, the number of detections decreased dramatically in the first 10 km out-side the city (Fig. 2). Although trees were always present in the urban area around the de-tection point, the percentage of tree cover was moderate, being less than 20% in general.
Higher amount of non-native forest pests arriving in cities
The proximity of main transport facilities (e.g. airports and ports) and the high density of people make cities under high propagule pressure, i.e. high frequencies of introduc-tions of non-native organisms, plants or animals (Gaertner et al. 2016; Rassati et al. 2016). As arrivals are expected to occur in ports and airports, trees near these interna-tional transport facilities are particularly sensitive. Similar human-assisted introduc-tions of non-native forest pests have been reported in other studies (Yemshanov et al. 2013), and analogous trends have been found in other continents. For example, the emerald ash borer, native to Asia, was first introduced and became established in North America in the highly urbanized Detroit area (Poland and McCullough 2006).
Several records specifically documented first occurrences in urban areas near trans-port facilities and could identify the pathways. For example, the first infestation of
A. glabripennis in the Netherlands, in 2010, was found on native host plants, in an
industrial area in the city of Almere, and was related to pallets used for transport of in-dustrial machinery (Loomans et al. 2013). The long horn beetle Callidiellum rufipenne (Coleoptera, Cerambycidae), attacking cypress trees was first reported on a European host species, Juniperus communis, in Italy in an experimental station, next to the harbor of Porto de Ravenna in which large amounts of transported wood accumulated
(Cam-padelli and Sama 1988). The leaf miner, Parectopa robiniella, was first found close to the Milan airport in Italy (Whitebread 1989).
We may argue that first occurrences occurred mostly in urban areas because more researchers are living in these areas and are, thus, more likely to detect recently intro-duced forest pests. In some cases, researchers found new records within their own fac-ulty campus (e.g. Del Estal et al. 1998; Garcia et al. 2013). This pattern could be also explained by the higher visibility of insect pests on single trees, along streets or in urban parks, than on nearby stands of forests. In fact, we found that more than 87% of first detections resulted from occasional observations with no planned survey or trapping methods targeting specific species.
Presence of suitable habitats for non-native forest pests to establish in cities
Arrival does not necessarily imply successful establishment of introduced species. The establishment of a species in a new area further needs suitable habitat and resources, depending on its ecological niche. In fact, it is estimated that only a minor proportion of new arrivals results in successful establishment in a new region (Mack et al. 2000). This is evident when the frequencies of interceptions are compared with the number of species established (Brockerhoff et al. 2006b, 2014; Eschen et al. 2015). The presence of suitable host trees is an essential prerequisite for new forests pest species to become established in a given area. Reports in urban areas are rather diverse. Examples from the studied reports include schoolyards, public gardens (EPPO 2019); zoological parks, (e.g. Franco et al. 2017), urban parks, botanical gardens (e.g. Penestragania apicalis in France; Nickel et al. 2013), arboreta inside university campuses (e.g. Del Estal et al. 1998), trees along avenues and squares, or trees near airports or seaports (e.g. Cam-padelli and Sama 1988). However, a striking finding of the present study is that tree cover could be very limited in the exact site where species are found. Detection points were located in areas with little proportion tree cover, on average 17% but in more than 30% of the cases, the proportion of tree cover was less than 5%. Further, for sites located in large cities, the proportion of suitable habitat likely to contain trees (using Urban Atlas habitat categories) represented on average less than 10%. This suggests that a small size of suitable habitat, or even a few street trees, can be enough for forest pest species to establish in urban areas and that they do not need large natural or rural forests. For example, Macrohomotoma gladiata, a tropical Asian psyllid, was first found in Italy on Ficus trees along avenues of Naples (Pedata et al. 2012). More generally, the large presence of non-native trees planted as ornamentals in cities is likely to allow the establishment of non-native insects associated to these woody plants in the native range. Actually, about half of the exotic insect species of woody plants that have been introduced to Europe are still confined to the original, exotic host tree and have not switched to another host plant (Roques 2010).
However, we did find some differences in habitat requirements according to feed-ing guild. Defoliators seemed to be more demandfeed-ing in terms of the presence of a
cer-tain density of tree cover. Bark and wood borers were more frequently detected outside urban areas than other guilds. On the other extreme, gall makers, sap suckers, and seed and fruit feeders were mostly found (more than 90% of the cases) in urban areas. In some cases, these species occurred in circumstances in which only a small number of trees of a specific host was present. For example, the invasive gall wasp Epichrysocharis
burwelli, which is known to form galls only on the lemon-scented gum, Corymbia citriodora (Myrtacea), was found in an urban park and the Zoo in Lisbon, where only
a few host trees of that particular host species were present (Franco et al. 2016). Fur-thermore, within hundreds of kilometers around the central point of detection, there were no plantations of lemon-scented gum, and only isolated or small clusters of trees in urban gardens or arboreta, could be found. Therefore, as seen in E. burwelli, the presence of a small number of host trees may be sufficient for a new insect species to establish itself. This may be particularly true when the microhabitat used by the insect on the host tree is small, as normally occurs for gall makers, sap suckers, and seed and fruit seeder. For these insect species, the entire tree or a few trees may provide sufficient habitat for a population to develop. A number of these species can reproduce par-thenogenetically, e.g. hemipteran sap suckers or seed chalcids (Auger-Rozenberg and Roques 2012), or are inbreeders, e.g. seed beetles, which may limit Allee effects arising from mate-finding failure (Liebhold et al. 2016), thus explaining their establishment success on a few isolated urban trees (Brockerhoff and Liebhold 2017).
Cities may facilitate the establishment of tree pests because of their large diversity of tree genera and species, giving non-native pests a better chance of finding a suitable host tree (Liebhold et al. 2018). Most cities in North America and Europe have street tree diversity concentrated in few tree genera and species, mostly broadleaves, like
Pla-tanus, Acer, Tilia, and Fraxinus, but also a number of non-native woody ornamentals.
Still, a large diversity of tree species and shrubs is found in cities when urban parks and gardens are considered (Raupp et al. 2006; Sjöman et al. 2012). An architype of such diversity is found in botanical gardens, where a large collection of species is present, which are mostly non-native tree species. In fact, urban gardens and arboreta may ac-cumulate hundreds of tree species in only a few hectares. Examples from the records that we retrieved in this study, are Tapada da Ajuda in Lisbon that harbors more than 300 tree species (Vasconcelos et al. 2013) where T. peregrinus was found for the first time in Portugal (Garcia et al. 2013), or the Gibraltar Botanic Gardens, with an area of only 6 ha which holds a collection of over 1700 species of plants, largely non-native, where the cycadellid Sophonia orientalis was first found in Europe (Wilson et al. 2011). The bark beetle Ambrosiodmus rubricollis (Coleoptera, Curculionidae), was found in
Aesculus hippocastanum in a botanical garden of Padova, Italy (Faccoli et al. 2009).
In-terestingly, broadleaves are more abundant and diverse in cities than conifers (Raupp et al. 2006), which possibly explains the result from our study where the probability of a non-native insect being detected for the first time in a city was higher for insect species feeding on broadleaves than on conifers.
In several cases, species were found near cities, i.e. in suburban areas. These areas are often characterized by heterogeneous landscapes, where gardens, orchards, forest
fragments, and many rural habitats are present and tree abundance and diversity is greatly increased. In fact, the proportion of tree cover increased from 17% in urban areas around detection points to 32% and 35% in buffers of 1000 m and 5000 m radius, respectively. Thus, suburban areas could further facilitate the establishment of non-native forest pests. In only 4% of the cases (20 out of 508), non-native species were detected in nurseries. For these particular cases, detections occurred probably before establishment, which would also facilitate eradication attempts.
Cities may also offer better conditions for non-native species establishment due to their more suitable climate, in particular warmer temperatures resulting from the heat island effect (Debbage and Shepherd 2015). For example, increasing temperature caused by impervious surface was observed to significantly increase insect fecundity and contribute to higher population growth (Dale and Frank 2014). This would be particularly relevant for cities in temperate regions receiving non-native species that originate from subtropical countries. In addition, urban trees are frequently exposed to environmental stress factors, such as water stress, poor soil conditions and pollu-tion (Sjöman and Nielsen 2010). In such condipollu-tions, trees can be more vulnerable to some non-native insect species, in particular the secondary pests feeding on declining trees. Contrarily, irrigation and fertilization may render urban trees vulnerable to other guilds such as defoliators, sap suckers, and gall makers. An example of better suitability of cities is the distribution of the gall midge Obolodiplosis robiniae affecting Robinia
pseudoacacia in Slovakia, for which greater infestations were found within cities than in
the countryside (Tóth et al. 2009). Observations that invasive species are more preva-lent in cities than in rural areas because of environmental stress were also reported for other groups of organisms like plants (Gaertner et al. 2016)
Where are first detections in Europe occurring?
At a larger spatial scale, hotspot analyses clearly showed a clustered pattern of first detection records in Europe. Most hotspots for the first detection of non-native forest pests were found along the coastal regions of Europe, from the Mediterranean coast of Italy, France, and Spain to the Atlantic coast, from Portugal to the Netherlands (Fig. 1). They clearly match with the location of major cargo seaports, close to large cities (e.g. Genova, Napoli, Venice, Ravenna, Marseille, Barcelona, Lisbon, Vigo, London, and Amsterdam), where the intense flow of imported goods provides more opportunities for non-native forest insect introduction. The majority of the busiest cargo seaports in Europe (excluding Russia) by total cargo volume (Kiprop 2018) were located in the hotspot clusters or their vicinity (Rotterdam in the Netherlands, Antwerp in Belgium, Marseilles/Fos, La Rochelle, and Le Havre in France, Botas in Turkey, Valencia in Spain, and Trieste and Genova in Italy).
Still, two other hotspots of first detections were identified, one in Central Europe, from southern Germany, to northern Italy, and the other in Eastern Europe. These
areas coincide with intense industrial regions and a number of river ports. Their prox-imity to Middle East and Asia, from where more than 40% of the non-native species from our study originate, may further suggest a pathway of progression from eastern regions. Some particular areas may also reflect a concentration of forest entomologists, but this is difficult to verify.
Conclusions
The economic impact of invasive forest insect pests is huge on both forest and urban environments (Poland and McCullough 2006; Boyd et al. 2013). Early detection is the main prerequisite for successful eradication. From the present study, we conclude that surveillance and monitoring for invasive forests pests should be focused on trees in urban and suburban areas. More especially, we recommend that surveys give priority to urban parks with high tree diversity, such as botanical gardens, arboreta, and woodlots near airports and seaports. These areas should concentrate the attention of forest protection authorities and be dedicated to structured surveys and trapping networks. Recently, trap-ping methods using multiple lures have been shown effective for early detection of non-native forest moths and beetles (Brockerhoff et al. 2013; Rassati et al. 2015; Fan et al. 2019) and, thus, should be used more systematically. Another way forward is to promote the use of urban trees as sentinels for monitoring the introduction of non-native forest pests and diseases (Paap et al. 2017), with the increasing awareness and involvement of citizens, who could use smartphone applications for day-to-day surveillance of urban tree health (Marzano et al. 2015). Several factors can contribute to urban areas becoming hotspots for the establishment of non-native forest pests. The high population density and vicinity to main international transport facilities (seaports and airports) likely enable the arrival of new species. However, it is the diversity of host tree species, scattered over multiple urban green spaces, and favorable microclimatic conditions (warmer, drier) that can ultimately favor the establishment of non-native insect species in cities. Still, other studies are needed for an accurate assessment of the relative importance of these factors.
Acknowledgements
The study was part of the PLURIFOR project, EU INTERREG SUDOE, and of the HOMED project, which received funding from the European Union’s Horizon 2020 research and innovation programme under grant agreement no. 771271. This study received backing from Forest Research Center (CEF). CEF is a research unit funded by Foundation for Science and Technology (FCT), Portugal (UID/AGR/00239/2019). M.R. Fernandes was supported by national funds via the FCT, under “Norma Tran-sitória–DL 57/2016/CP1382/CT0019”. P. Nunes was supported by SUSFOR (PD/00157/2012) doctoral grant from FCT (PD/BD/142960/2018).
References
Auger-Rozenberg MA, Roques A (2012) Seed wasp invasions promoted by unregulated seed trade affect vegetal and animal biodiversity. Integrative Zoology 7: 228–246. https://doi. org/10.1111/j.1749-4877.2012.00308.x
Benjamini Y, Hochberg Y (1995) Controlling the false discovery rate: a practical and powerful approach to multiple testing. Journal of the Royal Statistical Society, Series B (Methodo-logical) 57(1): 289–300.https://doi.org/10.1111/j.2517-6161.1995.tb02031.x
Boyd IL, Freer-Smith PH, Gilligan CA, Godfray HC (2013) The consequence of tree pests and diseases for ecosystem services. Science 342: 1235773. https://doi.org/10.1126/sci-ence.1235773
Brockerhoff EG, Liebhold AM (2017) Ecology of forest insect invasions. Biological Invasions 19(11): 3141–3159. https://doi.org/10.1007/s10530-017-1514-1
Brockerhoff EG, Liebhold AM, Jactel H (2006a) The ecology of forest insect invasions and ad-vances in their management. Canadian Journal of Forest Research 36(2): 263–268. https:// doi.org/10.1139/x06-013
Brockerhoff EG, Bain J, Kimberley M, Knížek M (2006b) Interception frequency of exotic bark and ambrosia beetles (Coleoptera: Scolytinae) and relationship with establishment in New Zealand and worldwide. Canadian Journal of Forest Research 36(2): 289–298.
https://doi.org/10.1139/x05-250
Brockerhoff EG, Kimberley M, Liebhold AM, Haack RA, Cavey JF (2014) Predicting how altering propagule pressure changes establishment rates of biological invaders across species pools. Ecology 95: 594–601. https://doi.org/10.1890/13-0465.1
Brockerhoff EG, Suckling DM, Roques A, Jactel H, Branco M, Twidle AM, Mastro VC, Kim-berley MO (2013) Improving the efficiency of lepidopteran pest detection and surveil-lance: constraints and opportunities for multiple-species trapping. Journal of Chemical Ecology 39(1): 50–58. https://doi.org/10.1007/s10886-012-0223-6
Campadelli G, Sama G (1988) Prima segnalazione per l’Italia di un cerambicide giapponese:
Callidiellum rufipenne Motschulsky. Bollettino dell’Istituto di Entomologia “Guido
Gran-di” dell’Università di Bologna 43: 69–73.
Carter M, Smith M, Harrison R (2010) Genetic analyses of the Asian longhorned beetle (Co-leoptera, Cerambycidae, Anoplophora glabripennis), in North America, Europe and Asia. Biological Invasions 12(5): 1165–1182. https://doi.org/10.1007/s10530-009-9538-9
Chakraborty S, Whitehill JG, Hill AL, Opiyo SO, Cipollini D, Herms DA, Bonello P (2014) Effects of water availability on emerald ash borer larval performance and phloem phenolics of Manchurian and black ash. Plant, Cell & Environment 37(4): 1009–1021. https://doi. org/10.1111/pce.12215
Constantinescu C, Mattoo A, Ruta M (2015) The Global Trade Slowdown: Cyclical or Struc-tural? IMF Working Paper No. 15/6. 2015. https://doi.org/10.5089/9781498399135.001
Dale AG, Frank SD (2014) Urban warming trumps natural enemy regulation of herbivorous pests. Ecological Applications 24(7): 1596–1607. https://doi.org/10.1890/13-1961.1
Debbage N, Shepherd JM (2015) The urban heat island effect and city contiguity. Computers, Environment and Urban Systems 54: 181–194. https://doi.org/10.1016/j.compenvurb-sys.2015.08.002
Del Estal P, Soria S, Viñuela E (1998) Nota de la presencia en España de Dasineura leditchiae (Osten Sacken), sobre acacia de tres espinas. Boletín de Sanidad Vegetal Plagas 24: 225–230. EPPO (2019) EPPO Global Database. https://gd.eppo.int/reporting/article-6064
Eschen R, Roques A, Santini A (2015) Taxonomic dissimilarity in patterns of interception and establishment of alien arthropods, nematodes and pathogens affecting woody plants in Europe. Diversity and Distributions 21(1): 36–45. https://doi.org/10.1111/ddi.12267
Faccoli M, Frigimelica G, Mori N, Petrucco Toffolo E, Vettorazzo M, Simonato M (2009) First record of Ambrosiodmus (Hopkins, 1915) (Coleoptera: Curculionidae, Scolytinae) in Europe. Zootaxa 2303: 57–60. https://doi.org/10.11646/zootaxa.2303.1.4
Fan JT, Denux O, Courtin C, Bernard A, Javal M, Millar JG, Hanks LM, Roques A (2019) Multicomponent blends for trapping native and exotic longhorn beetles at potential points-of-entry and in forests. Journal of Pest Science 92: 281–297. https://doi.org/10.1007/ s10340-018-0997-6
Franco JC, Garcia A, Branco M (2016) First report of Epichrysocharis burwelli in Europe, a new invasive gall wasp attacking eucalypts. Phytoparasitica 44(4): 443–446. https://doi. org/10.1007/s12600-016-0539-9
Garcia A, Figueiredo E, Valente C, Monserrat VJ, Branco M (2013) First record of
Thaumasto-coris peregrinus in Portugal and of the neotropical predator Hemerobius bolivari in Europe.
Bulletin of Insectology 66(2): 251–256.
Gaertner M, Larson BM, Irlich UM, Holmes PM, Stafford L, van Wilgen BW, Richardson DM (2016) Managing invasive species in cities: a framework from Cape Town, South Africa. Landscape and Urban Planning 151: 1–9. https://doi.org/10.1016/j.landurb-plan.2016.03.010
Herms DA, McCullough DG (2014) Emerald ash borer invasion of North America: history, biology, ecology, impacts, and management. Annual Review of Entomology 59: 13–30.
https://doi.org/10.1146/annurev-ento-011613-162051
Hulme P, Roy D (2010) DAISIE and arthropod invasions in Europe. BioRisk 4(1): 1–3. htt-ps://doi.org/10.3897/biorisk.4.41
Hurley BP, Garnas J, Wingfield MJ, Branco M, Richardson DM, Slippers B (2016) Increasing numbers and intercontinental spread of invasive insects on eucalypts. Biological Invasions 18(4): 921–933.
Katsanevakis S, Deriu I, D’amico F, Nunes AN, Pelaez Sanchez S, Crocetta F, Arianoutsou M, Bazos I, Christopoulou A, Curto G, Delipetrou P, Kokkoris Y, Panov VE, Rabitsch W, Roques A, Scalera R, Shirley SM, Tricarico E, Vannini A, Zenetos A, Zervou S, Zikos A, Cardoso AC (2015) European Alien Species Information Network (EASIN): supporting European policies and scientific research. Management of Biological Invasions 6: 147–157.
https://doi.org/10.3391/mbi.2015.6.2.05
Kiprop V (2018) The busiest cargo ports in Europe. WorldAtlas. [Mar. 1, 2018] http://worldat-las.com/articles/the-busiest-cargo-ports-in-europe.html
Kishi Y (1995) The Pine Wood Nematode and the Japanese Pine Sawyer. Forests Pests in Japan, No. 1. Thomas Co., Tokyo, 302 pp.
Liang L, Clark JT, Kong N, Rieske LK, Fei S (2014) Spatial analysis facilitates invasive spe-cies risk assessment. Forest Ecology and Management 315(1): 22–29. https://doi. org/10.1016/j.foreco.2013.12.019
Liebhold AM, Berec L, Brockerhoff E G, Epanchin-Niell RS, Hastings A, Herms DA, Kean JM, McCullough DG, Suckling DM, Tobin PC, Yamanaka T (2016) Eradication of invad-ing insect populations: from concepts to applications. Annual Review of Entomology 61: 335–352. https://doi.org/10.1146/annurev-ento-010715-023809
Liebhold AM, Halverson JA, Elmes GA (1992) Gypsy moth invasion in North America: a quanti-tative analysis. Journal of Biogeography 1992: 513–520. https://doi.org/10.2307/2845770
Liebhold AM, Yamanaka T, Roques A, Augustin S, Chown SL, Brockerhoff EG, Pyšek P (2018) Plant diversity drives global patterns of insect invasions. Scientific Reports 8(1): 12095. https://doi.org/10.1038/s41598-018-30605-4
Loomans AJM, Wessels-Berk B, Copini P, Mentink NJB, de Hoop MB, den Hartog WGSA (2013) Import-inspections, surveys, detection and eradication of the longhorn beetles
Ano-plophora chinensis and A. glabripennis in the Netherlands. Journal of Entomological and
Acarological Research 45 (no. s1): 1–8.
Mack RN, Simberloff D, Mark Lonsdale W, Evans H, Clout M, Bazzaz, FA (2000) Biotic invasions: causes, epidemiology, global consequences, and control. Ecological Applications 10(3): 689–710. https://doi.org/10.1890/1051-0761(2000)010[0689:BICEGC]2.0.CO;2
Marzano M, Dandy N, Bayliss HR, Porth E, Potter C (2015) Part of the solution? Stakeholder awareness, information and engagement in tree health issues. Biological Invasions 17(7): 1961–1977. https://doi.org/10.1007/s10530-015-0850-2
Meineke EK, Dunn RR, Sexton JO, Frank SD (2013) Urban warming drives insect pest abundance on street trees. PloS ONE 8(3): e59687. https://doi.org/10.1371/journal. pone.0059687
Migliaccio E, Zampetti MF (1989) Megabruchidius dorsalis e Acanthoscelides pallidipennis, specie nouve per la fauna Italiana. Bollettino dell’Associazione Romana di Entomologia 43: 63–69. Nickel H, Callot H, Knop E, Kunz G, Schrameyer K, Sprick P, Walter S (2013) Penestragania
apicalis (Osborn & Ball, 1898), another invasive Nearctic leafhopper found in Europe
(Hemiptera: Cicadellidae, Iassinae). Cicadina 13: 5–15.
OECD (2012) Redefining urban: a new way to measure metropolitan areas: Functional Urban Areas in OECD countries: 148. http://www.oecd.org/regional/redefiningurbananewway-tomeasuremetropolitanareas.htm
Ord JK, Getis A (1995) Local spatial autocorrelation statistics: distributional issues and an applica-tion. Geographical Analysis 27(4): 286–306.https://doi.org/10.1111/j.1538-4632.1995. tb00912.x
Paap T, Burgess TI, Wingfield MJ (2017) Urban trees: bridge-heads for forest pest invasions and sentinels for early detection. Biological Invasions 19(12): 3515–3526. https://doi. org/10.1007/s10530-017-1595-x
Pedata PA, Burckhardt D, Mancini D (2012) Severe infestations of the jumping plant-louse
Macrohomotoma gladiata, a new species for Italy in urban Ficus plantations. Bulletin of
Insectology 65(1): 95–98.
Poland TM, McCullough DG (2006) Emerald ash borer: invasion of the urban forest and the threat to North America’s ash resource. Journal of Forestry 104(3): 118–124.
Rassati D, Faccoli M, Petrucco Toffolo E, Battisti A, Marini L (2015) Improving the early de-tection of alien wood‐boring beetles in ports and surrounding forests. Journal of Applied Ecology 52(1): 50–58. https://doi.org/10.1111/1365-2664.12347
Rassati D, Faccoli M, Haack RA, Rabaglia RJ, Petrucco Toffolo E, Battisti A, Marini L (2016) Bark and ambrosia beetles show different invasion patterns in the USA. PLoS ONE 11(7): e015851. https://doi.org/10.1371/journal.pone.0158519
Raupp MJ, Cumming AB, Raupp EC (2006) Street tree diversity in eastern North America and its potential for tree loss to exotic borers. Arboriculture and Urban Forestry 32(6): 297–304. Robinet C, Roques A, Pan H, Fang G, Ye J, Zhang Y, Sun J (2009) Role of human-mediated
dispersal in the spread of the pinewood nematode in China. PLoS ONE 4(2): e4646.
https://doi.org/10.1371/journal.pone.0004646
Roques A (2010) Alien forest insects in a warmer world and a globalized economy: impacts of changes in trade, tourism and climate on forest biosecurity. New Zealand Journal of For-estry 40: 77–94. [Supplement]
Roques A (2011) Invasive patterns of alien terrestrial invertebrates in Europe. In: Pimentel D (Ed.) Biological Invasions – Economic and Environmental Costs of Alien Plant, Animal and Microbe Species (2nd edn). CRC Press, Boca Raton, New York and London, 199–226.
https://doi.org/10.1201/b10938-13
Roques A, Kenis M, Lees D, Lopez-Vaamonde C, Rabitsch W, Rasplus JY, Roy DB (2010) Alien terrestrial arthropods of Europe. BioRisk 4: 1–1028. https://doi.org/10.3897/biorisk.4.42
Roques A, Auger-Rozenberg M-A, Blackburn TM, Garnas JR, Pyšek P, Rabitsch W, Richardson DM, Wingfield MJ, Liebhold AM, Duncan RP (2016) Temporal and interspecific varia-tion in rates of spread for insect species invading Europe during the last 200 years. Biologi-cal Invasions 18(4): 907–920. https://doi.org/10.1007/s10530-016-1080-y
Seebens H, Blackburn TM, Dyer EE, Genovesi P, Hulme PE, Jeschke JM, Pagad S, Pyšek P, Winter M, Arianoutsou M, Bacher S, Blasius B, Brundu G, Capinha C, Celesti-Grapow L, Dawson W, Dullinger S, Fuentes N, Jäger H, Kartesz J, Kenis M, Kreft H, Kühn I, Lenzner B, Liebhold A, Mosena A, Moser D, Nishino M, Pearman D, Pergl J, Rabitsch W, Rojas-Sandoval J, Roques A, Rorke S, Rossinelli S, Roy HE, Scalera R, Schindler S, Štajerová K, Tokarska-Guzik B, van Kleunen M, Walker K, Weigelt P, Yamanaka T, Essl F (2017) No saturation in the accumulation of alien species worldwide. Nature Communications 8: 14435. https://doi.org/10.1038/ncomms14435
Shaker RR, Yakubov AD, Nick SM, Vennie-Vollrath E, Ehlinger TJ, Forsythe KW (2017) Predicting aquatic invasion in Adirondack lakes: a spatial analysis of lake and landscape characteristics Ecosphere 8(3): 1–25. https://doi.org/10.1002/ecs2.1723
Sjöman H, Nielsen AB (2010) Selecting trees for urban paved sites in Scandinavia–a review of information on stress tolerance and its relation to the requirements of tree planners. Urban Forestry & Urban Greening 9(4): 281–293. https://doi.org/10.1016/j.ufug.2010.04.001
Sjöman H, Östberg J, Bühler O (2012) Diversity and distribution of the urban tree population in ten major Nordic cities. Urban Forestry & Urban Greening 11(1): 31–39. https://doi. org/10.1016/j.ufug.2011.09.004
Sousa E, Bravo MA, Pires J, Naves P, Penas AC, Bonifacio L, Mota MM (2001)
Bursaphelen-chus xylophilus (Nematoda; aphelenchoididae) associated with Monochamus galloprovin-cialis (Coleoptera; Cerambycidae) in Portugal. Nematology 3(1): 89–91. https://doi. org/10.1163/156854101300106937
Tóth P, Váňová M, Lukáš J (2009) The distribution of Obolodiplosis robiniae on black locust in Slovakia. Journal of Pest Science 82(1): 61–66. https://doi.org/10.1007/s10340-008-0220-2
United Nations (2018) World Urbanization Prospects: The 2018 Revision United Nations. Department of Economic and Social Affairs, Population Division, New York, 1–103.
https://wwwunorg/development/desa/publications/2018-revision-of-world-urbanization-prospectshtml
Vasconcelos T, Forte P, Arsénio P, Soares AL (2013) Diversidade arbórea no Parque Botânico da Tapada da Ajuda. O Botânico 7: 7–10.
Whitebread SE (1989) Phyllonorycter robiniella (Clemens, 1859) in Europe (Lepidoptera, Gracillariidae). Nota Lepidopterologica 12(4): 344–353.
Wilson M, Bensusan K, Perez C, Torres JL (2011) First records of the exotic leafhopper So-phonia orientalis (Matsumura, 1912) (Hemiptera: Auchenorrhyncha: Cicadellidae) for the Iberian Peninsula and mainland Europe. Annals of the Entomological Society of America 94(5): 664–669.
Yemshanov D, Koch FH, Siltanen M, Wilson K, Koehler K (2013) Exploring critical uncer-tainties in pathway assessments of human-assisted introductions of alien forest species in Canada. Journal of Environmental Management 129: 173–182. https://doi.org/10.1016/j. jenvman.2013.07.013
Supplementary material 1
Table S1. Data on first records by species and countries
Authors: Manuela Branco, Pedro Nunes, Alain Roques, Maria Rosário Fernandes, Christophe Orazio, Hervé Jactel
Data type: species data
Copyright notice: This dataset is made available under the Open Database License (http://opendatacommons.org/licenses/odbl/1.0/). The Open Database License (ODbL) is a license agreement intended to allow users to freely share, modify, and use this Dataset while maintaining this same freedom for others, provided that the original source and author(s) are credited.