BAR, Curitiba, v. 7, n. 3, art. 4,
pp. 276-293, July/Sept. 2010
Consumer
‐
company
Identification:
Development
and
Validation of a Scale
Diogo Fajardo Nunes Hildebrand *
E-mail address: diogofnh@gmail.comZicklin School of Business/ City University of New York New York, United States.
Daniel Von Der Heyde Fernandes
E-mail address: dfernandes@rsm.nlRotterdam School of Management/Erasmus University Rotterdam, Netherlands.
Andres Rodriguez Veloso
E-mail address: veloso@usp.br Universidade de São Paulo São Paulo, SP, Brazil.Luiz Antônio Slongo
E-mail address: laslongo@ea.ufrgs.br Universidade Federal do Rio Grande do Sul Porto Alegre, RS, Brazil.A
BSTRACTConsumer-Company Identification is a relatively new issue in the marketing academia. Bhattacharya and Sen (2003) explored the Social Identity theory and established Consumer-Company Identification as the primary psychological substrate for deep relationships between the organization and its customers. In the present study a new instrument was constructed and validated that permits the empirical verification of the phenomenon described by Bhattacharya and Sen (2003). The scale validated in the present study is the first to embrace the idiosyncrasies of the identification between consumers and organizations. The process was conducted through 3 independent data collections. The first one was collected using literature search and in-depth interviews with 12 undergraduate students and bachelors from different professional fields. The second data base was obtained from a survey of 226 undergraduate students from 3 universities in 2 big Brazilian cities. This data base was used for purification purposes using Explanatory Factorial Analysis. Finally, the Structural Equation Modeling technique was applied to analyze a third data base composed of 387 observations collected from the same 3 universities of the second study. The results confirm the content, convergent and discriminant validity of the new scale proposed.
Key words: consumer-company identification; confirmatory factor analysis; consumer behavior. Received 22 June 2009; received in revised form 03 November 2009.
Copyright © 2010 Brazilian Administration Review. All rights reserved, including rights for
translation. Parts of this work may be quoted without prior knowledge on the condition that
the source is identified.
* Corresponding author: Diogo Fajardo Nunes Hildebrand
INTRODUCTION
The management of corporate identity has grown in importance due to a number of factors, including increased product life cycle, growing competition, globalization, public expectations regarding corporate social responsibility and the fall of barriers that separated organizations from the external environment (Balmer & Gray, 1999). This tendency has developed over approximately the last 15 years, with corporate identity becoming increasingly valued as a prominent paradigm linked to the strategic administration of the enterprise and appearing as a central issue (Balmer & Gray, 1999). It is important to highlight that initial studies dealt with the question of the causes and effects of the identification of employees with the company as a focal point (Ashforth & Mael, 1989).
Large multinational corporations are among the pioneers in the administration of their identity, be it with the aim of increasing the acceptance of their brand name among Europeans, as in the case of Hyundai, or in order to improve their damaged image as in the case of Wal-Mart (Creamer & Frazier, 2006; Stein & Mcveigh, 2006).
In an article published in the Journal of Marketing in 2003, Bhattacharya and Sen (2003) established consumer-company identification as the first psychological substrate that results in deep, committed and significant relations between customers and organizations (Bhattacharya & Sen, 2003). In search of subsidies in the theories of social identity (Grubb & Grathwohl, 1967; Tajfel & Turner, 1982) and Organizational Identification [OI] (Ashforth & Mael, 1989; Bergami & Bagozzi, 2000; Whetten & Godfrey, 1998), Bhattacharya and Sen (2003) offer a consistent theoretical body that explains the conditions in which individuals have greater propensity to identify with a company and the bases and consequences of this activity.
The authors suggest that empirical testing is the next logical step in the validation of their model and its propositions. Because of the number of constructs present in their archetype and the complexity of the relationship among them, the authors suggest that one or two objects be tested prior to testing the full set of propositions.
Moreover, the authors point out that there are no scales for many of the constructs, and even when such scales exist they are in need of revision and adaptation in order to allow for this new phenomenon, so as to ensure greater validity for further research. Accordingly, the present study, in accordance with the suggestions made by Bhattacharya and Sen (2003), aims to develop a scale that measures the cognitive component of consumer identification with the company.
Firstly, the conceptual bases of the theory of social identity are presented, following which an effort is made to arrive at a definition of the consumer-company identity construct. This theoretical development will be responsible for sustaining the phase of item generation. Following that, two consecutive collections are carried out in order to assess the reliability and validity of the scale. The study rounds off with a discussion and implications.
THE
CONCEPTUAL
BASES
OF THETHEORY
OFSOCIAL
IDENTITY
One of the most widely appreciated approaches dedicated to the study of the formation of the concept of self - the theory of social identity – highlights the observation of cognitive associations made by individuals in an endeavor to define their identity (Sirgy, 1982). This effort at affirming the continuity of their self-concepts over time and space, seeking to differentiate themselves from others (Whetten & Godfrey, 1998), suggests that social identity is constructed through interpretations and practices that have the purpose of affirming and increasing the coherence of their self-concepts. This occurs when individuals seek acceptance from some groups and distance from others (Ashforth & Mael, 1989; Whetten & Godfrey, 1998).
In applying social identification in the field of organizations, Ashforth and Mael (1989) suggest that people can be classified into various social categories and that different individuals make use of different categorization models. According to the theory of social identity, self-concept is formed by personal identity, which includes idiosyncratic characteristics, and social identity, which encompasses the salient characteristics of the group to which the individual belongs or would like to belong. The process of social identification is resumed, therefore, in the perception of singularity with or belonging to some human group (Ashforth & Mael, 1989; Reed, 2002). Using the theory of social identification as a foundation, a definition of the construct of consumer identification with the company is proposed below, establishing the limits within which this research will be placed.
Consumer
Identification
with
the
Company
–
Definition
of
the
Construct
The term identification was coined in the 1950s by Foote, who defined it as appropriation of and
commitment to an identity (Bergami & Bagozzi, 2000). This commitment is translated into interests shared between A who identifies him/herself with B (Burke, 1950), or an increase in the sense of intra-group oneness and the corresponding sharing of the objectives and successes of the intra-group (Tolman, 1943). This idea makes possible the appropriation of the term and of its meanings by those involved in the study of business organizations. A great amount of such studies conceive Organizational Identification [OI] as an attraction or desire to maintain a stable emotional relationship with the identified object (O’Reilly & Chatman, 1986) or as the association established between an individual and the organization with which the individual is affiliated (Cheney, 1982).
However, despite such contributions, the derived definition of the Theory of Social Identification [TSI] presented the most developed theoretical-conceptual framework built up in the area of organizational research (Riketta, 2004). Hence, Bhattacharya and Sen (2003), in a rhetorical effort at establishing the foundation of their theory of identification, used studies that approached organizational identification [OI] in the light of TSI.
A meta-analysis conducted by Riketta (2004), with around 80 pieces of academic research that looked into OI within the TSI research lines, presented identification as a cognitive construct defined as the congruence between the identity of an individual and that of a company, as the feeling of ownership and belonging in relation to an organization, or as the process of incorporation of the attributes of the organization into the self-concept.
Other authors suggest that identification also occurs by means of cognitive links between consumers and companies (Aaker, 1996; Swanson & Davis, 2006). Along the same lines and citing the works of Pratt (1998) and Scott and Lane (2000), Bhattacharya and Sen (2003) argue that, in an era of corporative influence and unprecedented consumerism, some companies represent and offer attractive social identities that help individuals satisfy their needs for self-definition.
This theoretical development makes it possible to characterize consumer-company identification as a cognitive state of self-categorization existing between the consumer and the corporation (Bhattacharya & Sen, 2003) that encompasses: (1) feelings of solidarity in relation to the institution and support for the company, (2) the sharing of characteristics with the company and (3) the sharing of characteristics with other consumers of the company. Having presented the theoretical background that guides this work, we will now enumerate all the steps taken to develop a scale that measures the cognitive component of consumer identification with the company.
S
CALED
EVELOPMENTThe methodology adopted for this study is based on the writings of Churchill (1979) and Rossiter (2002). The first step in the development of the scale was presented in the previous sections, which provide the fundamentals for the definition of the construct under debate. The second step in this process is the generation of the items for the scale, later purified and validated through the application of two separate collections carried out in the first months of 2007.
First
Phase
–
Item
Generation
The process of item generation began with a search for previously developed instruments that might be of use in measuring the phenomenon consumer-company identification. As scales encompassing the object of the study were not found, it became necessary to examine scales developed for other areas, but that might be adapted to the objective of the present study.
For this research effort, the following studies and respective developed scales were chosen as potential sources because they were the most frequently used in studies involving the constructs organizational identification and consumer-company identification: Bergami and Bagozzi (2000), Cheney (1982) and Mael (1988).
The first scale was discarded because of its lack of maturity and, as it is a visual scale, the impossibility of validating it for the consumer-company identification construct in the absence of a leader scale. The second was rejected due to its low discriminant validity in relation to other constructs, such as organizational commitment and satisfaction at work scales (Oviatt, 2002; Riketta, 2004), as well as for generating relatively heterogeneous outcomes (Riketta, 2004). The scale developed by Mael (1988) was considered suitable as it had proven to be one of the most representative OI measurement instruments (Riketta, 2004), a recognition to a greater or lesser degree by Bergami and Bagozzi (2000), Riketta (2004), Mael and Tetrick (1992) and Cornwell and Coote (2005). The tenth item of the scale was eliminated because it was not related to the subject dealt with in the present study and there was no possibility of adapting it to the study. Other items were adapted to measure consumer-company identification.
The projective technique was used during the in-depth interviews, in accordance with Zaltman (1997), 70% of stimuli are captured through the visual system, suggesting that the combination of verbal and non-verbal language better translates the analyzed behavior (Zaltman, 1997). Accordingly, 12 consumers, who had spontaneously agreed to take part in the survey, were asked to bring with them, to a scheduled interview, around 10 figures, such as photos and print ads, representing a company of which they are clients and with which they identify greatly. Nine of the 12 participants were business students from a university in a big Brazilian city who were between their second and fourth years of undergraduate studies. They were coupled with 3 other participants who worked in different professional fields (2 in psychology and 1 in biochemistry). Of the total participants, 4 were males and 8 females, and they were between 19 and 29 years old.
The participants were interviewed by a trained psychologist and one of the co-authors of the present study. Later on, both participated in the data analysis process. When the tenth interview was carried out, convergence of content was found, indicating that enough interviews had been carried out. Since another 2 interviews had already been scheduled, they were carried on in order to generate a richer database for further analysis.
The interviews were recorded and then transcribed. The resulting database was analyzed with the support of Bardin´s (1977) content analysis technique. The transcribed text and the photos and print ads brought by the participants were analyzed. Words and phrases were categorized in order to allow a better understanding of the data and the generation of items. In table 1, the items generated are presented, and a brief overview of phases and considerations from interviewees that underlies item generation. Respondents are characterized as R1 to R12.
Table 1:
Interview Results and Items Generated
V10 Consuming the products/services of the Company highlights my personal characteristics.
R10 – consuming products from that company highlights my characteristics.
R1 – “people differentiate themselves from others trough the clothing they wear”.
V11 I believe that the Company cultivates the values that I hold in esteem.
R9 – values the democratic spirit of the organization.
R2 and R6 – ethics is the most appreciated value the organization has.
V12 I do not identify with the posture of the Company.*
R7 – “this organization seeks the new, new technologies, that´s why I trust it”.
R11 – “people say that company X is very competitive and I like it” R12 – “the X company is serious about their work, competent in always seeking the best”
V13 I believe that the products/services of the Company help me define who I am.
R1 – “the set of brands, and consumer habits characterizes the individual”
R8 – idealized the company as a heterosexual man, between 20 and 30 years, rich, with a modern haircut, fashion, and with a normal bodyline.
V14 I believe that consuming products/services of the Company leads others to view me in a manner that I wish.
Individuals described companies as having an attractive, interesting and desired image, therefore aiding in the process of constructing a self-concept.
V15 I believe that consuming products of the Company helps me to be part of the social group to which I belong.
R7 – the company is “fast moving”, “doesn’t wait for things to happen” and is “entrepreneurial”. Regarding image, the company is “dynamic”, “seeks accomplishments” and “overcomes problems”.
Table 1 (continued)
V16 I recognize myself in the Company.
R9 – described the company with the same adjectives used to describe herself, as did other interviewees.
V17 The decision to choose this Company is based on values that I judge to be important in my personal life.
R6 – when questioned on why she would select the company to buy financial products, stated that she would do so because the company is ethical, transparent, and has values that she shares.
R1 – has chosen an athletic shoes manufacturer based on the radical image the company carries.
V18 I can see no similarities between my identity and that of the Company. *
R12 – used several of his own and particular characteristics to describe a laboratory, showing the proximity of his self-concept and the company’s image.
V19 People who are important in my life identify with the values of the Company.
R4 – indicated that several of her friends also identified with the company she chose for the interview.
R1 – several of his friends, despite having different characteristics from him, identify themselves with the chosen company.
R2 – “I have several friends that identify themselves with the company”.
V20 Consuming products/services of this Company influences the image that I transmit to people that I know.
R1 – “people are defined by the clothing they wear”.
R11 – when consuming services from a laboratory, she transmitted the image of “a cultured person who has knowledge”.
R7 – “I transmit the image of a dynamic and questioning person”
V21 I perceive that my main characteristics are highlighted by consuming
products/services of the Company.
R1 – believes that there is an influence of the values of the company on the consumer’s image, and that the use of products highlights the individuality of each one.
Note. * Reversed items.
With the outcome of this work, 12 items were generated that, together with the assertions of Mael’s scale (1988), appeared to adequately fulfill the universe of the construct under analysis. The generated assertions refer to the attributes (1) feelings of solidarity in relation to the institution and support of the company, (2) characteristics shared with the company and (3) characteristics shared with other consumers of the company. These 12 items (V10-V21), together with the 9 obtained and adapted from Mael’s scale composed the data collection instrument (V1-V9), as shown below.
Table 2:
List of Items
V1 When someone praises the Company, it feels like a personal compliment.
V2 I’m very interested in what others think about the Company.
V3 If a media story criticized the Company, I would feel embarrassed.
V4 I act like a typical consumer of the Company, to a great extent.
V5 I have a number of qualities typical of consumers of the Company.
V6 When someone criticizes the Company, it feels like a personal insult.
V7 When I talk about the Company, I usually say “we” rather than “they”.
Table 2 (continued)
V8 The Company’s successes are my successes.
V9 I don’t act like a typical consumer of the Company.
V10 Consuming the products/services of the Company highlights my personal characteristics.
V11 I believe that the Company cultivates the values that I hold in esteem.
V12 I do not identify with the posture of the Company.
V13 I believe that the products/services of the Company help me define who I am.
V14 I believe that consuming products/services of the Company leads others to view me in a manner that I wish.
V15 I believe that consuming products of the Company helps me to be part of the social group to which I belong.
V16 I recognize myself in the Company.
V17 The decision to choose this Company is based on values that I judge to be important in my personal life.
V18 I can see no similarities between my identity and that of the Company.
V19 People who are important in my life identify with the values of the Company.
V20 Consuming products/services of this Company influences the image that I transmit to people that I know.
V21 I perceive that my main characteristics are highlighted by consuming products/services of the Company.
Having generated the items necessary to incorporate all the constructs involved in the measurement of the cognitive component of the consumer identification with the company, we continue to the second phase of the scale development process, which is concerned with the efforts in scale purification and validation.
Second
Phase
–
Scale
Purification
The purification of the scale was achieved by means of a survey composed of the 21 assertions accompanied by a 5-point Likert-type scale, as used by Mael (1988) in his original study. The target population was composed of management degree undergraduate students from three big universities (i.e., universities with more than 5,000 students) from two large Brazilian cities. The use of students was considered appropriate because of the objectives of this study, and also because previous authors from psychology, who addressed the self-concept, presented satisfactory results with student samples (e.g., Mael, 1988; Malhotra, 1981). Finally, since this paper aims to construct a scale and the objective of this process is to search for internal consistency of measurement, thus there is no need for a random sample of the population (Grace, 2005). The data were collected in February 2007, during which time a total of 218 questionnaires were completed and later analyzed.
A decision was made to use gradual suppression for the process of purifying the data, with the expectation that the exclusion of some variables might, by eliminating the perturbation provoked by a spurious and/or redundant variable, improve the reliability presented in the factor (Devellis, 1991).
The sample was composed of 218 individuals, but one did not complete the gender question, so the remaining were divided in 121 (55.5%) men and 96 (44%) women, a proportion equivalent to the population in question. All respondents were undergraduate students of administration, with a mean age of 22.8 years and mode 20 years. The age of these individuals was established between 18 and 65 years, with a standard deviation of 6.8 years. Of the sample obtained, 28% had a family income of under R$ 2,000 and 38.5% said their family earned more than R$ 5,000.00. Following the suggestions
of Hair, Anderson, Tatham and Black (1998) the sample size was considered adequate vis a vis the
Continuing with the appreciation of the descriptive statistics, assertions V3, V6, V7, V8, V16 and V19 presented averages that were statistically inferior to the center. With the knowledge that the questionnaire concerned the identification of an individual with a company and that the subject was asked to choose a company with which he/she identified, the concentration of cases of discordance might denote that the variable failed to adequately measure the construct, presenting a signal contrasting with that suggested by the theory. Variables V3, V7 and V8 were developed by Mael (1988) for measuring OI, and were elaborated and validated for a relationship that involves official membership, unlike the relationship between consumers and companies, the focus of this study (Bhattacharya & Sen, 2003; Bresser & Millonig, 2003). The results on these items jointly present clear evidence that the proposed level of relationship measured by these items was far from what the respondents considered to be normal, therefore leading them to respond negatively to these items of the scale.
Furthermore, variable V6, which concerns a criticism of the company as a personal offense, and variables V16 and V19, also did not appear to have captured the opinion of the respondents. Considering the characteristics of the generation process, all 6 assertions were redundant theoretically in relation to others that were maintained for later evaluation, specifically, the items V3, V7, V8, V6, V16 and V19 overlap with items V1, V2 and V10, corroborating their exclusion.
Before proceeding with the Exploratory Factor Analysis [EFA], the Kaiser-Meyer-Olkin indices and the Bartlett Spherical Test were analyzed. The calculated KMO at 0.669 was considered a satisfactory index (Hair, Anderson, Tatham, & Black, 2005), while the Bartlett Spherical Test showed significant correlations to a p < 0.001, denoting suitability of the factorial analysis in the generated items. The EFA was carried out using the principal components method, with VARIMAX rotation. The first exploratory factorial analysis initially identified 5 factors with an eigenvalue greater than 1, which explain 55.30% of the variance of the phenomenon under study. In this process, variables V15 and V18 were eliminated due to their low level of communality, a decision corroborated by the low internal consistency in their respective dimensions and by the theoretical overlap with other variables.
This process was repeated once more, resulting in the exclusion of 3 more items. The items V21, V17 and V5 all presented low correlation with the remaining items of the factor they were part of and also presented the lowest item-total correlation amidst the components of each factor. Furthermore, all the 3 variables were theoretically redundant with other items (i.e., V4, V9 and V11). A third factorial analysis indicated the exclusion of another two variables. The item V12 did not present satisfactory communality whereas the item V20 presented low item-item correlation with other members of the factor, the lowest item-total correlation, and theoretical overlap with variables V13 and V14, justifying its exclusion. Finally, a conclusive EFA was carried out on the survey instrument, consisting of the 8 items that had passed through the previously demonstrated filters. The KMO index and the Bartlett’s Spherical Test indicated the suitability of the technique for the sample of items and objects under analysis (KMO = 0.585 and significant correlations at p < 0.001).
In this last EFA, 4 distinct factors were generated with eigenvalues greater than unit, which together explain 69.43% of the variance, composed of variables that present factorial loads and commonalities greater than the floor. All the factors present significant levels of internal consistency, represented by high Cronbach Alpha indexes and item-item correlations. The item-total correlation index was not observed as all the factors were composed of two assertions, making the observation of this index redundant (Iacobucci & Duhachek, 2003).
Thus, the final rotation presented factorial loads varying between 0.76 and 0.86 and minimum commonality of 0.63. It is important to note, however, that though usually only Cronbach Alpha values greater than 0.70 are accepted, in the case of factors with only two variables, an acceptable index will lie between 0.40 and 0.60 (Iacobucci & Duhachek, 2003).
The first dimension of the construct, composed of the variables V4 and V9, represented 17.62% of the explained variance of the instrument, with an eingenvalue of 1.41. Both the components of the factor refer directly to the process of comparison and thesocial categorization performed by the individuals represents a facet of the process of identification.
. Factor 2 – Dimension related to solidarity and support for the company.
The second factor responds, with an eigenvalue of 1.40, for 17.55% of the extracted variance and is composed of variables V1 and V2. The questions refer to both the feeling of solidarity existing between the individual and the organization, with which he identifies, and the support of the consumer for the company, another side of the prism of consumer identification with the company.
. Factor 3 – Dimension related to the construction of self-concept.
The third dimension presented here contributed 17.43% of the explained variance, with an eigenvalue of 1.39. It was composed of items V13 and V14, intrinsically related to how the company, with its identity made apparent through its products and services, helps individuals build their self-concepts.
. Factor 4 – Dimension related to the shared characteristics between individual and the
company.
The two variables comprising this last factor reflect the sharing of characteristics and values between the consumer and the company with which he identifies, according to the definition proposed in the preceding chapter. The dimension presented a factorial load of 1.35, which rounded to an explained variance of 16.83%.
With this, the purification process outlined here resulted in a four-dimensional scale composed of 8 items, presented in order of extraction of the main components, as can be seen in Table 3.
Table 3:
Final Scale
V4 I act like a typical consumer of the Company, to a great extent.
V9 I don’t act like a typical consumer of the Company.
V1 When someone praises the Company, it feels like a personal compliment.
V2 I’m very interested in what others think about the Company.
V13 I believe that the products/services of the Company help me define who I am.
V14 I believe that consuming the products/services of the Company leads others to view me in the manner that I wish.
V10 Consuming the products/services of the Company highlights my personal characteristics.
V11 I believe that the Company cultivates the values that I hold in esteem.
Having conducted the purification process, the next logical step in our endeavor to generate the proposed scale, was to validate the scale and for that a Confirmatory factorial analysis was carried out with a new set of data, collected specially with this purpose in mind.
Third
Phase
–
Scale
Validation
during the previous stage. In order to perform this task, the model presented by Bhattacharya and Sen (2003) was used, assessing the suitability of the proposed scale for measuring the defined construct.
Therefore, a search for scales that might be of use in measuring the antecedents of consumer-company identification – similarity, distinctiveness, prestige and attractiveness of the identity – and the consequences of the phenomenon – loyalty, company promotion, customer recruitment, resilience to negative reports and greater reclamations against the company – was carried out (for more details see Bhattacharya and Sen (2003)). As suggested by Bhattacharya and Sen (2003), only a sample of the antecedents and consequences of the phenomena were used in order to assess the nomological validity of the scale. In this case, the research instrument was built up with scales of the antecedents similarity, distinctiveness and attractiveness, as well as of the consequences company promotion, loyalty and resilience to negative information. In the table below, the constructs and their respective scales used in the validation process are presented.
Table 4:
Scales Used for Validation
Construct Scales used
Similarity Bhattacharya and Sen (2003), Pieroway (2005) -and in-depth interviews
Distinctiveness Bhattacharya and Sen (2003) e Pieroway (2005)
Attractiveness Bhattacharya and Sen (2003), Pieroway (2005) and in-depth interviews
Loyalty Zeithaml, Berry and Parasuraman (1996)
Company promotion Babin, Lee, Kim and Griffin (2005), Bhattacharya and Sen (2003) and in-depth interviews
Resilience to negative information
Bhattacharya and Sen (2003), Koufaris and Hampton-Sosa (2004)
Following the first phase of the refinement process, the validity of the survey instrument was tested. The objective was to test whether the instrument measures the identification of the consumer with the company. Therefore, an effort was made to investigate whether the results of the measurement reflect the real differences between the objects or individuals in relation to assessed characteristics. For this study, content and construct validity were analyzed. The collection endeavor for the validation process occurred on May 2007 in 4 universities of 3 big cities in Brazil, resulting in 387 usable questionnaires. The sample that resulted was very similar to the first one used in the purification phase of the study, corroborating research expectancies. The sample was composed of 387 individuals (sample size in
accordance with inferior limits proposed in the literature (Hair et al., 1998)). The population was
composed of 225 (58.1%) men and 162 (41.8%) women, a proportion equivalent to the population in question. All respondents were undergraduate students of administration, with a mean age of 21.9 years and mode 19 years. The age of these individuals was between 17 and 42 years, with a standard deviation of 4.7 years. Of the sample obtained, 12% had family income less than R$ 2,000, and 47.5% said their family earned more than R$ 5,000.
It is worth noting that, in the present study, some cases of kurtosis were detected. However, there were few cases and they did not compromise the validity of the research findings. Therefore, the chi-squared test was performed together with other indexes, because this test is very sensitive to deviations from normality among observable variables (Bentler, 1984).
by gathering a set of items representative of the construct, based on a review of the literature on the subject.
The validity assessment also comprises the properties unidimensionality, reliability and the convergent and discriminant validity of the constructs of the measurement model represented by the scale being analyzed. Confirmatory factorial analysis was the technique employed for this purpose. The criterion used in the assessment of the unidimensionality took into consideration the test of the standardized residuals. According to Garver and Mentzer (1999) the researcher should be concerned with obtaining a small number of standardized residuals in relation to the indicators of each latent variable. Table 5 shows, in the last column, the highest values for each dimension, indicating high unidimensionality of the items, as the highest residuals found were lower than 0.2, indicating the quality of the tested scale.
Table 5:
Dimensionality and Scale Reliability
Factor 1 Shared Characteristics I
Factor 2 Solidarity
Factor 3 Self-concept
Factor 4 Shared Characteristics II
Eigenvalue 1.760 2.150 3.847 1.060
Cronbach’s Alpha 0.60 0.84 0.81 0.65
Explained Variance 11.52% 16.24% 48.1%. 7.51%
Major Residual 0.112 0.102 0.098 0.148
A new exploratory factorial analysis was performed and four factors were extracted, with the items presenting relatively high and distinct loads in their respective factors. The dimension related to the self-concept construct was the factor that most explained the total variance, with 48.1%. The second most explanatory factor was the dimension related to solidarity and support for the company, representing 16.24% of the total variance. Following this came the factors related to sharing characteristics with the consumers and between the individual and the company, with 11.52% and 7.51% of the variance respectively.
The Cronbach’s Alpha coefficient (Table 5) was calculated separately for the eight dimensions found. The calculation for all the items in the scale presented a value equal to 0.85. All the dimensions presented results of over 0.6.
Verification of the reliability and extracted variance, based on the sum of the standardized loads and measurement errors of the indicators, was also carried out, as the Cronbach’s Alpha coefficient becomes artificially inflated when the scale has a large number of items. Assessment of the finding indicated that the dimensions presented values for reliability and extracted variance greater than those suggested in the literature (from 0.50 for extracted variance and between 0.70 and 0.90 for reliability).
Table 6:
Reliability and Discriminant Validity Evidence of the Study Constructs
Factor 1
Shared Characteristics I
Factor 2 Solidarity
Factor 3 Self-concept
Factor 4 Shared Characteristics II
Composite Reliability 0.72 0.89 0.91 0.78
The convergent validity, attained when indicators that are supposed to measure the same phenomenon are correlated (Evrard, Pras, & Roux, 1993), was checked by using the test of the statistical significance of standardized factorial loads for each one of their manifest variables, based on their respective t-values (Bagozzi, 1994). The data confirm the convergent validity of all the dimensions. Nonetheless, two variables each registered a t-value close to the minimum required: the first item of factor 4 on the sharing of characteristics between the individual and the company
(Consuming the products/services of the Company highlights my personal characteristics) with a
t-value of 1.986; and the second item of factor on the sharing of characteristics with the consumers (I
don’t act like a typical consumer of this Company) with a t-value of 2.354.
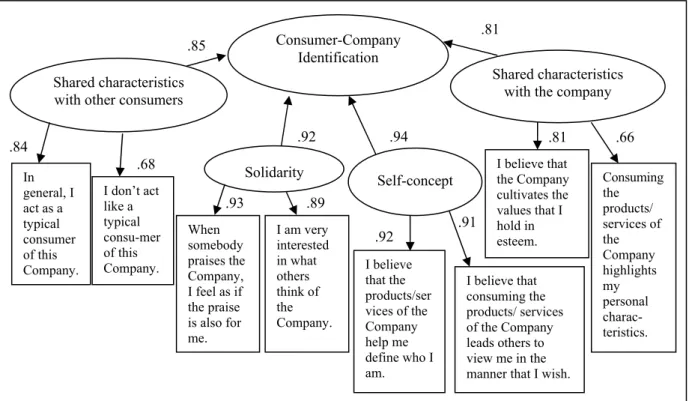
Figure 1. Modeling Consumer-Company Identification as a Higher Order Factor.
In order to assess discriminant validity, a procedure was carried out that consisted of comparing the extracted variance and the shared variances of the dimension (the squared correlation of the coefficient) with the other dimensions (Fornell & Larcker, 1981). The results corroborated the discriminant validity, to the degree that the dimensions appear to distinguish themselves, as all of them had greater extracted than shared variances.
The adjustment indexes obtained were satisfactory with values significantly greater than the accepted minimum. The possibility of re-specification, through the withdrawal of parameters, with the aim of enhancing the adjustment of the measure model, was considered, and the withdrawal of two variables (one at a time) by the Lagrange Multiplier [LM] test was recommended for suppression. The variables withdrawn were those that had displayed weak significance for convergent validity. Nevertheless, the enhancement fit of the model was insignificant, thus indicating the maintenance of these items. The table below shows the final adjustment indexes.
Shared characteristics with other consumers
Consumer-Company Identification
Shared characteristics with the company
Solidarity
Self-concept In
general, I act as a typical consumer of this Company.
I don’t act likea typical consu-mer of this Company. When somebody praises the Company, I feel as if the praise is also for me.
I am very interested in what others think of the Company. I believe that the products/ser vices of the Company help me define who I am. .68
.84
I believe that consuming the products/ services of the Company leads others to view me in the manner that I wish.
Table 7:
Goodness-of Fit Statistics
χ² (chi-square)
GL (Degrees of
Freedom)
CFI (Comparative Fit Index)
NFI (Normed Fit Index)
NNFI (NonNormed Fit
Index)
RMSEA (Root Mean Sq. Error of
Approx.)
252.44 (p=0.000)
121 0.96 0.95 0.948 0.061
It can be seen that all the indexes have acceptable values as indicated in the literature (Bagozzi, 1994). To complete the validation of the instrument for measuring the identification of the consumer with the company, a theoretical model was tested. Following Byrne’s (1994) recommendation, the estimation method chosen was the iteratively reweighted generalized least squares [ERLS], available in EQS software, which is not based on the prerogative of normality. In this model, the relationships between the construct of consumer-company identification was tested against some antecedents and consequences. These relationships are supported in the literature and a positive relationship would indicate the nomological validity of the construct.
The results of the analysis of the structural model can be seen in Table 8. The value of the chi-squared test is significant, although knowing that this test is very sensitive to diversions from normality and to samples of over 200, the analysis of the chi-squared should be done in composition
with other adjustment criteria (Hair et al., 2005). The adjustment indexes CFI, NFI, NNFI, all well
over 0.90, are considered quite satisfactory and the RMSEA of 0.06 is within the recommended values of 0.05 and 0.08, thus being acceptable.
Table 8:
Estimated Coefficients for the Antecedents (Similarity, Distinction and Attractiveness) and Consequences (WOM, Repurchase Intention and Resilience) of Consumer-Company Identification Construct
Antecedents Consequences
Similarity Distinction Attractiveness WOM Repurchase Resilience
Standardized Coefficients
0.31 (5.85)
0.27 (3.21) 0,15 (2,18) 0,35 (5,88)
0,32 (5,65) 0,28 (3,11)
R² 0.55 -
Note. a
Based on ERLS (iteratively reweighted generalized least squares) using EQS.
b
t-values between parentheses. Based on the two-tail test: t-values > 1.65 = p<0.05; and t-values> 2.33 = p<0.01. Significant coefficients are in bold (all at level 0.01).
These results provide nomological value to the construct of identification between the consumer and the company and constitute evidence of the importance of this measure in helping to explain some important phenomena in marketing (e.g., loyalty and company promotion).
After concluding the steps necessary for the development and validation of the proposed scale, we proceed to discuss the results encountered and the implications of this research effort.
DISCUSSION
ANDIMPLICATIONS
The objective of this study was to assess the nature and structure of the consumer-company identification phenomenon. Our research offers important implications for the measurement of consumer perceptions about his/her identification with a company. The present study contributes first with a clear and comprehensive definition of the identification construct embracing three fundamental characteristics - (1) feelings of solidarity in relation to the institution and support for the company, (2) the sharing of characteristics with the company and (3) the sharing of characteristics with other consumers of the company. This theoretical re-conceptualization requires new measures to assess all the underlying characteristics of the construct. Exploratory and confirmatory analysis shown that these three characteristics are represented by 4 underlying constructs, namely, the shared characteristics with consumers, the shared characteristics with the company, solidarity with the company, and the importance of the corporate identity for the construction of the self-concept.
The re-conceptualization of the construct suggests that currently available taxonomies and operational definitions cannot be accepted since they do not reflect the idiosyncrasies of the cognitive of complicity between consumer and company. Specifically, according to our view, identification is not a one-dimensional construct as previously proposed (Bhattacharya & Sen 2003). Because scales that were being used in studies do not cover the three basic characteristics of the identification construct, they cannot be considered adequate measures of the construct. Specifically, most of the studies in the marketing field have used two measures as a proxy of consumer-company identification – the visual scale of organizational identification proposed by Bergami and Bagozzi (2000) and a Euclidean Distance scale of comparison of individual versus organizational traits proposed by Brown and Dacin (1997) (e.g., Einwiller, Fedorikhin, Johnson, & Kamins, 2006; Lichtenstein, Drumwright, & Braig, 2004). Nevertheless, it is important to highlight that neither of these two measures was developed to assess specifically consumer-company identification. Actually, they were created to measure constructs that are related but still distinct from consumer-company identification. Notably, the Euclidean Distance scale embraces only one of the proposed characteristics of identification, i.e., the sharing characteristics with the company (see Brown & Dacin (1997) for more details). Second, since there is no scale, to our knowledge, that measures the remaining two characteristics of identification, namely feelings of solidarity and the sharing of characteristics with other consumers, it is impossible to assess the content and construct validity of the organizational identification visual scale proposed by Bergami and Bagozzi (2000). Therefore, the present scale is the first one that successfully measures all the dimensions underlying the consumer-company identification construct.
Regarding the structure elicited for measuring the consumer-company identification construct, the results indicate that the four dimensions of consumer-company identification are distinct, have discriminant validity, and warrant additional research attention. It is also important to acknowledge, however, that one of the dimensions of the identification construct (i.e., shared characteristics with the company) is conceptually related to one antecedent of identification (i.e., identity similarity). Close relationships between dimensions of a construct and its antecedents have already been noted in the identification literature (Cheney, 1982; Mael, 1988). Notwithstanding the support of prior works, we suggest that future researchers focus more on the discriminant validity between this attribute and the antecedent.
Researchers examining the antecedents and consequences of the identification of consumers toward a company may also benefit from investigating at the level of the individual dimensions. These research programs would treat consumer identification toward the company not as a homogeneous, one-dimensional phenomenon, but as consisting of four distinct dimensions. Following important
works on multi-dimensional constructs (e.g., Leach et al., 2009), future research should address
company as attractive in each transaction conducted probably accounts for the mildness of this effect. Company promotion, loyalty and resilience to negative information about the company emerged as significant consequences of the consumer-company identification construct. It posits relevant implications for academics and managers, as these consequence constructs reflect positive behaviors concerning the customer-company relationship.
Managerial practice can also benefit from the present work. Hildebrand and Slongo (2006) have already emphasized the importance of aligning corporate identity with consumers’ self-concepts in order to increase corporate institutional capital, a crucial factor for the survival of the company. In this sense, Bhattacharya and Sen (2003) suggest that consumer-company identification could be considered an important antecedent of loyalty behavior. Nevertheless, the literature has historically pinpointed only simple and singular factors and mechanisms in its search for the enhancement of consumer loyalty (Agustin & Jagdip, 2005). This research corroborates Bhattacharya and Sen’s (2003) propositions and positions consumer-company identification at the forefront of meaningful relationships between companies and consumers. The results of the present paper suggest that the higher-order motivator for relational exchanges – consumer-company identification – has important behavioral consequences such as loyalty, company promotion and resilience to negative information. In this way, managers in search of meaningful relationships with consumers should first identify characteristics and meanings that are valuable to their consumers and then attach these characteristics to its concept, aligning with consumers’ identities (for more details on strategies and tactics to align identities see Balmer & Greyser (2002) and Balmer (2009)).
The present study intended to propose taxonomy and its formalization to be useful by other researchers tracking a better explanatory power of the consumer behavior phenomenon. Our effort was to provide the apparatus for such an analysis, impetus for additional theories and clarification of such an obscure field. Our findings are limited because of lack of generalizability, cross-sectional nature and other factors, including common method variance and spurious cause-effect inferences. Despite these limitations, our results yield insight and tentative evidence for the consumer toward company identification.
REFERENCES
Aaker, D. A. (1996). Building strong brands. New York: Free Press.
Agustin, C., & Jagdip, S. (2005). Curvilinear effects of consumer loyalty determinants in relational
exchanges. Journal of Marketing Research, 42(1), 96–108.
Ashforth, B. E., & Mael, F. (1989). Social identity theory and the organization. Academy of
Management Review, 14(1), 20-40.
Babin, B., Lee, Y., Kim, E., & Griffin, M. (2005). Modeling consumer satisfaction and
word-of-mouth: restaurant patronage in Korea. The Journal of Services Marketing, 19(3), 133-139.
Bagozzi, R. P. (1994). Structural equations models in marketing research: basic principles. In R. P.
Bagozzi (Ed.), Principles of marketing research (pp. 317-385). Cambridge: Blackwell.
Balmer, J., & Gray, E. (1999). Corporate identity and communications: the antidote to merger
madness. Corporate Comunications: An International Journal, 4(4), 182-192.
Balmer, J. M. T. (2009). Corporate marketing: apocalypse, advent and epiphany, Management
Decision, 47(4), 544-572.
Balmer, J. M. T., & Greyser, S. A. (2002). Managing the multiple identities of the corporation,
Bardin, L. (1977). Content analysis. Lisboa: Edições 70.
Bentler, P. (1984). Some contributions to efficient statistics in structural models: specification and
estimation of moment structures. Psychometrika, 48(4), 493-517.
Bergamini, M., & Bagozzi, R. P. (2000). Self-categorization, affective commitment and self-esteem as
distinct aspects of social identity in organization. British Journal of Social Psychology, 39,
555-577.
Bhattacharya, C., & Sen, S. (2003). Consumer-company identification: a framework for understanding
consumers' relationships with companies. Journal of Marketing, 67(2), 76-88.
Bresser, R. K. F., & Millonig, K. (2003). Institutional capital: competitive advantage in light of the
new instiutionalism in organizational theory. Schmalenbach Business Review, 55, 220–241.
Brown, T., & Dacin, P. (1997). The Company and the Product: Corporate Associations and Consumer
Product Responses. Journal of Marketing, 61(1), 68-84.
Burke, K. (1950). A rhetoric of motives. Englewood Cliffs, NJ: Prentice-Hall.
Byrne, B. (1994). Structural equation modeling with EQS and EQS/Windows: basic concepts,
applications and programming. Thousand Oaks: Sage.
Cheney, G. (1982). Identification as process and product: a field study. Master's thesis, Purdue
University, West Lafayette, IN, USA.
Churchill, G. A. (1979). A paradigm for developing better measures of marketing constructs. Journal
of Marketing Research, 16(1), 64-73.
Cornwell, T. B., & Coote, L. V. (2005). Corporate sponsorship of cause: the role of identification in
purchase intent. Journal of Business Research, 58(3), 268-276.
Creamer, M., & Frazier, M. (2006). Wal-Mart seeks agency to burnish reputation. Advertising Age,
77(9), 359-361.
Devellis, R. F. (1991). Scale development: theory and applications. Newbury Park, CA: Sage
Publications.
Dutton, J. E., Dukerich, J. M., & Harquail, C. V. (1994). Organizational images and member
identification. Administrative Science Quarterly, 39(2), 239-263.
Einwiller, S., Fedorikhin, A., Johnson, A., & Kamins, M. (2006). Enough is enough! When
identification no longer prevents negative corporate associations. Journal of the Academy of
Marketing Science, 34(2), 185-194.
Evrard, Y., Pras, B., & Roux, E. (1993). Market – ètudes et recherches en marketing.
Paris: Nathen Éditions.
Fornell, C., & Larcker, D. (1981). Evaluating structural equation models with unobservable variables
and measurement error. Journal of Marketing Research, 18(1), 39-50.
Garver, M. S., & Mentzer, J. T. (1999). Logistics research methods: employing structural equation
modeling to test construct validity. Journal of Business Logistics, 20(1), 33-57.
Grace, D. (2005). Consumer disposition toward satisfaction (CDS): scale development and validation.
Journal of Marketing, Theory and Practice, 20, 20-31.
Grubb, E. L., & Grathwohl, H. L. (1967). Consumer self-concept, symbolism and market behavior: a
Hair, J., Anderson, R. E., Tatham, R., & Black, W. (1998). Multivariate data analysis. New Jersey: Prentice Hall.
Hair, J., Anderson, R. E., Tatham, R., & Black, W. (2005). Multivariate data analysis. New Jersey:
Prentice Hall.
Hildebrand, D. F. N., & Slongo, L. A. (2006, September). Aidentificação consumidor-empresa pelo
prisma institucional: o valor como capital para a empresa. Anais do Encontro Nacional da
Associação Nacional de Pós-Graduação e Pesquisa em Administração, Salvador, BA, Brazil,
30.
Iacobucci, D., & Duhachek, A. (2003). Advancing alpha: measuring reliability with confidence.
Journal of Consumer Psychology, 13(4), 478-87.
Koufaris, M., & Hampton-Sosa, W. (2004). The development of initial trust in an online company by
new customers. Information Management, 41(3), 377-397.
Leach, C. W., Zomeren, M. van, Zebel, S., Vliek, M. L. W., Pennekamp, S. F., Doosje, B., Ouwerkerk, J. W., & Spears, R. (2008). Group-Level self-definition and self-investment: a
hierarchical (multicomponent) model of in-group identification. Journal of Personality & Social
Psychology, 95(1), 144-165.
Lichtenstein, D., Drumwright, M., & Braig, B. (2004). The Effect of Corporate Social Responsibility
on Customer Donations to Corporate-Supported Nonprofits. Journal of Marketing, 68(4), 16-32.
Mael, F. A. (1988). Organizational identification: construct redefinition and a field application with
organizational alumni. Doctoral Thesis, Wayne State University, Detroit, MI, USA.
Mael, F. A., & Tetrick, L. E. (1992). Identifying organizacional identification. Educational and
Psychological Measurement, 52(4), 813-824.
Malhotra, N. (1981). A scale to measure self-concept, person concepts, and product concepts. Journal
of Marketing, 18(4), 456-464.
O’reilly, C., III, & Chatman, J. (1986). Organizational commitment and psychological attachment: the
effects of compliance, identification, and internalization on prosocial behavior. Journal of
Applied Psychology, 71(3), 492-499.
Oviatt, P. C. (2002). The measurement of organizational identification and organizational
commitment found among the membership of Mary Kay cosmetics. Master of Arts Thesis,
University of Nevada, Las Vegas, NV, USA.
Pieroway, S. (2005). An identification-based relationship marketing model: Conceptual development
and empirical investigation. Master Thesis, University of Calgary, Haskayne School of
Business, Calgary, Alberta, Canada.
Pratt, M. G. (1998). To be or not to be: central questions in organizational identification. In D. A.
Whetten & P. C. Godfrey (Eds.), Identity in organization: building theory through
conversations (pp.171-208). Thousand Oaks, CA: Sage Publications.
Reed, A., II (2002). Social identity as a useful perspective for self-concept-based consumer research.
Psychology and Marketing, 19(3), 235-266.
Riketta, M. (2004). Organizational identification: a meta-analysis. Journal of Vocational Behaviour,
66(2), 358-384.
Rossiter, J. R. (2002). The C-OAR-SE procedure for scale development in marketing. International
Scott, S. G., & Lane, V. R. (2000). A stakeholder approach to organizational identity. Academy of
Management Review,25(1), 43-62.
Sirgy, J. M. (1982). Self-concept in consumer behavior: a critical review. Journal of Consumer
Research, 9(3), 287-300.
Stein, J., & Mcveigh, P. (2006). Hyundai Europe wants to fine-tune its identity. Automotive News
Europe, 11(4).
Swanson, S. R., & Davis, J. C. (2006). Arts patronage: a social identity perspective. Journal of
Marketing Theory and Practice, 14(2), 125-38.
Tajfel, H., & Turner, J. C. (1982). The social identity theory of intergroup behavior. Annual Review of
Psychology, 33, 1-39.
Tolman, E. C. (1943). Identification and the post-war world. Journal of Abnormal and Social
Psychological, 38(2), 141-148.
Whetten, D. A., & Godfrey, P. C. (1998). Identity in organization: building theory through
conversations. Thousand Oaks, CA: Sage Publications.
Winer, R. S. (1999). Experimentation in the 21st century: the importance of external validity. Journal
of the Academy of Marketing Science, 27(3), 349-358.
Zaltman, G. (1997). Rethinking market research: putting people back. Journal of Marketing Research,
34(4), 424-437.
Zeithaml, V. A., Berry, L. L., & Parasuraman, A. (1996). The Behavioral consequences of service