Cytogenomic assessment of the diagnosis of 93 patients
with developmental delay and multiple congenital
abnormalities: The Brazilian experience
E´velin Aline Zanardo,I,*Roberta Lelis Dutra,IFlavia Balbo Piazzon,IAlexandre Torchio Dias,IGil Monteiro
Novo-Filho,I Amom Mendes Nascimento,I Marı´lia Moreira Montenegro,IJullian Gabriel Damasceno,I
Fabrı´cia Andreia Rosa Madia,I Thaı´s Virgı´nia Moura Machado da Costa,I Maria Isabel Melaragno,II
Chong Ae Kim,III Leslie Domenici KulikowskiI
ILaboratorio de Citogenomica, Departamento de Patologia, Faculdade de Medicina FMUSP, Universidade de Sao Paulo, Sao Paulo, SP, BR.IIDepartamento de Morfologia e Genetica, Universidade Federal de Sao Paulo, Sao Paulo, SP, BR.IIIUnidade de Genetica, Departamento de Pediatria, Instituto da Crianca, Hospital das Clinicas HCFMUSP, Faculdade de Medicina, Universidade de Sao Paulo, Sao Paulo, SP, BR.
OBJECTIVE:The human genome contains several types of variations, such as copy number variations, that can generate specific clinical abnormalities. Different techniques are used to detect these changes, and obtaining an unequivocal diagnosis is important to understand the physiopathology of the diseases. The objective of this study was to assess the diagnostic capacity of multiplex ligation-dependent probe amplification and array techniques for etiologic diagnosis of syndromic patients.
METHODS:We analyzed 93 patients with developmental delay and multiple congenital abnormalities using multiplex ligation-dependent probe amplifications and arrays.
RESULTS: Multiplex ligation-dependent probe amplification using different kits revealed several changes in approximately 33.3% of patients. The use of arrays with different platforms showed an approximately 53.75% detection rate for at least one pathogenic change and a 46.25% detection rate for patients with benign changes. A concomitant assessment of the two techniques showed an approximately 97.8% rate of con-cordance, although the results were not the same in all cases. In contrast with the array results, the MLPA technique detectedB70.6% of pathogenic changes.
CONCLUSION:The obtained results corroborated data reported in the literature, but the overall detection rate was higher than the rates previously reported, due in part to the criteria used to select patients. Although arrays are the most efficient tool for diagnosis, they are not always suitable as a first-line diagnostic approach because of their high cost for large-scale use in developing countries. Thus, clinical and laboratory interactions with skilled technicians are required to target patients for the most effective and beneficial molecular diagnosis.
KEYWORDS: Cytogenomic Techniques; MLPA; Array; Developmental Delay; Multiple Congenital Abnormalities.
Zanardo EA, Dutra RL, Piazzon FB, Dias AT, Novo-Filho GM, Nascimento AM, et al. Cytogenomic assessment of the diagnosis of 93 patients with developmental delay and multiple congenital abnormalities: The Brazilian experience. Clinics. 2017;72(9):526-537
Received for publication onDecember 14, 2016;First review completed onFebruary 21, 2017;Accepted for publication onMay 4, 2017 *Corresponding author. E-mail: evelinzanardo@yahoo.com.br
’ INTRODUCTION
The human genome contains several types of structural variations that contribute to genetic diversity and disease susceptibility (1,2). These structural variations include single nucleotide alterations, such as point mutations or SNPs (single nucleotide polymorphisms), small InDels, and copy number variations (CNVs) (1,3).
CNVs are the most prevalent type of structural variation in the human genome and can affect the transcription rate, sequence, structure, and function of genes. These genomic variations include a range of deletions and duplications larger than 1 kb and up to several Mb (1,2).
Although these variations often represent only small genomic segments, they can generate several specific clinical abnormalities, such as developmental delay (DD) and multi-ple congenital abnormalities (MCAs) (1-4). However, the etiology of these disorders is not well understood, making genetic counseling and treatment difficult (1,2,5).
Different cytogenomic techniques have been used to detect these changes, including the MLPA (multi-plex ligation-dependent probe amplification) and array techniques (1,6,7).
DOI:10.6061/clinics/2017(09)02
Copyright&2017CLINICS–This is an Open Access article distributed under the terms of the Creative Commons License (http://creativecommons.org/licenses/by/ 4.0/) which permits unrestricted use, distribution, and reproduction in any medium or format, provided the original work is properly cited.
No potential conflict of interest was reported.
526
MLPA is a technique that is used to detect deletions and duplications in genetic diseases of interest, such as the most common microdeletion/microduplication syndromes and subtelomeric regions (8,9).
This method is considered a faster alternative and is more economically viable than other molecular techniques (3,10), and it allows quantitative genomic screening of target-specific sequences through simultaneous hybridization and amplifica-tion via polymerase chain reacamplifica-tion (PCR) using more than 50 different probes in a single reaction (3,8,11,12).
The screening of specific submicroscopic changes via MLPA detects abnormalities in 5 to 10% of patients with a normal conventional karyotype (13-15). Thus, in a single test, the MLPA evaluates patients with characteristics of microdele-tion/microduplication syndromes and/or patients with suspected subtelomeric abnormalities (9,15-18).
Although MLPA allows the evaluation of multiple dif-ferent genomic regions, the main limitation of this technique is the need for a clinical hypothesis to direct the selection of a specific kit for analysis (3,8). In contrast, the array technique does not require a specific clinical diagnosis before use.
The array technique permits the assessment of the CNVs present in the whole genome of a patient in a single reaction with a high level of resolution (B0.7 kb), depending on the platform, types of probes and how they are distributed in the genome, thus increasing the detection rate of complex imbalances (4,19,20).
This technique involves the hybridization of probes to complementary DNA (genomic sequence segments) on a slide or chip array and subsequent analysis of the fluores-cence annealed to the target DNA sequences using specific software (7,21).
Currently, there are several companies that offer this technology on different platforms, offering slides or chips with a high density or coverage of the genome. However, these platforms vary in the number of probes used, and several of them can interrogate millions of regions in a single sample (4,7,20,22,23).
The main advantage of the array technique is the ability to investigate the entire genome in a single experiment with higher resolution and accuracy compared with traditional and molecular cytogenetics, as this allows the investigation of small changes that may have an impact on the phenotype of patients without a definitive clinical diagnosis (19,22,24).
Thus, arrays have been employed to diagnose patients with DD and MCAs as well as normal karyotypes, increas-ing the detection rate of small genomic imbalances and the diagnosis of patients with clinical phenotypes of unknown etiology (22,25).
The main limitations of the array technique are the high cost of large-scale application for developing countries, the experimental time required (3-5 days), and the expertise required for classification of the results (CNVs), which can only be interpreted by a highly qualified professional (25-27). An unequivocal diagnosis is fundamental to provid-ing suitable answers regardprovid-ing the prognosis and risk of recurrence and can contribute to improving public health policy (2,25,28).
In developed countries, the array technique is already being used as the first-line molecular diagnostic test in patients with MCA (28,29). Recently, Brazil has modified its policies in the field of genetics, including the clinical genetics policy guidelines of theSistema Único de Saúde(SUS), and has
pro-vided financial incentives to cover the costs of genetic testing
and counseling in the national health network (http:// bvsms.saude.gov.br/bvs/publicacoes/diretrizes_atencao_ integral_pessoa_doencas_raras_SUS.pdf).
Thus, genetic services must study the best strategies for molecular assessment to diagnose each patient referred with DD and MCA, as the introduction of a single molecular diagnostic method, such as array technology, as a first-line assessment method for patients with DD and MCA is impractical in Brazil due to insufficient public investment in the health care system and because low-income patients cannot afford such tests.
In this study, we report our experience with the imple-mentation and assessment of MLPA using different kits, array platforms (Affymetrix, Agilent and Illumina), and probe densities for the molecular diagnostic and scientific analysis of 93 Brazilian patients with DD and MCA.
’ MATERIALS AND METHODS
This study involved 93 patients who were evaluated using MLPA and array techniques. The patients presented with DD and MCAs, such as minor facial anomalies, including a high forehead, frontal bossing, broad nasal bridge, low-set ears, ocular hypertelorism, and abnormalities of the eyes, as well as major congenital defects, such as skeletal and genital malformations, heart defects, and structural brain abnormalities.
All patients were previously assessed through conven-tional cytogenetic analysis to identify their numerical and structural chromosomal abnormalities; metaphase chromo-somes were obtained from peripheral blood lymphocyte samples the patients, and G-banding analysis was performed using standard procedures. In each case, twenty metaphase chromosomes were analyzed at a 550-chromosome band resolution (X5 Mb) and then classified according to the
International System for Human Cytogenetic Nomenclature 2013 (ISCN) guidelines.
Genomic DNA was isolated from 3 mL of peripheral whole blood from patients using a commercially available DNA isolation kit (QIAamp DNA Blood Mini Kits, Qiagen,
Hilden, Germany) according to the manufacturer’s
instruc-tions. The quality and quantity of the DNA samples were determined using a Qubits 2.0 Fluorometer (Invitrogen,
Carlsbad, California, USA), and the integrity of the DNA was ascertained via agarose gel electrophoresis analysis.
All of the genomic DNAs were screened with the following three MLPA kits: for the most common microdele-tion/microduplication syndromes, the SALSA MLPA probe-mix P064-B2 Mental Retardation-1 kit was employed, which includes probes for the 1p36 deletion, Williams-Beuren, Smith-Magenis, Miller-Dieker, 22q11.2 deletion, Prader-Willi/ Angelman, Alagille, Saethre-Chotzen, and Sotos syndromes; for subtelomeric imbalances, the SALSA MLPA probemix P036-E1 Human Telomere-3 and SALSA MLPA probemix P070-B2 Human Telomere-5 kits were used, which include subtelomeric probes for all chromosomes (MRC-Holland, Amsterdam, Netherlands).
In several cases, the patients’genomic DNA samples were
also assessed using specific MLPA kits to confirm the observed changes. The kits used in these cases were the SALSA MLPA probemix P250-B1 DiGeorge and SALSA MLPA probemix P356-A1 Chromosome 22q kits, which are specific for chromosome 22, and the SALSA MLPA probemix P029-A1 Williams-Beuren Syndrome kit, which is specific for
527
changes in chromosome 7q11 (MRC-Holland, Amsterdam, Netherlands).
DNA denaturation, hybridization of probes, ligation, and PCR were performed according to the manufacturer’s
instructions, as described by Schouten et al. (11). Separation of the amplification products via electrophoresis was per-formed using an ABI 3500 Genetic Analyzer (Thermo Fisher Scientific, Waltham, Massachusetts, USA), and the data were analyzed using GeneMarker software, version 1.6 (www. softgenetics.com-Softgenetics, State College, Pennsylvania, USA).
The peak area of each fragment was compared with that of a control sample, and the results were considered abnormal when the relative peak-height ratio was less than 0.75 (deletion) or greater than 1.25 (duplication). The details of the regions and probes detected by each kit can be found at www.mlpa.com.
The arrays were employed on three different platforms, from Agilent Technologies (Santa Clara, California, USA), Affymetrix (Santa Clara, California, USA) and Illumina (San Diego, California, USA), which differ in the technology used. On the Agilent platform, we used the Human Genome CGH Microarray 2x10⁵K slide, containing 105,750 probes with an average spacing of 22 kb, the SurePrint G3 Human CGH Microarray 4x180K slide, containing 180,880 probes distributed throughout the genome with an average spacing of 13 kb, and the SurePrint G3 Human CGH Microarray 8x60K slide, containing 62,976 probes with an average spacing of 41 kb.
On the Affymetrix platform, we used the Affymetrix Genome-Wide Human SNP Array 6.0 chip (1.8 million genetic markers), which contains 906,600 single-nucleotide polymorphism (SNP) probes and over 946,000 probes for the detection of CNVs, with a median physical inter-marker distance of 1-5 kb, as well as the CytoScan HD chip, which contains 2,696,550 CNV probes and 749,157 SNP probes, with an average spacing of 1.1 kb.
On the Illumina platform, we employed the HumanCy-toSNP-12 BeadChip, with 300,000 oligonucleotide probes and an average spacing of 9.7 kb, and the CytoSNP-850K, with 843,888 markers and an average probe spacing of 1.8 kb across the whole array.
In all samples, amplification, hybridization, staining and washing were performed according to the manufacturers’
protocols, and the data were extracted by a specific scanner. The CGH arrays are based on the principle of comparison between the signal intensities of a sample and commercially acquired human male control DNA (Promega Corporation, Madison, Wisconsin, USA). For the SNP arrays (Affymetrix) and bead arrays (Illumina), only a single hybridization is performed for the patient DNA, and the signal intensities are then compared with a reference dataset based on pre-run reference samples.
The raw data were analyzed using Feature Extraction v9.5, Affymetrix Chromosome Analysis Suite (ChAS) v.1.2, or KaryoStudio v1.4.3.0 Build 37 software. The data were normalized, and log2ratios were calculated by dividing the
normalized intensity of the sample by the mean intensity across the reference sample.
The criteria used to determine a CNV included the involv-ement of at least five consecutive probes sets in a region and log2 ratio cut-offs of -0.41 and +0.32 for loss and gain, respectively. The software produced graphical representa-tions of CNV breakpoints for each sample.
The SNP and bead arrays supply the B allele frequency (BAF), which represents the proportion of B alleles in the genotype. A region without evidence of CNVs should show a log2ratio near zero and three BAF clusters of 0, 0.5,
and 1, corresponding to the AA, AB, and BB genotypes, respectively.
All samples were evaluated and were found to be in accordance with the quality standards.
The results were analyzed according to the American College of Medical Genetics guidelines (30) using indepen-dent tests and were compared with the following databanks of CNVs and classified as benign, pathogenic or VOUS (variants of uncertain clinical significance): the Database of Genomic Variants (DGV–http://projects.tcag.ca/variation/),
the Database of Chromosomal Imbalance and Phenotype in Humans Using Ensembl Resources (DECIPHER – http://
decipher.sanger.ac.uk/) and the UCSC Genome Bioinfor-matics database (http://genome.ucsc.edu). The genomic positions are reported according to their mapping on the GRCh37/hg19 genome build.
Ethics
The Research Ethics Committee of the Hospital das Clínicas da Faculdade de Medicina da Universidade de São Paulo (HC-FMUSP) approved this study, and written informed consent for publication was obtained from the parents of the patients (CAPPesq no
0619/11).
’ RESULTS
In this study, we assessed 93 patients with DD and MCAs via the MLPA and array techniques. The patients showed either a normal karyotype or a karyotype with an undeter-mined abnormality according to G-banding, which made it impossible to obtain a conclusive diagnosis.
We found thatB97.8% (91/93) of the results from the two methods were consistent with each other (all results are described in Table 1). Among the evaluated patients,B13.2% (12/91) showed no alterations according to either technique; B54.9% (50/91) only showed changes in the array analysis; andB39.9% (29/91) of the patients showed CNVs according to both techniques (Figure 1).
One case with inconclusive results was found in our cohort, and further evaluation using other molecular techniques should be performed to definitively diagnose this patient. Although the changes observed using both techniques were consistent, the breakpoint determined by the array did not correspond exactly to the genomic locali-zation of the MLPA probe, and there were several array probes between these two probes.
The MLPA results were inconsistent with the array results in two cases. We found a duplication in theFZD9gene in one
case (P064 and P029), and in the other, we identified two alterations (del 16p13.3 with the P036 kit and del 19p13.3 with the P070 kit) using MLPA, which were confirmed via independent reactions. However, these alterations were not identified with the array because none of the array probes are located at exactly the same position as the MLPA probe. Several of the MLPA results were inconclusive, but this did not affect the comparison of the techniques because the regions targeted by MLPA were repeated in several of the kits used in this study. Thus, the results were concordant, and although the results were not the same in all cases, the
528 Cytogenomic assessment of 93 patients with DD/MCA
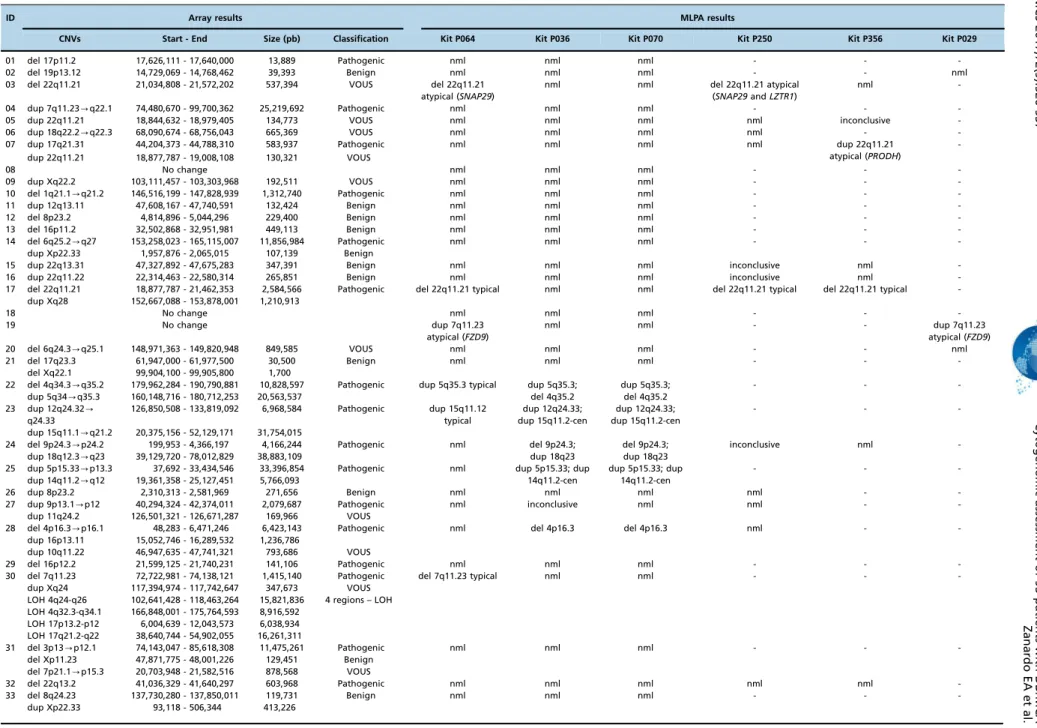
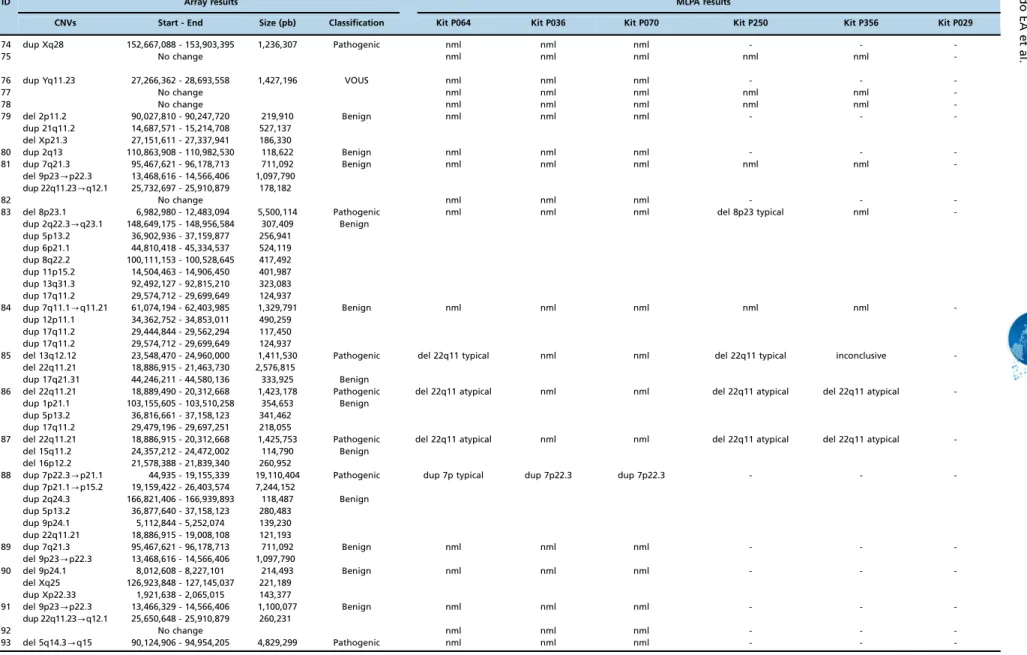
Table 1-Description of cytogenomic results obtained via the MLPA and array techniques.
ID Array results MLPA results
CNVs Start - End Size (pb) Classification Kit P064 Kit P036 Kit P070 Kit P250 Kit P356 Kit P029
01 del 17p11.2 17,626,111 - 17,640,000 13,889 Pathogenic nml nml nml - -
-02 del 19p13.12 14,729,069 - 14,768,462 39,393 Benign nml nml nml - - nml
03 del 22q11.21 21,034,808 - 21,572,202 537,394 VOUS del 22q11.21
atypical (SNAP29)
nml nml del 22q11.21 atypical
(SNAP29andLZTR1)
nml
-04 dup 7q11.23-q22.1 74,480,670 - 99,700,362 25,219,692 Pathogenic nml nml nml - -
-05 dup 22q11.21 18,844,632 - 18,979,405 134,773 VOUS nml nml nml nml inconclusive
-06 dup 18q22.2-q22.3 68,090,674 - 68,756,043 665,369 VOUS nml nml nml nml -
-07 dup 17q21.31 44,204,373 - 44,788,310 583,937 Pathogenic nml nml nml nml dup 22q11.21
atypical (PRODH)
-dup 22q11.21 18,877,787 - 19,008,108 130,321 VOUS
08 No change nml nml nml - -
-09 dup Xq22.2 103,111,457 - 103,303,968 192,511 VOUS nml nml nml - -
-10 del 1q21.1-q21.2 146,516,199 - 147,828,939 1,312,740 Pathogenic nml nml nml - -
-11 dup 12q13.11 47,608,167 - 47,740,591 132,424 Benign nml nml nml - -
-12 del 8p23.2 4,814,896 - 5,044,296 229,400 Benign nml nml nml - -
-13 del 16p11.2 32,502,868 - 32,951,981 449,113 Benign nml nml nml - -
-14 del 6q25.2-q27 153,258,023 - 165,115,007 11,856,984 Pathogenic nml nml nml - -
-dup Xp22.33 1,957,876 - 2,065,015 107,139 Benign
15 dup 22q13.31 47,327,892 - 47,675,283 347,391 Benign nml nml nml inconclusive nml
-16 dup 22q11.22 22,314,463 - 22,580,314 265,851 Benign nml nml nml inconclusive nml
-17 del 22q11.21 18,877,787 - 21,462,353 2,584,566 Pathogenic del 22q11.21 typical nml nml del 22q11.21 typical del 22q11.21 typical
-dup Xq28 152,667,088 - 153,878,001 1,210,913
18 No change nml nml nml - -
-19 No change dup 7q11.23
atypical (FZD9)
nml nml - - dup 7q11.23
atypical (FZD9)
20 del 6q24.3-q25.1 148,971,363 - 149,820,948 849,585 VOUS nml nml nml - - nml
21 del 17q23.3 61,947,000 - 61,977,500 30,500 Benign nml nml nml - -
-del Xq22.1 99,904,100 - 99,905,800 1,700
22 del 4q34.3-q35.2 179,962,284 - 190,790,881 10,828,597 Pathogenic dup 5q35.3 typical dup 5q35.3;
del 4q35.2
dup 5q35.3; del 4q35.2
- -
-dup 5q34-q35.3 160,148,716 - 180,712,253 20,563,537
23 dup 12q24.32
-q24.33
126,850,508 - 133,819,092 6,968,584 Pathogenic dup 15q11.12
typical
dup 12q24.33; dup 15q11.2-cen
dup 12q24.33; dup 15q11.2-cen
- -
-dup 15q11.1-q21.2 20,375,156 - 52,129,171 31,754,015
24 del 9p24.3-p24.2 199,953 - 4,366,197 4,166,244 Pathogenic nml del 9p24.3;
dup 18q23
del 9p24.3; dup 18q23
inconclusive nml
-dup 18q12.3-q23 39,129,720 - 78,012,829 38,883,109
25 dup 5p15.33-p13.3 37,692 - 33,434,546 33,396,854 Pathogenic nml dup 5p15.33; dup
14q11.2-cen
dup 5p15.33; dup 14q11.2-cen
- -
-dup 14q11.2-q12 19,361,358 - 25,127,451 5,766,093
26 dup 8p23.2 2,310,313 - 2,581,969 271,656 Benign nml nml nml nml -
-27 dup 9p13.1-p12 40,294,324 - 42,374,011 2,079,687 Pathogenic nml inconclusive nml nml -
-dup 11q24.2 126,501,321 - 126,671,287 169,966 VOUS
28 del 4p16.3-p16.1 48,283 - 6,471,246 6,423,143 Pathogenic nml del 4p16.3 del 4p16.3 nml -
-dup 16p13.11 15,052,746 - 16,289,532 1,236,786
dup 10q11.22 46,947,635 - 47,741,321 793,686 VOUS
29 del 16p12.2 21,599,125 - 21,740,231 141,106 Pathogenic nml nml nml - -
-30 del 7q11.23 72,722,981 - 74,138,121 1,415,140 Pathogenic del 7q11.23 typical nml nml - -
-dup Xq24 117,394,974 - 117,742,647 347,673 VOUS
LOH 4q24-q26 102,641,428 - 118,463,264 15,821,836 4 regions – LOH
LOH 4q32.3-q34.1 166,848,001 - 175,764,593 8,916,592
LOH 17p13.2-p12 6,004,639 - 12,043,573 6,038,934
LOH 17q21.2-q22 38,640,744 - 54,902,055 16,261,311
31 del 3p13-p12.1 74,143,047 - 85,618,308 11,475,261 Pathogenic nml nml nml - -
-del Xp11.23 47,871,775 - 48,001,226 129,451 Benign
del 7p21.1-p15.3 20,703,948 - 21,582,516 878,568 VOUS
32 del 22q13.2 41,036,329 - 41,640,297 603,968 Pathogenic nml nml nml nml nml
-33 del 8q24.23 137,730,280 - 137,850,011 119,731 Benign nml nml nml - -
-dup Xp22.33 93,118 - 506,344 413,226
529
CLINICS
2017;72(
9):526-537
Cytogeno
mic
assessme
nt
of
93
patients
with
DD/MC
A
Zanardo
EA
et
Table 1 -Continued.
ID Array results MLPA results
CNVs Start - End Size (pb) Classification Kit P064 Kit P036 Kit P070 Kit P250 Kit P356 Kit P029
34 del 8p23.2-p23.1 6,143,107 - 6,248,244 105,137 Benign nml nml nml - -
-dup 10q11.21 45,212,898 - 45,359,483 146,585
35 dup Xp22.31-p22.2 9,353,507 - 9,546,184 192,677 Benign nml nml nml - -
-dup Xp22.2 11,047,140 - 11,608,207 561,067
36 dup 15q26.3 100,351,154 - 100,589,056 237,902 Benign nml nml nml - -
-LOH 3p22.1-p11.1 41,897,482 - 90,442,925 48,545,443 10 regions – LOH
LOH 3q11.1-q11.2 93,632,889 - 97,474,630 3,841,741
LOH 6q21-q25.1 107,328,319 - 149,605,182 42,276,863
LOH 6q25.3-q27 156,586,155 - 170,898,549 14,312,394
LOH 10q26.12-q26.3 122,697,234 - 131,869,597 9,172,363
LOH 13q32.1-q33.1 95,842,069 - 102,302,850 6,460,781
LOH 13q33.2-q34 106,386,553 - 115,106,996 8,720,443
LOH 16p13.13-p12.1 11,761,688 - 27,853,219 16,091,531
LOH 19p13.2-p13.11 8,386,306 - 16,372,158 7,985,852
LOH 20p12.2-p12.1 10,082,476 - 15,254,051 5,171,575
37 del 4q32.1-q35.2 161,623,467 - 190,880,409 29,256,942 Pathogenic nml del 4q35.2 del 4q35.2 - -
-dup 5p15.2 13,798,819 - 14,177,667 378,848
38 del 2p11.2 90,027,810 - 90,247,720 219,910 Benign nml nml nml - -
-39 del 2q37.3 239,550,182 - 243,029,573 3,479,391 Pathogenic dup 5q35.3 typical del 2q37.3;
dup 5q35.3
del 2q37.3; dup 5q35.3
- -
-dup 5q35.1-q35.3 172,176,461 - 180,705,539 8,529,078
40 dup 10q11.22 47,087,371 - 47,756,480 669,109 Pathogenic nml nml nml nml nml
-dup 22q13.31 47,330,328 - 47,675,283 344,955 Benign
41 del 9p23-p22.3 13,468,616 - 14,566,406 1,097,790 Benign nml nml nml nml nml
-42 del 7p22.3 45,130 - 1,691,646 1,646,516 Pathogenic nml del 7p22.3;
dup 12q24.33
del 7p22.3; dup 12q24.33
- -
-dup 12q24.22
-q24.33
116,878,379 - 133,819,092 16,940,713
43 dup 5p15.33 71,904 - 2,425,306 2,353,402 Pathogenic nml dup 5p15.33;
del Yq12
dup 5p15.33; del Yq12
- -
-del Yq11.221-q12 19,571,776 - 59,311,250 39,739,474
44 dup 3q26.31-q29 174,466,591 - 197,845,254 23,378,663 Pathogenic nml dup 3q29;
del 9p24.3
dup 3q29; del 9p24.3
- -
-del 9p24.3-p23 204,104 - 11,659,355 11,455,251
45 del 17p13.3 148,092 - 2,310,571 2,162,479 Pathogenic del 17p13.3 atypical
(HICandMETTL16)
del 17p13.3; dup 17q25.3
del 17p13.3; dup 17q25.3
- -
-dup 17q25.1-q25.3 74,307,023 - 80,943,189 6,636,166
46 del 2q33.1 203,291,000 - 203,312,000 21,000 Benign nml nml nml - -
-del 3q28 189,360,000 - 189,364,000 4,000
LOH Xq21.1 78,667,293 - 82,400,000 3,732,707 1 region – LOH
47 del 1q25.3 180,300,936 - 180,394,157 93,221 VOUS nml nml nml - -
-dup 3q22.1 129,676,581 - 129,896,364 219,783
del 9p21.1 32,562,410 - 32,615,311 52,901
48 dup 9p11.2 41,692,304 - 44,244,868 2,552,564 Pathogenic nml nml nml - -
-del 9p11.2 44,727,846 - 44,824,251 96,405 Benign
dup 9p11.2 44,864,687 - 45,723,022 858,335 VOUS
49 del 1p36.33-p36.32 564,620 - 2,456,203 1,891,583 Pathogenic del 1p36 atypical
(TP73nml)
del 1p36.33 del 1p36.33 - -
-del 1p36.32 2,473,257 - 3,446,813 973,556
dup 1p36.32 3,474,630 - 3,641,681 167,051
50 del 8q24.23 137,730,280 - 137,850,011 119,731 Benign nml nml nml - -
-dup 7q11.22 71,021,037 - 71,272,257 251,220
51 del 8q24.23 137,730,280 - 137,850,011 119,731 Benign nml nml nml - -
-dup 14q11.2 20,213,937 - 20,379,392 165,455
LOH 7p15.1-p12.1 28,698,698 - 52,857,194 24,158,496 8 regions – LOH
LOH 8p23.1-p22 8,105,359 - 18,289,407 10,184,048
LOH 8q23.3-q24.23 114,783,837 - 137,679,805 22,895,968
LOH 8q24.23-q24.3 137,900,733 - 146,293,086 8,392,353
LOH 9q32-q34.11 115,745,240 - 130,633,433 14,888,193
LOH 17p13.3-13.1 53,011 - 9,193,945 9,140,934
530
Cytogeno
mic
assessment
of
93
patients
with
DD/MCA
Zanardo
EA
et
al.
CLINICS
2017;72(
Table 1 -Continued.
ID Array results MLPA results
CNVs Start - End Size (pb) Classification Kit P064 Kit P036 Kit P070 Kit P250 Kit P356 Kit P029
LOH 22q12.3-q13.1 33,850,168 - 40,864,782 7,014,614
LOH 22q13.31-q13.33 45,136,360 - 51,169,045 6,032,685
52 dup 4q28.3 131,880,992 - 132,305,574 424,582 Benign nml nml nml - -
-del 22q11.23-q12.1 25,732,697 - 25,910,879 178,182
dup Xq22.2 103,179,170 - 103,303,968 124,798 VOUS
53 del Xp22.13
-p22.12
18,179,714 - 19,719,264 1,539,550 Pathogenic nml nml nml - -
-54 dup 14q32.33 106,067,618 -106,823,886 756,268 Pathogenic nml nml nml - -
-dup 7q11.23 76,143,705 - 76,615,349 471,644 Benign
del 5q12.1 59,209,183 - 59,522,613 313,430 VOUS
55 del 4q35.1-q35.2 185,821,036 - 190,880,409 5,059,373 Pathogenic nml del 4q35.2;
dup Xq28
del 4q35.2; dup Xq28
- -
-dup Xq27.1-q28 139,513,770 - 154,929,412 15,415,642
dup Xp22.33 2,139,005 - 2,319,653 180,648 Benign
dup Xq28 154,939,018 - 155,235,833 296,815
56 dup 9p24-p23 46,587 - 13,014,232 12,967,645 Pathogenic nml dup 9p24.3;
del 18q23
dup 9p24.3; del 18q23
nml nml
-del 18q22-q23 70,657,389 - 78,014,582 7,357,193
dup Xp22.31 7,811,750 - 8,115,453 303,703 Benign
57 del 2q37.3 239,550,182 - 243,029,573 3,479,391 Pathogenic dup 5q35.3 typical del 2q37.3;
dup 5q35.3
del 2q37.3; dup 5q35.3
- -
-dup 5q35.1-q35.3 172,246,068 - 180,705,539 8,459,471
dup 18q12.1 27,778,530 - 28,050,968 272,438 Benign
58 del 4p16.3-p16.1 48,283 - 9,370,908 9,322,625 Pathogenic nml del 4p16.3;
dup 8p23.3
del 4p16.3; dup 8p23.3
- -
-dup 8p23.3-p23.1 176,818 - 6,974,050 6,797,232
59 dup 4q26-q35.2 118,777,687 - 190,880,409 72,102,722 Pathogenic nml dup 4q35.2;
del 7q36.3
dup 4q35.2; del 7q36.3
- -
-dup 6q27 168,329,404 - 168,612,631 283,227 Benign
del 7p21.2 14,436,385 - 14,737,999 301,614 VOUS
del 7q36.3 158,498,994 - 159,119,486 620,492
60 dup 6p22.3-p12.3 24,247,896 - 50,203,633 25,955,737 Pathogenic nml nml nml - -
-dup 2q22.2-q22.3 143,387,612 - 145,082,658 1,695,046 VOUS
dup 10q11.22 46,972,140 - 47,681,957 709,817
61 dup 2p25.3-p24.3 72,184 - 14,844,939 14,772,755 Pathogenic nml inconclusive dup 2p25.3;
del 4q35.2
del 4q35 (KLKB1) -
-del 4q35.1-q35.2 186,468,992 - 190,880,409 4,411,417
dup 6q27 168,336,052 - 168,596,251 260,199 VOUS
62 del 7q11.23 72,569,012 - 72,685,658 116,646 Pathogenic del 7q11.23 atypical
(FZD9nml)
dup Yp11.32; dup Yq12
dup Yp11.32; dup Yq12
- - del 7q11.23
atypical (FKBP6,
FZD9and
TBL2nml)
del 7q11.23 73,082,174 - 74,267,872 1,185,698
del 7q11.23 74,298,092 - 74,601,104 303,012
dup Xp22.33 192,991 - 2,693,037 2,500,046
dup Yp11.31-q11.23 0 - 28,800,000 28,800,000
dup 7p14.3 33,134,410 - 33,193,210 58,805 Benign
del 13q31.3 94,422,000 - 94,480,000 58,000
63 dup 16q24.1-q24.3 85,817,324 - 90,148,796 4,331,472 Pathogenic nml del 16p13.3;
dup 16q24.3
del 16p13.3; dup 16q24.3
inconclusive nml
-dup 14q11.2 20,213,937 - 20,425,051 211,114 Benign
del 16p13.3 105,320 - 203,254 97,934
dup 22q11.22 22,314,463 - 22,573,637 259,174
del 16p13.3 227,406 - 828,466 601,060 VOUS
dup Xq22.2 103,173,049 - 103,303,968 130,919
64 No change nml nml nml - -
-65 No change nml inconclusive nml - -
-66 dup 10q11.22 47,084,916 - 47,741,321 656,405 Benign inconclusive inconclusive nml - -
-67 del 8p21.3-p21.2 23,148,930 - 23,310,904 161,974 Benign nml nml nml - -
-68 No change nml nml nml - -
-69 dup 10q11.21 45,212,898 - 45,359,483 146,585 Benign nml del 16p13.3 del 19p13.3 - -
-70 del Xp11.23 47,871,775 - 47,985,557 113,782 Benign nml nml nml - -
-71 dup 9p13.1-p12 40,294,324 - 42,374,011 2,079,687 Benign nml nml nml - -
-72 No change nml nml nml - -
-73 No change nml nml nml - -
-531
CLINICS
2017;72(
9):526-537
Cytogeno
mic
assessme
nt
of
93
patients
with
DD/MC
A
Zanardo
EA
et
Table 1 -Continued.
ID Array results MLPA results
CNVs Start - End Size (pb) Classification Kit P064 Kit P036 Kit P070 Kit P250 Kit P356 Kit P029
74 dup Xq28 152,667,088 - 153,903,395 1,236,307 Pathogenic nml nml nml - -
-75 No change nml nml nml nml nml
-76 dup Yq11.23 27,266,362 - 28,693,558 1,427,196 VOUS nml nml nml - -
-77 No change nml nml nml nml nml
-78 No change nml nml nml nml nml
-79 del 2p11.2 90,027,810 - 90,247,720 219,910 Benign nml nml nml - -
-dup 21q11.2 14,687,571 - 15,214,708 527,137
del Xp21.3 27,151,611 - 27,337,941 186,330
80 dup 2q13 110,863,908 - 110,982,530 118,622 Benign nml nml nml - -
-81 dup 7q21.3 95,467,621 - 96,178,713 711,092 Benign nml nml nml nml nml
-del 9p23-p22.3 13,468,616 - 14,566,406 1,097,790
dup 22q11.23-q12.1 25,732,697 - 25,910,879 178,182
82 No change nml nml nml - -
-83 del 8p23.1 6,982,980 - 12,483,094 5,500,114 Pathogenic nml nml nml del 8p23 typical nml
-dup 2q22.3-q23.1 148,649,175 - 148,956,584 307,409 Benign
dup 5p13.2 36,902,936 - 37,159,877 256,941
dup 6p21.1 44,810,418 - 45,334,537 524,119
dup 8q22.2 100,111,153 - 100,528,645 417,492
dup 11p15.2 14,504,463 - 14,906,450 401,987
dup 13q31.3 92,492,127 - 92,815,210 323,083
dup 17q11.2 29,574,712 - 29,699,649 124,937
84 dup 7q11.1-q11.21 61,074,194 - 62,403,985 1,329,791 Benign nml nml nml nml nml
-dup 12p11.1 34,362,752 - 34,853,011 490,259
dup 17q11.2 29,444,844 - 29,562,294 117,450
dup 17q11.2 29,574,712 - 29,699,649 124,937
85 del 13q12.12 23,548,470 - 24,960,000 1,411,530 Pathogenic del 22q11 typical nml nml del 22q11 typical inconclusive
-del 22q11.21 18,886,915 - 21,463,730 2,576,815
dup 17q21.31 44,246,211 - 44,580,136 333,925 Benign
86 del 22q11.21 18,889,490 - 20,312,668 1,423,178 Pathogenic del 22q11 atypical nml nml del 22q11 atypical del 22q11 atypical
-dup 1p21.1 103,155,605 - 103,510,258 354,653 Benign
dup 5p13.2 36,816,661 - 37,158,123 341,462
dup 17q11.2 29,479,196 - 29,697,251 218,055
87 del 22q11.21 18,886,915 - 20,312,668 1,425,753 Pathogenic del 22q11 atypical nml nml del 22q11 atypical del 22q11 atypical
-del 15q11.2 24,357,212 - 24,472,002 114,790 Benign
del 16p12.2 21,578,388 - 21,839,340 260,952
88 dup 7p22.3-p21.1 44,935 - 19,155,339 19,110,404 Pathogenic dup 7p typical dup 7p22.3 dup 7p22.3 - -
-dup 7p21.1-p15.2 19,159,422 - 26,403,574 7,244,152
dup 2q24.3 166,821,406 - 166,939,893 118,487 Benign
dup 5p13.2 36,877,640 - 37,158,123 280,483
dup 9p24.1 5,112,844 - 5,252,074 139,230
dup 22q11.21 18,886,915 - 19,008,108 121,193
89 dup 7q21.3 95,467,621 - 96,178,713 711,092 Benign nml nml nml - -
-del 9p23-p22.3 13,468,616 - 14,566,406 1,097,790
90 del 9p24.1 8,012,608 - 8,227,101 214,493 Benign nml nml nml - -
-del Xq25 126,923,848 - 127,145,037 221,189
dup Xp22.33 1,921,638 - 2,065,015 143,377
91 del 9p23-p22.3 13,466,329 - 14,566,406 1,100,077 Benign nml nml nml - -
-dup 22q11.23-q12.1 25,650,648 - 25,910,879 260,231
92 No change nml nml nml - -
-93 del 5q14.3-q15 90,124,906 - 94,954,205 4,829,299 Pathogenic nml nml nml - -
-Abbreviations: Nml, normal; dup, duplication; del, deletion; VOUS, variant of uncertain clinical significance; pb, base pairs.
532
Cytogeno
mic
assessment
of
93
patients
with
DD/MCA
Zanardo
EA
et
al.
CLINICS
2017;72(
MLPA technique detectedB70.6% of the pathogenic CNVs detected using the array.
MLPA Analysis
The MLPA technique was employed to diagnose all patients using several different kits. No changes were detected in B66.7% (62/93) of the patients, and in four cases, one or two kits showed inconclusive results; however, these cases did not influence the assessment and interpreta-tion of the results.
CNVs were detected with at least one of the kits in B33.3% (31/93) of patients (Figure 2). Approximately 22.6% (7/31) of these changes were detected by the P064 kit, cor-responding to one deletion typical of the Williams-Beuren syndrome, one duplication in chromosome 7q11, and five deletions of 22q11.2, which were atypical in three patients and typical in the other two patients. All alterations were confirmed by the specific P029, P250 and/or P356 kits.
We also detected subtelomeric alterations inB45.2% (14/ 31) of the patients. One deletion was detected in two patients; two duplications in different chromosomes were detected in one patient; two deletions were found in another patient, one of which was detected with the P036 kit and the other with the P070 kit; and the remaining 10 patients showed concomitant deletions and duplications, all of which were present in the subtelomeric regions of different chromosomes.
The MLPA test also allowed us to simultaneously detect CNVs with all of the main kits used in this study (P064, P036 and P070); these changes were identified inB25.8% (8/31) of the patients.
One atypical duplication (in thePRODH gene) was only
detected by the P356 kit, specific for chromosome 22, and one
deletion in chromosome 8p23 (three probes) was detected with the P250 kit.
ARRAY Analysis
The array technique was applied to all patients using different platforms (Agilent, Affymetrix or Illumina) and chip densities. The results showed thatB14% (13/93) of the patients did not exhibit CNVs, whileB86% (80/93) exhibi-ted several different genomic alterations, including deletions, duplications and loss of heterozygosity (LOH). These chan-ges were classified as pathogenic, benign or VOUS.
Among the patients showing changes in the genome, we observed a 46.25% (37/80) detection rate for patients with benign and/or VOUS CNVs and a 53.75% (43/80) rate for patients with at least one pathogenic change (Figure 3).
Among the patients with pathogenic CNVs,B51.2% (22/ 43) exhibited only one alteration that was considered path-ogenic, whileB44.2% (19/43) showed at least two changes with important clinical significance, and B4.6% (2/43) of patients exhibited three or more pathogenic CNVs, possi-bly due to complex rearrangements. In several cases, these patients with pathogenic changes also displayed concomi-tant benign changes or VOUS.
Regarding the size of the changes, the majority of patients exhibited benign CNVs or VOUS ranging from 100 to 500 kb and pathogenic CNVs that were larger than 1 Mb.
’ DISCUSSION
Establishing an unequivocal clinical and molecular diag-nosis for patients with DD and MCA is essential for correlating genotypes and phenotypes and making genetic counseling more effective.
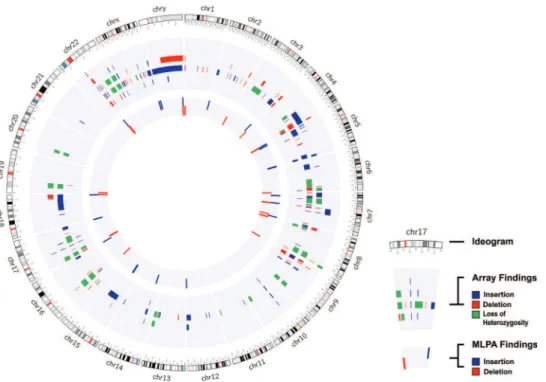
Figure 1 -Cytogenomic map of the raw data of all alterations identified via the MLPA and array techniques. The gray circles represent the locations of the breakpoints of the alterations identified by both techniques, in which the center circle corresponds to the MLPA results and the middle circle to the array results. Each bar refers to the position of each identified copy number change: the red bar refers to deletions, the blue to duplications, and the green to loss of heterozygosity. The genomic positions are reported according to their mapping on the GRCh38/hg38 genome build from the UCSC Genome Browser.
533
With advances in cytogenomic techniques, different syndromes can be better evaluated. Thus, for certain changes, specific genes are now highlighted as being responsible for most of the clinical features of a defined
syndrome, whereas for others it is possible to deter-mine alterations in an increasing number of critical regions associated with specific clinical characteristics (1,6).
Figure 3 -The number of CNVs identified on each chromosome via the array technique. The red bar indicates pathogenic CNVs; the blue bar indicates benign CNVs; the gray bar indicates VOUS; and the green bar indicates LOH.
Figure 2 -The results of MLPA. The blue bar indicates the number of duplications; the red bar indicates deletions; and the green bar indicates the number of normal results detected via MLPA.
534 Cytogenomic assessment of 93 patients with DD/MCA
Currently, the MLPA technique has become very useful for the detection of the main microdeletion/microduplication syndromes and subtelomeric imbalances, as it is a rapid technique that is able to detect typical changes correlated with specific phenotypes (e.g., Williams-Beuren syndrome or deletion of 22q11.2), in addition to being detecting small and/or atypical deletions and duplications in target regions (9,15,16). MLPA has the ability to assess more than 45 target regions in a single reaction without cell culture, making it a cost-effective and widely used technique for the validation of other methods, such as array-based analysis (12,15).
In this study, MLPA analysis using the P064 and/or P036 and P070 kits detected alterations in approximately 33.3% of patients. Using the same combination of MLPA kits, Jehee et al. (31) identified pathogenic changes in 21.8% of 261 patients with DD and MCA.
In a study performed on 258 patients with intellectual dis-abilities and dysmorphisms in 2007, the rate of the detection of alterations using several kits was 10.1%, among which only 5.8% were changes in regions correlated with syndro-mes, and 5.0% were associated with subtelomeric regions (15). In the patients included in the present study, the changes identified with a specific kit for the main microdeletion/ microduplication syndromes (P064) corresponded toB7.5% of all samples, or B22.6% of all changes, representing Williams-Beuren syndrome, duplications of chromosome 7q11 and deletions of chromosome 22q11.2. In addition, sub-telomeric changes were found in B15.1% of the samples evaluated via MLPA, or B45.2% of the patients with copy number changes. In a similar study, the detection rate for alterations in the regions of the main microdeletion/micro-duplication syndromes was 6.6%, and the detection rate for subtelomeric alterations was 7.3% (10).
The percentage of copy number changes detected in the genome via MLPA depends on the criteria used to select patients, and the data obtained in this study corroborate the data reported in the literature for the regions correspond-ing to the main syndromes. However, the obtained values for subtelomeric regions were higher than those previously described by several authors.
A subtelomeric analysis conducted by Koolen et al. (14) detected changes in 6.7% of 210 patients with idiopathic intellectual disabilities. Two years later, Palomares et al. (32) detected alterations in 10% of patients with the same pheno-typic characteristics using subtelomeric kits.
With the exception of two cases, all of the patients who presented only subtelomeric abnormalities exhibited two changes: one deletion associated with one duplication on different chromosomes, or two deletions or duplications. This set of changes in the same patients may result from complex rearrangements and translocations between chro-mosomes or regions of instability that are susceptible to rearrangements via DNA repair mechanisms.
We also detected changes with the three main kits used in this study (P064, P036 and P070) accounting forB25.8% of the CNVs identified among the abnormal results. These alter-ations may result from a microdeletion syndrome located near the telomere of a chromosome, such as 1p36 dele-tion syndrome, or complex rearrangements between different regions of chromosomes due to instability and microhomology. In addition to the changes detected by the main kits used in this study, we were able to identify an atypical change involving a single gene (2 exons evaluated) using the P356 kit and a deletion in 8p23 (3 genes evaluated) using the P250 kit.
These alterations are rare and difficult to detect because they involve specific genes or exons that are associated with few clinical characteristics, or a phenotype present in most patients, making it difficult to determine the correct kit to use. An important limitation of MLPA is that the signal intensity of the probes varies according to DNA character-istics, including those associated with the extraction method, storage time, elution solution, degree of degradation (if present), and the presence of several types of contaminants, such as extraction reagents, proteins, RNAs, and salts. These influences can be minimized if all samples are prepared by the same technician using the same method. However, it is not always possible to eliminate this bias because samples may be sent from other locations, and storage times and DNA extraction methods may differ from the standard, which can cause artifacts during analysis that only a specialist can identify (8,18).
In our analyses using the MLPA technique, 4 patients showed inconclusive results with one or two of the kits, but none of these findings limited the detection of changes because the surveyed regions were represented in the other kits used in this study. These data highlight the importance of using different combinations of kits because one kit can act as a control for another, confirming the alterations detected and excluding false positive and negative results (10,32).
In a study performed by Marenne et al. (2), MLPA was used to validate data from arrays. DNA from 56 patients were analyzed via MLPA in two independent reactions, providing a concordance rate of 97.25%. Therefore, MLPA is a reproducible technique.
The sizes and breakpoints of chromosomal abnormalities can currently be determined with greater precision, accuracy and sensitivity using array techniques (6,19).
All of the patients included in our study were assessed using the array technique according to the availability of platforms or slides/chips in the laboratory (Agilent, Affyme-trix or Illumina). The slides/chips differ in the technologies involved (CGH, oligonucleotides or beads) and in the number and spacing of probes distributed throughout the genome. Technologies with higher genome coverage provide more accurate breakpoint data and can be used to diagnose micro changes or several CNVs that were previously con-sidered a single alteration (e.g., a normal region interposed by two affected regions). In these cases, the low coverage of several arrays may determine those changes to be a single deletion and not a complex rearrangement that may reflect a change in the patient’s phenotype (4,19,33).
A total of 93 samples were evaluated, and all of the different technologies employed proved to be satisfactory for detecting variations in the genome, which in most cases corroborated the clinical characteristics of each patient.
The data included results that were considered nor-mal (without changes) for B14% of the patients. This rate is much lower than that described in the literature. In 2013, Vallespín et al. (27) evaluated 540 samples (patients with learning disabilities, autism and/or multiple congenital malformations) using a customized array with an average coverage ofB43 kb and showed that no CNVs were detectable in 31.85% of the patients. In this study, the samples that were considered normal were assessed using Agilent 180K (2/13 patients), Agilent 60K (1/13 patients) and Illumina (10/13 patients) arrays, all of which exhibit a high rate of genome coverage. The results (particularly those from the Illumina platform; 65 samples), were considered normal because the majority of the evaluated patients had not received a
535
suspected clinical diagnosis. These patients should be further evaluated and subjected to exome sequencing or targeted tests searching for mutations in specific genes or gene disrup-tions due to unbalanced translocadisrup-tions (4,20).
Among the patients who presented alterations in the genome, the array technique showed that 46.25% of the patients presented benign changes or changes of uncertain clinical significance, while 53.75% of the patients presented at least one pathogenic change.
Among the patients exhibiting alterations of clinical significance, the majority of patients presented only one or two pathogenic changes in the genome, which were or were not combined with other alterations, corresponding to B51.2% andB44.2% of the patients, respectively. Complex alterations with three or more pathogenic CNVs in different regions were observed in approximately 4.6% of the patients. The detection rate of pathogenic alterations visualized in this study was much higher than the rates previously reported in several articles. Rosenberg et al. (34) investigated 81 patients with intellectual disabilities and facial dysmorph-isms via the CGH array technique and concluded that 16% of the patients exhibited a pathogenic chromosomal imbalance related to their phenotype, while 4% of the patients exhibited changes of uncertain clinical significance. Gijsbers et al. (25) used several SNP array platforms to investigate patients with intellectual disabilities and multiple congenital abnormalities and detected alterations in 22.6% of 318 evaluated patients. Therefore, array analysis was considered the most appro-priate test for the initial molecular investigation of patients with these characteristics and normal karyotypes.
Hochstenbach et al. (28) also recommended arrays as the first diagnostic test in this patient group. Based on analyzing many studies, they concluded that the rate of detection using arrays would correspond to at least 19% of pathogenic changes. Other studies have shown similar rates, regardless of the platform selected to diagnose patients with intellectual disabilities, malformations and/or neurological disorders and normal karyotypes (20,27,28).
Regarding the size of the observed changes, we identified the greatest number of patients with pathogenic CNVs that were larger than 1 Mb. These large changes usually involve more causative genes of a disease. However, the severity of the clinical manifestations in patients is not necessarily directly correlated with the size of the change but is cor-related with location and gene content. Therefore, a small change can potentially reflect a more severe phenotype due to the pathogenicity of the altered gene (1,35).
With the implementation of SNP arrays, it has become possible to identify changes that were previously undiag-nosed using CGH arrays. In this study, we identified four patients with LOH or UPD regions that can be correlated with recessive disorders (20,24,25).
The main challenge in analyzing the results of the arrays is determining which changes are significant for each patient, as it is common to identify more than one change per patient, and all of the changes could potentially influence the phenotype in many cases. The identification of benign and VOUS changes is associated with the increased array density used for diagnosis, as arrays with a greater number of probes are able to identify a greater number of microalterations and determine the breakpoints of these changes with higher accuracy. However, the identification of regions involving genes without an established function or regions that do not contain well-described genes will also increase (24,27,29).
All of the changes detected in the present study were checked against several international databases, including the DGV, Decipher and UCSC databases. Nevertheless, a more appropriate assessment of the changes identified in our patients would result in the creation of a database with information specifically from Brazilian people.
Most of the obtained results (B97.8%) were concordant with each other for the regions investigated. However, not all of the results were in agreement, as the MLPA technique covers approximately 45 specific regions of the genome in each available kit, and this technique therefore depends on a clinical features and direction toward a specific target. Approximately 54.9% of the CNVs were not detected via MLPA compared with array analysis, and higher rates for this comparison (72-81%) are reported in the literature (2).
Despite the presence of the same alteration, one case was discordant in relation to the breakpoints detected via array analysis and the position of the MLPA probe. Therefore, to obtain a conclusive molecular diagnosis, other techniques should be applied to reevaluate the exact breakpoints involved.
All of the techniques employed in this study have advantages and disadvantages depending on the applica-tion and could potentially be applied together to obtain a complete molecular diagnosis.
Our findings showed that the interpretation of genotype-phenotype correlations in patients with complex genomic rearrangements is very difficult, but these results can directly contribute to the elucidation of new syndromes.
Arrays are a powerful tool for the identification and characterization of genomic abnormalities and can provide accurate diagnoses of previously unidentified or unex-plained diseases that are suspected to have a genetic cause, contributing to appropriate clinical management of the affected patients. When an array is not available, MLPA with a combination of three kits (P064, P036 and P070) is a remarkable tool that can detect abnormalities in patients with DD and MCA (10,15,31).
Clinical and laboratory interactions with skilled techni-cians are required to target a patient for the most effective and beneficial molecular diagnosis, in which an appropriate clinical hypothesis is crucial for the successful detection of changes.
Patients exhibiting normal results or benign alterations may present a clinical phenotype due to balanced rearrange-ments with disruptions in several genes or mutations in specific genes. In this case, other molecular techniques are required to achieve a complete diagnosis, such as exome sequencing, which can detect changes in 80% of patients with developmental delays of unknown cause, and analysis using normal arrays (4,20).
’ ACKNOWLEDGMENTS
We thank all of the children who participated in this study and their parents. This study was supported by grants from Coordenac¸ão de
Aperfeic¸oamento de Pessoal de Nível Superior (CAPES) and Fundac¸ão de
Amparo a Pesquisa do Estado de São Paulo (FAPESP).
’ AUTHOR CONTRIBUTIONS
Zanardo EA wrote the paper and performed cytogenomic analysis. Dutra RL performed cytogenomic analysis and genotype-phenotype correlations. Piazzon FB performed the clinical evaluation and cytogenomic analysis. Dias AT, Novo-Filho GM and Montenegro MM performed molecular
536 Cytogenomic assessment of 93 patients with DD/MCA
analysis and classical cytogenetic analysis; Nascimento AM prepared the samples and performed DNA extraction; Damasceno JG created the graph-ics and images. Madia FA and Costa TV discussed the results. Melaragno MI and Kim CA provided the samples and clinically assessed the patients; Kulikowski LD designed and coordinated the study. All authors read and approved thefinal manuscript.
’ REFERENCES
1. Feuk L, Carson AR, Scherer SW. Structural variation in the human gen-ome. Nat Rev Genet. 2006;7(2):85-97, http://dx.doi.org/10.1038/nrg1767. 2. Marenne G, Rodríguez-Santiago B, Closas MG, Pérez-Jurado L, Rothman N, Rico D, et al. Assessment of copy number variation using the Illumina Infinium 1M SNP-array: a comparison of methodological approaches in the Spanish Bladder Cancer/EPICURO study. Hum Mutat. 2011;32(2): 240-8, http://dx.doi.org/10.1002/humu.21398.
3. Shen Y, Wu BL. Designing a simple multiplex ligation-dependent probe amplification (MLPA) assay for rapid detection of copy number variants in the genome. J Genet Genomics. 2009;36(4):257-65, http://dx.doi.org/ 10.1016/S1673-8527(08)60113-7.
4. Vissers LE, de Vries BB, Veltman JA. Genomic microarrays in mental retardation: from copy number variation to gene, from research to diag-nosis. J Med Genet. 2010;47(5):289-97, http://dx.doi.org/10.1136/jmg. 2009.072942.
5. Connolly JJ, Glessner JT, Almoguera B, Crosslin DR, Jarvik GP, Sleiman PM, et al. Copy number variation analysis in the context of electronic medical records and large-scale genomics consortium efforts. Front Genet. 2014;5:51, http://dx.doi.org/10.3389/fgene.2014.00051.
6. Feenstra I, Brunner HG, van Ravenswaaij CM. Cytogenetic genotype-phenotype studies: improving genotyping, phenotyping and data storage. Cytogenet Genome Res. 2006;115(3-4):231-9, http://dx.doi.org/10.1159/ 000095919.
7. Emanuel BS, Saitta SC. From microscopes to microarrays: dissecting recurrent chromosomal rearrangements. Nat Rev Genet. 2007;8(11): 869-83, http://dx.doi.org/10.1038/nrg2136.
8. Kozlowski P, Jasinska AJ, Kwiatkowski DJ. New applications and developments in the use of multiplex ligation-dependent probe amplifi-cation. Electrophoresis. 2008;29(23):4627-36, http://dx.doi.org/10.1002/ elps.200800126.
9. Cho EH, Park BY, Cho JH, Kang YS. Comparing two diagnostic labora-tory tests for several microdeletions causing mental retardation syn-dromes: multiplex ligation-dependent amplification vs fluorescent in situ hybridization. Korean J Lab Med. 2009;29(1):71-6, http://dx.doi.org/ 10.3343/kjlm.2009.29.1.71.
10. Pohovski LM, Dumic KK, Odak L, Barisic I. Multiplex ligation-dependent probe amplification workflow for the detection of submicroscopic chro-mosomal abnormalities in patients with developmental delay/intellectual disability. Mol Cytogenet. 2013;6(1):7, http://dx.doi.org/10.1186/1755-8166-6-7.
11. Schouten JP, McElgunn CJ, Waaijer R, Zwijnenburg D, Diepvens F, Pals G. Relative quantification of 40 nucleic acid sequences by multiplex ligation-dependent probe amplification. Nucleic Acids Res. 2002;30(12):e57, http://dx.doi.org/10.1093/nar/gnf056.
12. Jennings LJ, Yu M, Fitzpatrick C, Smith FA. Validation of multiplex ligation-dependent probe amplification for confirmation of array com-parative genomic hybridization. Diagn Mol Pathol. 2011;20(3):166-74, http://dx.doi.org/10.1097/PDM.0b013e31820b2517.
13. De Vries BB, Winter R, Schinzel A, van Ravenswaaij-Arts C. Telomeres: a diagnosis at the end of the chromosomes. J Med Genet. 2003;40(6): 385-98, http://dx.doi.org/10.1136/jmg.40.6.385.
14. Koolen DA, Nillesen WM, Versteeg MH, Merkx GF, Knoers NV, Kets M, et al. Screening for subtelomeric rearrangements in 210 patients with unexplained mental retardation using multiplex ligation dependent probe amplification (MLPA). J Med Genet. 2004;41(12):892-9, http://dx.doi.org/ 10.1136/jmg.2004.023671.
15. Kirchhoff M, Bisgaard AM, Bryndorf T, Gerdes T. MLPA analysis for a panel of syndromes with mental retardation reveals imbalances in 5.8% of patients with mental retardation and dysmorphic features, including duplications of the Sotos syndrome and Williams-Beuren syndrome regions. Eur J Med Genet. 2007;50(1):33-42, http://dx.doi.org/10.1016/ j.ejmg.2006.10.002.
16. Fernández L, Lapunzina P, Arjona D, López Pajares I, García-Guereta L, Elorza D, et al. Comparative study of three diagnostic approaches (FISH, STRs and MLPA) in 30 patients with 22q11.2 deletion syndrome. Clin Genet. 2005;68(4):373-8, http://dx.doi.org/10.1111/j.1399-0004.2005. 00493.x.
17. Vorstman JA, Jalali GR, Rappaport EF, Hacker AM, Scott C, Emanuel BS. MLPA: a rapid, reliable, and sensitive method for detection and analysis of abnormalities of 22q. Hum Mutat. 2006;27(8):814-21, http://dx.doi. org/10.1002/humu.20330.
18. Ahn JW, Ogilvie CM, Welch A, Thomas H, Madula R, Hills A, et al. Detection of subtelomere imbalance using MLPA: validation, develop-ment of an analysis protocol, and application in a diagnostic centre. BMC Med Genet. 2007;8:9, http://dx.doi.org/10.1186/1471-2350-8-9. 19. Manning M, Hudgins L, Professional Practice and Guidelines Committee.
Array-based technology and recommendations for utilization in medical genetics practice for detection of chromosomal abnormalities. Genet Med. 2010;12(11):742-5, http://dx.doi.org/10.1097/GIM.0b013e3181f8baad. 20. Siggberg L, Ala-Mello S, Linnankivi T, Avela K, Scheinin I, Kristiansson K,
et al. High-resolution SNP array analysis of patients with developmental disorder and normal array CGH results. BMC Med Genet. 2012;13:84, http://dx.doi.org/10.1186/1471-2350-13-84.
21. Salman M, Jhanwar SC, Ostrer H. Will the new cytogenetics replace the old cytogenetics? Clin Genet. 2004;66(4):265-75, http://dx.doi.org/ 10.1111/j.1399-0004.2004.00316.x.
22. Edelmann L, Hirschhorn K. Clinical utility of array CGH for the detection of chromosomal imbalances associated with mental retardation and multiple congenital anomalies. Ann N Y Acad Sci. 2009;1151:157-66, http://dx.doi.org/10.1111/j.1749-6632.2008.03610.x.
23. Alkan C, Coe BP, Eichler EE. Genome structural variation discovery and genotyping. Nat Rev Genet. 2011;12(5):363-76, http://dx.doi.org/ 10.1038/nrg2958.
24. Bruno DL, Ganesamoorthy D, Schoumans J, Bankier A, Coman D, Delatycki M, et al. Detection of cryptic pathogenic copy number varia-tions and constitutional loss of heterozygosity using high resolution SNP microarray analysis in 117 patients referred for cytogenetic analysis and impact on clinical practice. J Med Genet. 2009;46(2):123-31, http://dx.doi. org/10.1136/jmg.2008.062604.
25. Gijsbers AC, Lew JY, Bosch CA, Schuurs-Hoeijmakers JH, van Haeringen A, den Hollander NS, et al. A new diagnostic workflow for patients with mental retardation and/or multiple congenital abnormalities: test arrays first. Eur J Hum Genet. 2009;17(11):1394-402, http://dx.doi.org/10.1038/ ejhg.2009.74.
26. Bi W, Borgan C, Pursley AN, Hixson P, Shaw CA, Bacino CA, et al. Comparison of chromosome analysis and chromosomal microarray analysis: what is the value of chromosome analysis in today’s genomic array era? Genet Med. 2013;15(6):450-7, http://dx.doi.org/10.1038/ gim.2012.152.
27. Vallespín E, Palomares Bralo M, Mori MÁ, Martín R, García-Miñaúr S, Fernández L, et al. Customized high resolution CGH-array for clinical diagnosis reveals additional genomic imbalances in previous well-defined pathological samples. Am J Med Genet A. 2013;161A(8):1950-60, http:// dx.doi.org/10.1002/ajmg.a.35960.
28. Hochstenbach R, van Binsbergen E, Engelen J, Nieuwint A, Polstra A, Poddighe P, et al. Array analysis and karyotyping: workflow con-sequences based on a retrospective study of 36,325 patients with idio-pathic developmental delay in the Netherlands. Eur J Med Genet. 2009; 52(4):161-9, http://dx.doi.org/10.1016/j.ejmg.2009.03.015.
29. Miller DT, Adam MP, Aradhya S, Biesecker LG, Brothman AR, Carter NP, et al. Consensus statement: chromosomal microarray is a first-tier clinical diagnostic test for individuals with developmental disabilities or con-genital anomalies. Am J Hum Genet. 2010;86(5):749-64, http://dx.doi. org/10.1016/j.ajhg.2010.04.006.
30. Kearney HM, Thorland EC, Brown KK, Quintero-Rivera F, South ST, Working Group of the American College of Medical Genetics Laboratory Quality Assurance Committee. American College of Medical Genetics standards and guidelines for interpretation and reporting of postnatal constitutional copy number variants. Genet Med. 2011;13(7):680-5, http://dx.doi.org/10.1097/GIM.0b013e3182217a3a.
31. Jehee FS, Takamori JT, Medeiros PF, Pordeus AC, Latini FR, Bertola DR, et al. Using a combination of MLPA kits to detect chromosomal imbal-ances in patients with multiple congenital anomalies and mental retar-dation is a valuable choice for developing countries. Eur J Med Genet. 2011;54(4):e425-32, http://dx.doi.org/10.1016/j.ejmg.2011.03.007. 32. Palomares M, Delicado A, Lapunzina P, Arjona D, Amiñoso C, Arcas J,
et al. MLPA vs multiprobe FISH: comparison of two methods for the screening of subtelomeric rearrangements in 50 patients with idiopathic mental retardation. Clin Genet. 2006;69(3):228-33, http://dx.doi.org/ 10.1111/j.1399-0004.2006.00567.x.
33. Shaffer LG, Bejjani BA. Medical applications of array CGH and the transformation of clinical cytogenetics. Cytogenet Genome Res. 2006; 115(3-4):303-9, http://dx.doi.org/10.1159/000095928.
34. Rosenberg C, Knijnenburg J, Bakker E, Vianna-Morgante AM, Sloos W, Otto PA, et al. Array-CGH detection of micro rearrangements in mentally retarded individuals: clinical significance of imbalances present both in affected children and normal parents. J Med Genet. 2006;43(2):180-6, http://dx.doi.org/10.1136/jmg.2005.032268.
35. Feuk L, Marshall CR, Wintle RF, Scherer SW. Structural variants: changing the landscape of chromosomes and design of disease studies. Hum Mol Genet. 2006;15 Spec No 1:R57-66, http://dx.doi.org/10.1093/hmg/ ddl057.
537