Subtropical forest biomass estimation using airborne LiDAR and Hyperspectral data
Yong Pang*, Zengyuan Li, Shili Meng, Wen Jia, Luxia Liu
Institute of Forest Resource Information Technique, Chinese Academy of Forestry, China, People's Republic of pangy@ifrit.ac.cn
Commission WG VIII/7
KEY WORDS: Subtropical Forest, Biomass, Airborne Lidar, Hyperspectral, Fusion
ABSTRACT:
Forests have complex vertical structure and spatial mosaic pattern. Subtropical forest ecosystem consists of vast vegetation species and these species are always in a dynamic succession stages. It is very challenging to characterize the complexity of subtropical forest ecosystem. In this paper, CAF’s (The Chinese Academy of Forestry) LiCHy (LiDAR, CCD and Hyperspectral) Airborne Observation System was used to collect waveform Lidar and hyperspectral data in Puer forest region, Yunnan province in the Southwest of China. The study site contains typical subtropical species of coniferous forest, evergreen broadleaf forest, and some other mixed forests. The hypersectral images were orthorectified and corrected into surface reflectance with support of Lidar DTM product. The fusion of Lidar and hyperspectral can classify dominate forest types. The lidar metrics improved the classification accuracy. Then forest biomass estimation was carried out for each dominate forest types using waveform Lidar data, which get improved than single Lidar data source.
1. INTRODUCTION
Forests play an irreplaceable role in maintaining regional ecological environment, global carbon balance and mitigating global climate change. Forest aboveground biomass (AGB) is an important indicator of forest carbon stock. Estimating forest aboveground biomass accurately could significantly reduce the uncertainties in terrestrial ecosystem carbon cycle. Airborne lidar provides accurate information on the vertical structure of forests (Wulder et al., 2008; Naesset et al., 2008). As simulated by Tompalski et al. (2014), species impacted stand volume estimation dramatically. Biomass estimation has similar phenomena. Anderson et al (2008) found the integration of waveform lidar with hyperspectral data improved about 9% of AGB estimation.
In this paper, the performances of biomass estimation using airborne LiDAR and Hyperspectral data will be explored in a sub-tropical forest of Southwest China.
2. STUDY SITE AND DATA 2.1 Study area
The study area is located in the Yunnan-Guizhou Plateau, China with an altitude of 1000-1500 m. According to the zoning of vegetation in China, forest stands are western subtropical evergreen broad-leaved forest and western tropical monsoon forest. Main tree species are Castanopsis echidnocarpa, Schima superba, Betula alnoides Buch.-Ham. ex D. Don, Cyclobalanopsis glauca (Thunberg) Oersted, Lithocarpus glaber (Thunb.) Nakai, Tetracentron sinense Oliv, Vaccinium bracteatum Thunb., and Pinus kesiya var. langbianensis.
2.2 Airborne LiDAR and Hyperspectral data
The ALS data were collected in March of 2014 by airplane Yun-12 transport at an altitude around 1500 m. The LiDAR-CCD-Hyperspectral (LiCHy) airborne LiDAR system was
developed by the Institute of Forest Resource Information Techniques, Chinese Academic of forestry (CAF) (Pang et al., 2013). This system integrated the LMS-Q680i, DigiCAM-60, AisaEAGLE sensors and GPS/IMU. The LMS-Q680i is a full waveform LiDAR system, which gives access to detailed target parameters by digitizing the echo signal online during data acquisition and subsequent off-line waveform analysis. The DigiCAM-60 and AisaEAGLE were selected as the CCD and hyperspectral sensor for LiCHy. The AEROcontrol, a solution of IGI's GPS/IMU system, was used for the precise determination of position and attitude of airborne sensors.
2.3 Plot description
The ground survey was conducted in November and December of 2013. To achieve a robust prediction model, the stratified sampling frame was used, which contained three strata of coniferous forest, broadleaf forest, and mixed forest. For each strata, plots with different AGB levels were sampled. Sixty seven circular samples with a radius of 13.8 m were established. Within each plot, the diameter at breast high (DBH), tree species, tree height, under-branch height, and crown diameter of all of the individual trees with DBH greater than 5 cm was measured. DBH was recorded using a caliper. Forest biomass was calculated using existing allometric equations.
3. METHODOLOGY
Firstly, the AISA Eagle hypersectral images were orthorectified and corrected into surface reflectance with support of Lidar DTM product. Then the fusion of Lidar DTM, CHM (canopy model), Principal Component Analysis (PCA) and Spectrally Segmented PCA (SSPCA) from hyperspectral data were used to classify dominate forest types. The Support Vector Machine (SVM) classifier was used.
For airbone lidar data, the height index and density index were calculated with 20 m cell size. Then these Lidar cells were assigned forest type information according to the proportion of The International Archives of the Photogrammetry, Remote Sensing and Spatial Information Sciences, Volume XLI-B8, 2016
XXIII ISPRS Congress, 12–19 July 2016, Prague, Czech Republic
This contribution has been peer-reviewed.
species from classification result. The biomass estimation models were built according to field plots measurements for each forest type. Then the built models were used to predict biomass for all airborne data areas. The stratified regression tree modeling method implemented in CUBIST software package was used.
Figure 1. Workflow of forest biomass estimation by fusion of airborne lidar and hyperspectral data
4. RESULTS AND DISCUSSIONS
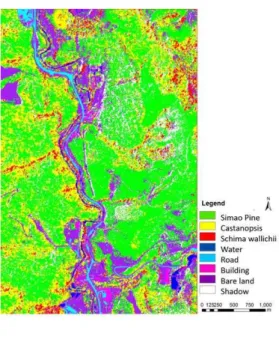
As shown in Figure 2, the hypersectral images were orthorectified and corrected into surface reflectance with support of Lidar DTM product. The fusion of Lidar and hyperspectral classified dominate forest types with the overall accuracy of 95.1% and the kappa coefficient of 0.93. The lidar DTM improved the terrain effect correction of hyperspectral data. The Lidar CHM improved the classification accuracy.
(a)
(b)
Figure 2. (a) The corrected surface reflectance of airborne hyperspectral data. The central wavelengths of displayed hyperspectral image for red, green and blue bands are 849.30,
694.91 and 543.72 nm. (b) Tree Species Classification using hyperspectral and airborne lidar data.
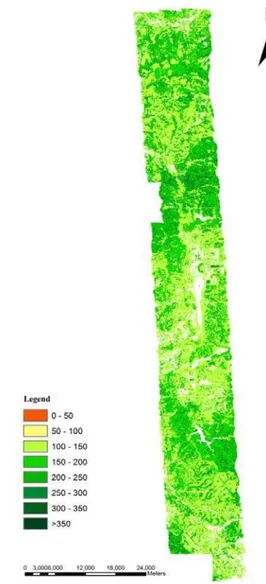
Figure 3 showed forest biomass estimation for each dominate forest type using waveform Lidar data. After stratification with forest type information, the R2 improved 0.09 and 0.21 for broadleaf and coniferous species separately. As the mixed forest type has few plots, we use the combined equation for this type. The predicted biomass map for the whole area was shown in Figure 4.
(a) All species
The International Archives of the Photogrammetry, Remote Sensing and Spatial Information Sciences, Volume XLI-B8, 2016 XXIII ISPRS Congress, 12–19 July 2016, Prague, Czech Republic
This contribution has been peer-reviewed.
(b) Coniferous species
(c) Broadleaf species
Figure 3. Field measured AGB and lidar metrix estimation modeling
with forest types information from hyperspectral classification
5. CONCLUSIONS AND FUTURE WORK From our work in a sub-tropical forest of Southwest China, the fusion of airborne LiDAR and hyperspectral data was helpful for forest applications. Lidar DTM improved the terrain effect correction of hyperspectral data. The Lidar CHM data was helpful for forest type classification. The forest type stratification improved forest biomass estimation of Lidar data. For the performance of mixed forest type, more analyse are is needed with more reference data.
ACKNOWLEDGEMENTS (OPTIONAL)
This work was supported by the National High Technology Research and Development Program of China (2012AA12A306) and the Major State Basic Research Development Program of China (2013CB733406 & 2013CB733404).
Figure 4. Forest AGB mapping in Puer, Southwest China.
REFERENCES
Anderson J. E., Plourde Lucie C., Martin Mary E. et al. 2008. Integrating waveform lidar with hyperspectral imagery for inventory of a northern temperate forest, Remote Sensing of Environment, Volume 112, Issue 4, Pages 1856-1870
Næsset, E.; Gobakken, T. 2008. Estimation of above- and below-ground biomass across regions of the boreal forest zone using airborne laser. Remote Sens. Environ. 112, 3079–3090.
Tompalski, P., Coops, N.C., White, J.C., and Wulder, M.A. 2014. Simulating the impacts of error in species and height upon stand volume for airborne LiDAR Forest Ecology Management, 327: 167-177
Wulder, M.A., C.W. Bater, N.C. Coops, T. Hilker, J.C. White, 2008. The role of lidar in sustainable forest management The Forestry Chronicle. 84(6) 807-826
The International Archives of the Photogrammetry, Remote Sensing and Spatial Information Sciences, Volume XLI-B8, 2016 XXIII ISPRS Congress, 12–19 July 2016, Prague, Czech Republic
This contribution has been peer-reviewed.