Hydrol. Earth Syst. Sci., 10, 923–924, 2006 www.hydrol-earth-syst-sci.net/10/923/2006/ © Author(s) 2006. This work is licensed under a Creative Commons License.
Hydrology and
Earth System
Sciences
Corrigendum to
“Investigation of dominant hydrological processes in a tropical
catchment in a monsoonal climate via the downward approach”
published in Hydrol. Earth Syst. Sci., 10, 769–782, 2006
L. Montanari et al.
DISTART, Faculty of Engineering, University of Bologna, Viale Risorgimento 2, 40136 Bologna, Italy
In the paper “Investigation of dominant hydrological pro-cesses in a tropical catchment in a monsoonal climate via the downward approach” by Laura Montanari et al. (Hydrol. Earth Syst. Sci., 10, 769–782, 2006) errors have occurred in the final production process, for which the authors express genuine regret:
In Sect. 3.1, in the last four lines, the correct sentence should be: “The lowest and highest values of rainfall and runoff are reached in 1989 and 1975, respectively (see Fig. 2), when the index of aridity assumes the highest and lowest values, in that order”.
In Sect. 3.2, the correct wording of the first paragraph should be as follows: “Mean monthly potential evapotran-spiration and mean monthly rainfall are out of phase within the year, as seen in Fig. 4, where these variables are presented starting from October, the month with the lowest runoff value which is numbered as month 1 (i.e., start of the water year). The maximum of mean monthly runoff is reached between February and March (namely months 5 and 6 in the water year, as shown in Fig. 4), during which the potential evap-otranspiration is around its minimum and the rainfall is still relevant, causing maximization of the soil moisture storage”.
Correspondence to:L. Montanari
Moreover, Figs. 7, 8, 9 16 should be shown as follows.
e1
p qse1
SBb1
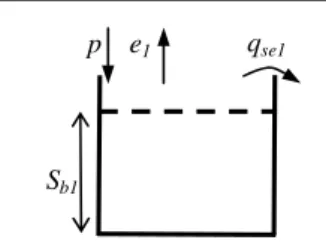
Fig. 7. Sketch of the B1 model. Only saturation excess runoff is included.
924 L. Montanari et al.: Corrigendum
e1
p qse1
Sb1
e2
p qse2
Sb2
e3
p qse3
Sb3
e4
p qse4
Sb4
( )
t
q
( )
t
q
i sei
se
∑
=
=
41
4
1
q
( )
( )
( )
( )
( )
∑
( )
∑
∑
= = =
=
=
=
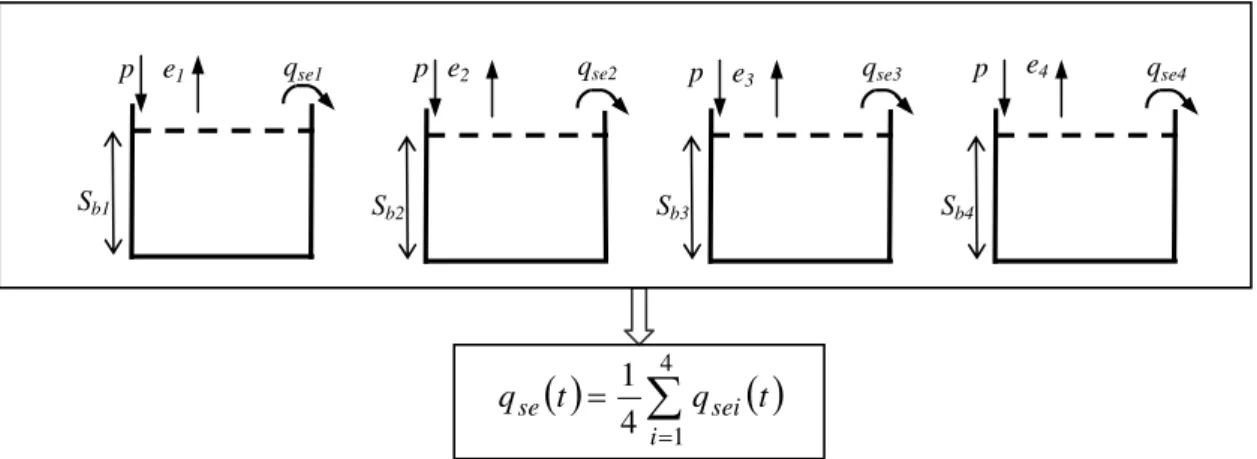
Fig. 8.Sketch of model B4. Only saturation excess runoff is included.
( )
∑
( )
=
=
e1
p qse1
Sb1
Sf1
qd1
qg1
e2
p qse2
Sb2
Sf2
qd2
qg2
e3
p qse3
Sb3
Sf3
qd3
qg3
e4
p qse4
Sb4
Sf4
qd4
qg4
( )
( )
( )
( )
( )
t q( )
t qt q t
q
t q t
q
i di d
i gi g
i sei se
∑
∑
∑
= = =
= = =
4
1 4
1 4
1
4 1 4 1 4 1
Fig. 9.Model B4DG, composed of four buckets in parallel. Saturation excess runoff, delayed runoff and groundwater flow are all accounted for.
Fig. 16.Cumulative daily runoff versus cumulative daily rainfall for every year of record: results presented only in the rainfall range of 600 mm to 1400 mm for clarity (year 1975 has been excluded as it is considered anomalous).