A Lower Proportion of Regulatory B Cells in
Patients with Henoch
–
Schoenlein Purpura
Nephritis
Xintong Hu1☯, Jiandong Tai1☯, Zhihui Qu4, Songchen Zhao1, Li Zhang4, Man Li1, Xiguang Sun1*, Yanfang Jiang1,2,3*
1Genetic Diagnosis Center, The First Hospital of Jilin University, Changchun, China,2Key Laboratory of Zoonoses Research, Ministry of Education, The First Hospital of Jilin University, Changchun, China, 3Jiangsu Co-innovation Center for Prevention and Control of Important Animal Infectious Diseases and Zoonoses, Yangzhou, China,4Department of Nephrology, the First Hospital of Jilin University, Changchun, China
☯These authors contributed equally to this work.
*yanfangjiang@jlu.edu.cn(YFJ);xi-guangsun@hotmail.com(XGS)
Abstract
Background
Henoch—Schoenlein purpura is the one of most common types of systemic vasculitis that involves impaired renal function and Henoch-Schoenlein purpura nephritis (HSPN). The diagnosis of this condition is largely based on immunohistologic detection of immunoglobu-lin A1-containing immune complex in the glomerular deposits of mesangium. Despite cimmunoglobu-lini- clini-cal advances, the etiopathogenesis of HSPN is still largely unknown.
Methods
In this study, we enrolled 25 newly diagnosed HSPN patients and 14 healthy controls. Then, fractions of B cell subtypes were determined in venous blood using flow cytometry. The serum interleukin (IL)-10 concentration was determined by enzyme-linked immunosor-bent assay.
Results
Compared to those in healthy controls, the numbers of CD38+CD19+, CD86+CD19+,
CD38+CD86+CD19+, and CD95+CD19+B cells per microliter of blood were significantly
higher in HSPN patients. In contrast, the numbers of CD5+CD19+, IL-10+CD19+, CD5
+-CD1d+CD19+, and IL-10+CD5+CD1d+CD19+B cells per microliter of blood and the serum
IL-10 concentration were significantly lower in HSPN patients. Following treatment, the numbers of CD38+CD19+and CD86+CD19+B cells per microliter of blood were significantly
reduced in HSPN patients. However, the numbers of CD5+CD1d+CD19+, CD5+CD1d+
IL-10+CD19+, and IL-10+CD19+B cells per microliter of blood and the serum IL-10
concentra-tion were significantly increased in HSPN patients following treatment. The estimated glo-merular filtration rate (eGFR) was negatively correlated with the number of CD38+CD19+B
cells but positively correlated with the numbers of IL-10+CD19+, CD1d+CD5+CD19+, and IL-a11111
OPEN ACCESS
Citation:Hu X, Tai J, Qu Z, Zhao S, Zhang L, Li M, et al. (2016) A Lower Proportion of Regulatory B Cells in Patients with Henoch–Schoenlein Purpura Nephritis.
PLoS ONE 11(3): e0152368. doi:10.1371/journal. pone.0152368
Editor:Menno C van Zelm, Monash University, AUSTRALIA
Received:November 4, 2015
Accepted:March 13, 2016
Published:March 31, 2016
Copyright:© 2016 Hu et al. This is an open access article distributed under the terms of theCreative Commons Attribution License, which permits unrestricted use, distribution, and reproduction in any medium, provided the original author and source are credited.
Data Availability Statement:All relevant data are within the paper and its Supporting Information files.
Funding:The authors received no specific funding for this work.
10+CD1d+CD5+CD19+B cells per microliter of blood and the serum IL-10 concentration.
The 24-h urinary protein concentration was positively correlated with the number of CD38+CD19+B cells but negatively correlated with the numbers of IL-10+CD19+, CD1d
+-CD5+CD19+, and IL-10+CD1d+CD5+CD19+B cells per microliter of blood and the serum
IL-10 concentration.
Conclusion
Our results suggest that CD38+CD19+and CD1d+CD5+CD19+B cells (Bregs) contribute to the pathogenesis of HSPN.
Introduction
Henoch—Schoenlein purpura (HSP) is a systemic vasculitis that affects small vessels. In this condition, patients develop perivascular inflammatory cell infiltrates. It is an immunoglobulin A-related immune complex-mediated disease that adversely affects the skin, joints, and gastro-intestinal system, especially the kidney [1,2]. In recent studies, it has been reported that glo-merular damage occurs in patients with HSPN, and such damage might be due to the
deposition of mesangial Gd-IgA1-containing immune complex, which acts as a potential medi-ator via mesangial receptors. Subsequently, complement-mediated stimulation of mesangial cells occurs, leading to their proliferation. Moreover, cytokine secretion is also stimulated under such circumstances [3]. However, IgA deposition recurs in some patients even after they undergo renal transplantation [4,5]. In such patients, we detect mild forms of IgA nephropathy (IgAN), because there is deposition of immune complex and nephritic changes [6]. As a result, we usually detect an extrarenal source of antigen and an antibody immune complex in these patients. Furthermore, B cells are divided into different subsets depending on the presence of surface molecules. In the peripheral blood, naive and memory B cells express different amounts of CD27 [7]. This indicates that activated CD27+B cells can establish memory responses [8]. Activated B cells can differentiate into CD38+plasma cells that secrete antibodies [9,10] and cytokines, which enhance the expression of co-stimulation molecules, especially CD86 (which is an established marker of B-cell activation) and CD95 [11,12]. The CD95 receptor is consid-ered to be a key regulator in the activation of germ cell apoptosis [13]. These different subtypes of B cells are known to collaborate and control the responses of the human immune system; however, very little information is available regarding the mechanisms governing the onset of HSPN in patients.
B cells are primary positive regulators that have the ability to produce Ag-specific Ig and multiple cytokines. However, regulatory B cells (Bregs), which are a subset of B cells, have been found to have negative regulatory function [14]. Presently, in murine models with autoimmune disease, scientists have established that Breg subsets have immunosuppressive activity. This includes B cell subsets that express interleukin (IL)-10 and transforming growth factor
expressed in IgA-nephritis patients [27]. Moreover, previous studies have also reported that IL-10–producing B cells are actively involved in regulating Th1 and Th17 responses in a model of collagen-induced arthritis [28]. In these models, B cells that produce IL-10 play a critical role, and a new IL-10+B cell subset was recently characterized by a CD1dhiCD5+CD19+ pheno-type [14,29–31]. Presently, very little information is available about the association between Bregs and HSPN.
In this study, we evaluated the numbers (per microliter of blood) of various B cell subtypes and IL-10–producing B cells that were isolated from the peripheral blood of patients with HSPN and healthy controls (HCs). Thus, we investigated the potential association between the differential expression of B cell subtypes before treatment and the dynamic changes in these B cell subtypes after treatment.
Materials and Methods
Patients and controls
A total of 25 patients with new onset HSPN (defined by a disease duration of<2 months) were
recruited through the inpatient service of the Department of Nephrology of the First Hospital of Jilin University from January 2015 to October 2015. We excluded patients with any of the following conditions: IgA-nephritis, lupus nephritis, other primary glomerulonephritides, neo-plastic disease, active peptic ulcer, diabetes mellitus, and viral hepatitis. In the control group, we included 14 HCs who matched the experimental subjects in terms of age, gender and eth-nicity. None of the subjects in the control group had a history of any kind of chronic inflamma-tory disease. All the included patients fulfilled the EULAR/PRINTO/PRES (European League against Rheumatism/Paediatric Rheumatology International Trials Organisation/Paediatric Rheumatology European Society) criteria for HSP, which is defined as purpura plus; the included patients experienced at least one of the following symptoms: 1) abdominal pain; 2) typical leukocytoclastic vasculitis or proliferative glomerulonephritis with IgA deposits, as con-firmed by histopathological examination; 3) arthritis or arthralgia; and 4) renal involvement [32]. HSPN patients develop either a nephritic or a nephrotic syndrome. Nephritic syndrome is defined as hematuria with at least one of the following symptoms: renal insufficiency, hyper-tension, and oliguria. Here, nephrotic syndrome was defined by proteinuria>400 mg/day or
hematuria. In some studies, it has been reported that patients with nephrotic syndrome also develop edema and have serum albumin levels<2.5 g/dl [33,34]. All the participants signed a
written informed consent form, and this study was approved by the Ethical Committee of the First Hospital of Jilin University. The demographic and clinical characteristics of participants are summarized inTable 1.
Treatment and follow-up
Clinical examination
Venous blood samples (10 ml) were obtained from each participant; the blood samples were col-lected in heparinized tubes. A small volume of blood was used for isolating peripheral blood mononuclear cells (PBMCs) using density-gradient centrifugation (Amersham Biosciences, Lit-tle Chalfont, UK). The remaining blood samples were centrifuged for preparing serum samples. We determined the concentrations of serum triglycerides, serum IgA cholesterol, albumin, uric acid, leukocytes and lymphocytes using ADVIA 1650 biochemical analyzer (Bayer, Pittsburg, PA, USA). Moreover, we collected 24-hour urine samples from individual subjects to examine urinary proteinuria and microscopic hematuria. In addition, we calculated the estimated glo-merular fitration rate (eGFR) of individual participants using the revised eGFR formula [35].
Flow cytometric analysis
Human PBMCs were stained at a cell density of 106/tube in duplicates. For the purpose of staining, we used PerCP-anti-CD19, PE-anti-CD38, APC-anti-CD86, or PerCP-anti-CD19, PE-anti-CD27, and APC-anti-CD95 or isotype-matched control IgG (BD Biosciences, San Jose, CA, USA). The staining was performed at room temperature, and the cells were protected from light for 30 minutes. After washing with phosphate-buffered saline (PBS), the cells were characterized using a FACS Calibur flow cytometer (BD Biosciences). Moreover, at least 30000 events per sample were analyzed using FlowJo software v7.6.2 (Ashland, OR, USA) [36].
To analyze the production of intracellular IL-10, we isolated PBMCs. The cells were then plated in 24-well plates (106cells/well) and stimulated with 50 ng/ml phorbol myristate acetate (PMA), 1.0 mg/ml ionomycin and 5.0 mg/ml lipopolysaccharide (LPS; Sigma—Aldrich, St. Louis, MO, USA) in complete RPMI-1640 medium for 2 h at 37°C in an atmosphere of 5% CO2. Then, brefeldin A (GolgiPlug; BD Biosciences) was added to each well, and the cells were
incubated for another 4 h. Then, the cells were harvested and washed with PBS. Finally, these cells were stained in duplicate for 30 min using APC-anti-CD19, PE-anti-CD1d, and PerCP-anti-CD5 (BD Biosciences). After washing with PBS, the cells were permeabilized using a
Table 1. Demographic and clinical characteristics of HSPN patients and HCs.
HSPN patients (n = 25) HCs (n = 14)
Age, years 44(16–86) 44(19–74)
Female/male 12/10 8/6
Lymphocytes, 109/L 2.46(0.75–3.45) 1.1 (0.4–1.74)
Serum albumin, g/L 31.3(23–45.8) 42.1(38.7–49)
Serum uric acid,μmol/L 322(225–424) 335(230–440)
Triglycerides, mmol/L 3.02(0.7–4.27) 1.15(0.35–1.63)
Cholesterol, mmol/L 4.14(3.08–5.87) 4.17(2.8–5.95)
Urinary proteins, g/24 h 2.8(0.45–7.2)* 0.05(0–0.15)
Urea nitrogen, mmol/L 4.84(2.93–7.71) 5.05(3.65–6.74)
eGFR, mL/min/1.73m2 90.4(16.76–116)
* 99 (90–109.14)
Hematuria, n(%) 25(100%) 0(0%)
Data shown are median (range), real number of cases (n/n), and number of cases with percentage [n(%)]. eGFR: estimated glomerularfiltration rate. Hematuria: defined as microscopic red blood cells>3 rbc/hpf. Normal values: lymphocytes: 1.10–3.20 (109/L), serum albumin: 40.00–55.00 g/L, serum uric acid: 210– 430μmol/L, triglycerides: 0.28–1.6 mmol/L, cholesterol: 2.6–6.0 mmol/L, urinary protein:<0.2 g/24 h, urea nitrogen: 3.2–7.0 mmol/L, eGFR: 80–120 ml/min.
*P<0.05 vs. HCs.
permeabilization solution (BD Biosciences). Thereafter, they were stained using FITC-anti-IL-10 (eBiosciences, San Diego, CA, USA). Finally, they were analyzed by flow cytometry using the aforementioned procedure. The details of the antibodies used for flow cytometry are pro-vided inS1 Table.
Enzyme-linked immunosorbent assay (ELISA)
The serum concentration of IL-10 was determined by ELISA using a human IL-10 ELISA kit (Roche Diagnostics, Lewes, UK) according to the manufacturer’s instructions. At 1:4 dilutions, individual serums were briefly subjected to ELISA analysis. Thereafter, the serum concentra-tions of IL-10 were calculated in individual samples using the standard curve established for recombinant IL-10. The detection limit was 2.5 ng/L.
Human cell isolation and culture
We isolated B cells from PBMCs of five new onset HSPN patients via flow cytometry and stain-ing with APC-anti-CD19 (BD Biosciences). The B cells were resuspended in D-10 (DMEM supplemented with 10% fetal calf serum, 100 U/mL penicillin, and 100μg/mL streptomycin).
Experiments were carried out in duplicate, and cell numbers were equal among the two groups for each patient: one group of D-10 with 1μM prednisolone, and the other group without
pred-nisolone. These samples were then distributed in wells of 24-well plates (Corning, Tewksbury, MA, USA) at 0.5–2×10⁵cells per well. After incubation at 37°C in a humidified atmosphere with 5% CO2for 72 h, all cells in culture wells were harvested and stained with PE-anti-CD1d
and PerCP-anti-CD5 (BD Biosciences) as described to determine the percentages of Bregs.
Statistical analysis
Data are expressed as means, medians, and ranges. The numbers of each type of cells tested were calculated according to the percentages of each type of cells multiplied by the lymphocyte count. The differences between the two groups were analyzed using Mann—Whitney U-test. The differences between pre-treatment and post-treatment patients were analyzed by the Wil-coxon test. The correlations were tested using Spearman’s rank correlation test. Statistical anal-ysis was performed using SPSS 19.0 software (IBM, Armonk, NY, USA). Statistically significant cases were those in which the two-sided P-value<0.5.
Results
Patient characteristics
There were no significant differences in the ages and gender ratio of HSPN patients and HCs. There were also no significant differences in the serum albumin concentration, serum uric acid concentration, urea nitrogen concentration, triglycerides, cholesterol, and lymphocyte counts of experimental cases and HCs. However, HSPN patients had significantly higher values of 24-h proteinuria compared to the control group. In addition, HSPN patients had a significantly lower eGFR compared to the HCs (Table 1). The clinical and basic immunological parameters of all individual patients and controls are described inS2 Table.
Differential expression of B cell subsets
(all P<0.05,Fig 1B–1F). However, there were no differences in the numbers of CD27+CD19+
and CD27+CD95+CD19+B cells (data not shown).
The numbers of IL-10
–
producing B cells
We analyzed the numbers of IL-10–producing B cells in patients with HSPN and HCs. The numbers of CD5+CD19+, CD1d+CD19+, IL-10+CD19+, CD1d+CD5+CD19+and
IL-Fig 1. Flow cytometric analysis of the numbers of different subsets of B cells.PBMCs were collected from HSPN patients and healthy controls. Then, they were stained with PerCP-anti-CD19, PE-anti-CD38, APC-anti-CD86, or PerCP-anti-CD19, PE-anti-CD27, and APC-anti-CD95 (Biolegend, San Diego, CA, USA), or isotype-matched control IgG (Beckton Dickinson, San Jose, CA, USA). For further analysis of different subsets of B cells, the cells were gated initially on living lymphocytes and then on CD19+B cells. (A) Flow cytometric analysis results. (B) The numbers of CD19+B cells. (C) The numbers of CD38+CD19+plasma cells. (D) The numbers of CD86+CD19+B cells. (E) The numbers of CD38+CD86+CD19+B cells. (F)The numbers of CD95+CD19+B cells. Data are expressed as the means for individual subjects included in two separate experiments. (G) Mean fluorescence intensity of CD86 on B cells. (H) Mean fluorescence intensity of CD95 on B cells. (I) Mean fluorescence intensity of CD95 on CD27+B cell subsets. (J) Mean fluorescence intensity of CD95 on CD27-B cell subsets. The horizontal lines represent the median values. Data were analyzed by Mann-Whitney U-test.
10+CD1d+CD5+CD19+B cells in HSPN patients were significantly lower than those in HCs (all P<0.05,Fig 2B–2E). Because Bregs play an immunoregulatory role that is primarily
medi-ated via IL-10, we examined the serum concentrations of IL-10 in HSPN patients and HCs. We found that the serum IL-10 concentration was significantly lower in the HSPN patients (P<0.001,Fig 2F). Our raw data can be found inS1 Fig.
Correlations between B cell subtypes, serum IL-10, and clinical
parameters
First, we analyzed the potential relationship between clinical parameters and different subsets of B cells. We found that eGFR was negatively correlated with the number of CD38+CD19+B
Fig 2. Flow cytometric analysis of Bregs isolated from PBMCs of HSPN patients and healthy controls.The cells were stained with CD19, anti-CD5, anti-CD1d, and intracellular anti-IL-10 or isotype-matched IgG. The cells were characterized by flow cytometric analysis; living lymphocytes were gated initially, followed by gating on CD19+B cells. Subsequently, we analyzed the numbers of CD5+CD19+, CD1d+CD5+CD19+, and IL-10+CD1d+CD5+CD19+B cells among CD19+B cells, and at least 30,000 events per sample were analyzed. (A) Flow cytometric analysis. (B) The numbers of CD5+CD19+B cells. (C) The numbers of IL-10+CD19+B cells. (D) The numbers of CD1d+CD5+CD19+B cells. (E) The numbers of IL-10+CD1d+CD5+CD19+B cells. (F) Serum concentrations of IL-10. Data are expressed as the means or concentrations for individual subjects that participated in two separate experiments. The horizontal lines represent the median values of each group. Data were analyzed by the Mann-Whitney U-test.
cells (Fig 3A, P = 0.0035, R = -0.6351), while 24-h proteinuria was positively correlated with the number of CD38+CD19+B cells per microliter of blood (Fig 3F, R = 0.6684, P = 0.0018). Furthermore, we analyzed the potential relationships of serum IL-10, IL-10–producing B cells, and clinical parameters. In this case, we found that eGFR was positively correlated with the numbers of IL-10+CD19+(Fig 3B, P = 0.0003, R = 0.7404), CD1d+CD5+CD19+(Fig 3C, P = 0.0397, R = 0.4754), and IL-10+CD1d+CD5+CD19+B cells (Fig 3D, P = 0.0477, R = 0.4596) per microliter of blood and the IL-10 serum concentration (Fig 3E, P = 0.0086, R = 0.5842). However, the 24-h proteinuria was negatively correlated with the numbers of IL-10+CD19+ (Fig 3G, P = 0.0077, R =–0.5912), CD1d+CD5+CD19+(Fig 3H, P = 0.0154, R =–0.5467), and IL-10+CD1d+CD5+CD19+B cells (Fig 3I, P = 0.0021, R =–0.6591) per microliter of blood and serum concentration of IL-10 (Fig 3J, P = 0.0232, R =–0.5175). In addition, there was no signif-icant effect of age on the numbers of CD1d+CD5+CD19+Bregs or IL-10+CD1d+CD5+CD19+B cells (data not shown).
Correlations between CD19+B cell subtypes and the proportion of
IL-10
–
producing B cells
The fraction of CD38+CD19+B cells was negatively correlated with the serum IL-10 concentra-tion (Fig 4A, P = 0.0047, R =–0.6193) and the number of IL-10+CD19+B cells per microliter of blood (Fig 4B, P = 0.0244, R =–0.514). In addition, the number of CD86+CD19+B cells was negatively correlated with the serum IL-10 concentration (Fig 4C, P = 0.0226, R =–0.5195) and the number of IL-10+CD19+B cells (Fig 4D, P = 0.0145, R =–0.5509). In contrast, the numbers of CD1d+CD5+CD19+(Fig 4E, P = 0.002, R = 0.6614) and IL-10+CD1d+CD5+CD19+ B cells (Fig 4F, P = 0.0245, R = 0.5273) per microliter of blood were positively correlated with the serum IL-10 concentration.
Fig 3. Correlation analysis of clinico-pathological features of HSPN patients, based on the percentages of CD19+B cell subtypes.(A) The eGFR
was negatively correlated with the number of CD38+CD19+B cells. (B) The eGFR was positively correlated with the numbers of IL-10+CD19+B cells, (C) CD1d+CD5+CD19+B cells (D), and IL-10+CD1d+CD5+CD19+B cells (E) as well as the serum concentration of IL-10. (F) The 24-h urinary protein concentration was positively correlated with the number of CD38+CD19+B cells. (G) The 24-h urinary protein concentration was negatively correlated with the numbers of IL-10+CD19+B cells, (H) CD1d+CD5+CD19+B cells, and (I) IL-10+CD1d+CD5+CD19+B cells as well as the (J) serum concentration of IL-10. The potential correlations among the numbers of B cells of different subsets, Bregs, and the values of clinical parameters were analyzed by the Spearman correlation tests.
Clinical parameters, different subsets of B cells, and serum IL-10
concentration in HSPN patients following treatment
In order to better understand the function of different subsets of B cells and serum IL-10 in the progression of HSPN, we assessed the values of clinical parameters, the numbers of B cells of different subsets, and the serum IL-10 concentrations in eight patients who reported for fol-low-up sessions within 8–12 weeks. We found that 24-h proteinuria had decreased significantly in these patients, whereas eGFR had increased (Table 2). In addition, the serum level of IL-10 had significantly increased as compared to the pre-treatment levels (Fig 5A, P = 0.002). Simi-larly, the numbers of IL-10+CD19+(Fig 5D, P<0.001), CD1d+CD5+CD19+(Fig 5E, P<0.001),
and IL-10+CD1d+CD5+CD19+B cells (Fig 5F, P = 0.001) had increased compared to pre-treat-ment values. Conversely, the numbers of CD38+CD19+(Fig 5B, P = 0.001) and CD86+CD19+ B cells (Fig 5C, P<0.001) had decreased compared to the pre-treatment values. Then, we
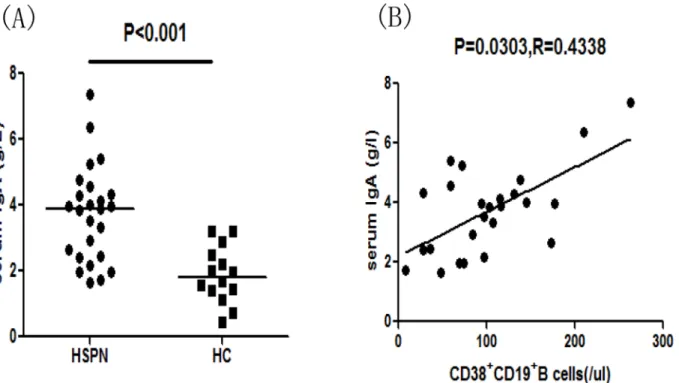
ana-lyzed the correlation between the number of CD38+CD19+B cells and the serum IgA concen-tration in HSPN patients and found that the serum IgA concenconcen-tration was positively correlated with the number of CD38+CD19+B cells (Fig 6B, P = 0.0303, R = 0.4338). Moreover, the num-ber of Bregs post-treatment was significantly higher than that pre-treatment (Fig 5G,
P = 0.018) based on in vitro culture.
In summary, the treatment dramatically improved proteinuria in patients. This finding was accompanied by a reduction in the number of CD38+D19+B cells. However, there were increases in the numbers of IL-10+CD19+, CD1d+CD5+CD19+, and IL-10+CD1d+CD5+CD19+ B cells and the serum IL-10 concentration in HSPN patients following treatment.
Fig 4. Correlations among different subsets of B cells and the serum concentration of IL-10 in HSPN patients.Potential correlations among the numbers of B cells of different subsets and the serum concentration of IL-10 were analyzed by the Spearman correlation tests. Data are expressed as the means or concentrations for individual subjects that participated in two separate experiments. (A-B) The number of CD38+CD19+B cells was negatively correlated with the serum IL-10 level and the percentage of IL-10+CD19+B cells. (C-D) The number of CD86+CD19+B cells was negatively correlated with the serum IL-10 level and the number of IL-10+CD19+B cells. (E-F) The serum IL-10 level was positively correlated with the numbers of CD1d+CD5+CD19+ and IL-10+CD1d+CD5+CD19+B cells.
Discussion
Previous studies have failed to clarify the pathogenesis of HSPN. However, they have proved that HSPN is mainly associated with glomerular deposits of an immune complex containing IgA. These deposits are primarily found in mesangium. Moreover, the deposition of IgA occurs again in some patients who have previously undergone renal transplantation [3]. In our study, we have characterized the roles of different subsets of peripheral blood B cells in HSPN patients and HCs. In our study, the different B cell subsets were defined as CD38+CD19+,
Table 2. The effect of treatment on the clinical parameters of HSPN patients during the follow-up period.
Before treatment After treatment
Age, years 43(18–74) 43(18–74)
Female/male 3/5 3/5
Lymphocytes, 109/L 2.65(1.58–2.93) 2.63(1.27–2.79)
Serum albumin, g/L 30.2(25–39.5) 33.2(25.5–40.7)
Serum uric acid,μmol/L 321(281–398) 312(267–380)
Triglycerides, mmol/L 3.02(1.05–4.27) 2.98(1.34–3.92)
Cholesterol, mmol/L 4.34(3.16–5.87) 4.02(2.94–5.35)
Urinary proteins, g/24 h 3.6(2.38–7.2) 2.55(1–5.62)*
Urea nitrogen, mmol/L 5.31(3.36–7.71) 4.65(3.22–6.98)
eGFR, mL/min/1.73m2 88(16.76–102) 91.2(26.89–108.6)*
Hematuria, n(%) 8(100%) 2(25%)
Data shown are median (range), real number of cases (n/n), and number of cases with percentage [n(%)]. eGFR: estimated glomerularfiltration rate. Hematuria: defined as microscopic red blood cells>3 rbc/hpf. Normal values: lymphocytes: 1.10–3.20 (109/L), serum albumin: 40.00–55.00 g/L, serum uric acid: 210– 430μmol/L, triglycerides: 0.28–1.6 mmol/L, cholesterol: 2.6–6.0 mmol/L, urinary proteins:<0.2 g/24 h, urea nitrogen: 3.2–7.0 mmol/L, eGFR: 80–120 ml/min.
*P<0.05 vs. the values before treatment.
doi:10.1371/journal.pone.0152368.t002
Fig 5. The change in the frequency of B cell subtypes and the serum concentration of IL-10 in HSPN patients following treatment.Differences in patients pre- and post-treatment were analyzed by the Wilcoxon test. Data are expressed as the means or concentrations for individual subjects who participated in two separate experiments. (A) Serum level IL-10 in individual patients’pre- and post-treatment. (B-F) The numbers of CD38+CD19+, CD86+CD19+, IL-10+CD19+, CD5+CD1d+CD19+, and CD5+CD1d+IL-10+CD19+B cells of individual patients in the pre- and post-treatment stages.
CD86+CD19+, CD38+CD86+CD19+, CD27+CD19+(activated B cells), CD27-CD19+(naive B cells), CD95+CD19+, and CD27+CD95+CD19+B cells. Thereafter, we analyzed the numbers of these cells per microliter of blood. We found that compared to those in HCs, the numbers of CD38+CD19+, CD86+CD19+, CD38+CD86+CD19+, and CD95+CD19+B cells were signifi-cantly higher in patients with HSPN. However, there were no significant differences in the numbers of CD27+CD19+and CD27+CD95+CD19+B cells between the experimental and con-trol groups. The high expression of CD86, which activates CD4+T cells, indicates the activation of B cells [12]. Activated B cells can also secrete cytokines and express co-stimulatory mole-cules, such as CD86 and CD95 [11]. Furthermore, it has been proposed that CD95 acts as a key regulator in the activation of germ cell apoptosis [13]. This feedback regulation can maintain the homeostasis of B cells in HSPN patients. We also analyzed the associations between clinical parameters and the numbers of B cells of different subtypes per microliter of blood. We found that 24-h proteinuria is positively correlated with the number of CD38+CD19+B cells, whereas eGFR is negatively correlated with the number of CD38+CD19+B cells. Furthermore, the num-bers of CD38+CD19+and CD86+CD19+(activated) B cells were significantly reduced after treatment. Consequently, the number of circulating CD86+CD19+B cells, specifically CD38+CD19+B cells, may be associated with the pathogenesis of HSPN.
In this experimental study, we also analyzed a new subset of B cells, which are termed Bregs; these cells are characterized by the CD1dhiCD5+CD19+phenotype [14,29–31]. We were sur-prised to find that compared to those in HCs, the numbers of CD5+CD19+, CD1d+CD19+, IL-10+CD19+, CD1d+CD5+CD19+, and IL-10+CD1d+CD5+CD19+B cells were significantly lower in HSPN patients. Furthermore, 24-h proteinuria was negatively correlated with the serum IL-10 concentration and the numbers of IL-IL-10+CD19+, CD1d+CD5+CD19+, and
IL-Fig 6. Correlation between the number of CD38+CD19+B cells and the serum IgA concentration in HSPN patients.(A) Serum IgA concentrations in
HSPN patients and healthy controls. Data are expressed as the means or concentrations for individual patients who participated in two separate
experiments. The horizontal lines indicate the median values for each group. (B) The serum IgA concentration was positively correlated with the number of CD38+CD19+B cells. Analyzed by Spearman correlation tests.
10+CD1d+CD5+CD19+B cells. In addition, the eGFR was positively correlated with the serum IL-10 concentration and the numbers of IL-10+CD19+, CD1d+CD5+CD19+, and IL-10+CD1d +-CD5+CD19+B cells. Interestingly, serum IL-10 levels and the numbers of IL-10+CD19+, CD1d+CD5+CD19+, and IL-10+CD1d+CD5+CD19+B cells were significantly greater in patients following treatment. Based on these results, we speculate that Bregs and the serum IL-10 concentration play pivotal roles in the pathophysiology of HSPN.
Previous studies have also shown that Bregs play a critical role in the regulation of experi-mental autoimmune encephalomyelitis (EAE) and in the suppression of intestinal inflamma-tion in murine models via IL-10, which has strong anti-inflammatory activity and inhibitory activity on the immune system [23,24]. Therefore, we analyzed the correlations between CD19+B cell subtypes and the IL-10–producing B cells. We have found that the number of CD38+CD19+B cells was negatively correlated with the serum IL-10 concentration and the number of IL-10+CD19+B cells per microliter of blood. Conversely, the numbers of CD1d +-CD5+CD19+and IL-10+CD1d+CD5+CD19+B cells per microliter of blood were positively cor-related with the serum IL-10 concentration. These results support the above assumptions, which indicate that a decrease in the number of Bregs can in turn reduce the serum level of IL-10. Consequently, there is a reduction in the immunosuppressive effect, leading to a high num-ber of CD38+CD19+B cells in patients with HSPN. An enhanced immune response may stimu-late the expression of antigen, and as a result, the deposition of antibody immune complex may be favored in the mesangium, promoting the pathogenesis of HSPN.
In conclusion, our data indicate that CD38+CD19+B cells and Bregs may participate in the pathogenesis of HSPN. Because HSPN is mainly associated with glomerular deposits of an immune complex containing IgA, we also analyzed the serum level of IgA in patients with HSPN and found that the serum IgA concentration was positively correlated with the number of CD38+CD19+B cells. In addition, a previous study has indicated that 24-h urinary protein can predict the pathological classification of HSPN [37]. Given that HSPN is a serious patho-logical condition arising from Henoch—Schoenlein purpura, we analyzed the numbers of neu-trophils from the patients with HSPN to explore whether our findings represent only a general inflammatory response. We found that the number of Bregs has no correlation with the num-ber of neutrophils (data not shown), suggesting that our findings do not represent a general inflammatory response. Although previous studies have shown that the levels of CD5+B cells and IL-10+B cells are decreased in antineutrophil cytoplasmic antibody-associated vasculitis [38–41] and the frequency of IL-10–producing B cells is higher in hepatitis B virus-associated membranous nephropathy [42], our study is the first to indicate that CD38+CD19+B cells and Bregs may participate in the pathogenesis of HSPN.
Supporting Information
S1 Fig. The raw data of Bregs in 25 HSPN patients.
(ZIP)
S1 Table. Details of antibodies used for flow cytometry.
(ZIP)
S2 Table. Clinical and basic immunological parameters.
(ZIP)
Author Contributions
Conceived and designed the experiments: YJ XS XH. Performed the experiments: XH SZ JT YJ. Analyzed the data: SZ ZQ. Contributed reagents/materials/analysis tools: SZ LZ ML. Wrote the paper: YJ JT XH. Obtained Blood: ZQ LZ.
References
1. Pillebout E, Verine J. Henoch-Schonlein purpura in the adult. Rev Med Interne 2014; 35(6):372–81. doi:10.1016/j.revmed.2013.12.004PMID:24657040
2. Kang Y, Park JS, Ha YJ, Kang MI, Park HJ, Lee SW, et al. Differences in clinical manifestations and outcomes between adult and child patients with Henoch-Schonlein purpura. J Korean Med Sci 2014; 29(2):198–203. doi:10.3346/jkms.2014.29.2.198PMID:24550645
3. Pohl M. Henoch-Schonlein purpura nephritis. Pediatr Nephrol 2015; 30(2):245–52. doi:10.1007/ s00467-014-2815-6PMID:24733586
4. Moroni G, Gallelli B, Diana A, Carminati A, Banfi G, Poli F, et al. Renal transplantation in adults with Henoch-Schonlein purpura: long-term outcome. Nephrol Dial Transplant 2008; 23:3010–3016. doi:10. 1093/ndt/gfn209PMID:18424819
5. Soler MJ, Mir M, Rodriguez E, Orfila A, Munne A, Vazquez S, et al. Recurrence of IgA nephropathy and Henoch-Schonlein purpura after kidney transplantation: risk factors and graft survival. Transplant Proc 2005; 37:3705–3709. PMID:16386512
6. Ji S, Liu M, Chen J, Yin L, Sha G, Chen H, et al. The fate of glomerular mesangial IgA deposition in the donated kidney after allograft transplantation. Clin Transplant 2004; 18:536–540. PMID:15344956 7. Santer DM, Ma MM, Hockman D, Landi A, Tyrrell DL, Houghton M. Enhanced Activation of Memory,
but Not Naive, B Cells in Chronic Hepatitis C Virus-Infected Patients with Cryoglobulinemia and Advanced Liver Fibrosis. PLoS One 2013; 8:e68308. doi:10.1371/journal.pone.0068308PMID: 23840845
8. Klein U, Rajewsky K, Kuppers RU. Human immunoglobu-€lin (Ig)M+IgD+ peripheral blood B-cells expressing the CD27 cell surface antigen carry somatically mutated variable region genes: CD27 as a general marker for somatically mutated (memory) B-cells. J Exp Med 1998; 188:1679–89. PMID: 9802980
9. Peiseler M, Sebode M, Franke B, Wortmann F, Schwinge D, Quaas A, et al. FOXP3+ regulatory T cells in autoimmune hepatitis are fully functional and not reduced in frequency. J Hepatol 2012; 57: 125–32. doi:10.1016/j.jhep.2012.02.029PMID:22425700
10. Zhong X, Tumang JR, Gao W, Bai C, Rothstein TL. PD-L2 expression extends beyond dendritic cells/ macrophages to B1 cells enriched for V(H)11/V(H)12 and phosphatidyl choline binding. Eur J Immunol 2007; 37: 2405–10. PMID:17683117
11. Arpin C, Déchanet J, Van Kooten C, Merville P, Grouard G, Brière F, et al. Generation of memory B-cells and plasma B-cells in vitro. Science 1995; 268: 720–2. PMID:7537388
12. Menezes SM, Decanine D, Brassat D, Khouri R, Schnitman SV, Kruschewsky R, et al. CD80+ and CD86+ B cells as biomarkers and possible therapeutic targets in HTLV-1 associated myelopathy/tropi-cal spastic paraparesis and multiple sclerosis. J Neuroinflammation. 2014 Jan 29; 11:18. doi:10.1186/ 1742-2094-11-18PMID:24472094
15. Fremd C, Schuetz F, Sohn C, Beckhove P, Domschke C. B cell-regulated immune responses in tumor models and cancer patients. Oncoimmunology 2013; 2: e25443. PMID:24073382
16. Gunderson AJ, Coussens LM. B cells and their mediators as targets for therapy in solid tumors. Exp Cell Res 2013; 319: 1644–1649. doi:10.1016/j.yexcr.2013.03.005PMID:23499742
17. Nelson BH. CD20+B cells: the other tumor-infiltrating lymphocytes. J Immunol 2010; 185(9):4977–4982. doi:10.4049/jimmunol.1001323PMID:20962266
18. de Visser KE, Korets LV, Coussens LM. De novo carcinogenesis promoted by chronic inflammation is B lymphocyte dependent. Cancer Cell 2005; 7(5): 411–423. PMID:15894262
19. Schioppa T, Moore R, Thompson RG, Rosser EC, Kulbe H, Nedospasov S, et al. B regulatory cells and the tumor-promoting actions of TNFalpha during squamous carcinogenesis. Proc Natl Acad Sci USA 2011; 108: 10662–10667. doi:10.1073/pnas.1100994108PMID:21670304
20. Nzula S, Going JJ, Stott DI. Antigen-driven clonal proliferation, somatic hypermutation,and selection of B lymphocytes infiltrating human ductal breast carcinomas. Cancer Res 2003; 63:3275–3280. PMID: 12810659
21. Kammertoens T, Qin Z, Briesemeister D, Bendelac A, Blankenstein T. B-cells and IL-4 promote methyl-cholanthrene-induced carcinogenesis but there is no evidence for a role of T/NKT-cells and their effec-tor molecules (Fas-ligand, TNF-alpha, perforin). Int J Cancer 2012; 131:1499–1508. doi:10.1002/ijc. 27411PMID:22212899
22. Ammirante M, Luo JL, Grivennikov S, Nedospasov S, Karin M. B-cell-derived lymphotoxin promotes castration-resistant prostate cancer. Nature 2010; 464: 302–305. doi:10.1038/nature08782PMID: 20220849
23. Mizoguchi A, Mizoguchi E, Takedatsu H, Blumberg RS, Bhan AK. Chronic intestinal inflammatory con-dition generates IL-10-producing regulatory B cell subset characterized by CD1d upregulation. Immu-nity 2002; 16: 219–230. PMID:11869683
24. Fillatreau S, Sweenie CH, McGeachy MJ, Gray D, Anderton SM. B cells regulate autoimmunity by pro-vision of IL-10. Nat Immunol 2002; 3: 944–950. PMID:12244307
25. Zhang N, Zhao P, Shrestha A, Zhang L, Qu Z, Liu M, et al. A higher frequency of CD4+CXCR5+T follic-ular helper cells in adult patients with minimal change disease. Biomed Res Int 2014; 836157. doi:10. 1155/2014/836157PMID:25243187
26. Liu Y, Zhao P, Qu Z, Ayana DA, Jiang Y. Frequency of CD4+CXCR5+ TFH cells in patients with hepati-tis b virus-associated membranous nephropathy. Int Immunopharmacol. 2014 Sep; 22(1):98–106. doi: 10.1016/j.intimp.2014.06.024PMID:24975830
27. Wang YY, Zhang L, Zhao PW, Ma L, Li C, Zou HB, et al. Functional implications of regulatory B cells in human IgA nephropathy. Scand J Immunol. 2014 Jan; 79(1):51–60. doi:10.1111/sji.12128PMID: 24219615
28. Carter NA, Rosser EC, Mauri C. Interleukin-10 produced by B cells is crucial for the suppression of Th17/Th1 responses, induction of T regulatory type 1 cells and reduction of collagen-induced arthritis. Arthritis Res Ther 2012; 14: R32. doi:10.1186/ar3736PMID:22315945
29. Yanaba K, Bouaziz JD, Haas KM, Poe JC, Fujimoto M, Tedder TF. A regulatory B cell subset with a unique CD1dhiCD5+phenotype controls T cell-dependent in flammatory responses. Immunity, 2008; 28:639–50. doi:10.1016/j.immuni.2008.03.017PMID:18482568
30. van der Vlugt LE, Labuda LA, Ozir-Fazalalikhan A, Lievers E, Gloudemans AK, Liu KY, et al. Schisto-somes induce regulatory features in human and mouse CD1d(hi) B cells: inhibition of allergic inflamma-tion by IL-10 and regulatory T cells. PLoS One 2012; 7: e30883. doi:10.1371/journal.pone.0030883 PMID:22347409
31. Sun F, Ladha SS, Yang L, Liu Q, Shi SX, Su N, et al. Interleukin-10 producing B cells and their associa-tion with responsiveness to rituximab in myasthenia gravis. Muscle Nerve, 2014; 49:487–94. doi:10. 1002/mus.23951PMID:23868194
32. Ozen S, Pistorio A, Iusan SM, Bakkaloglu A, Herlin T, Brik R, et al. EULAR/PRINTO/PRES criteria for Henoch-Schönlein purpura, childhood polyarteritis nodosa, childhood Wegener granulomatosis and childhood Takayasu arteritis: Ankara 2008: part II: final classification criteria. Ann Rheum Dis 2010; 69:798–806. doi:10.1136/ard.2009.116657PMID:20413568
33. Narchi H. Risk of long term renal impairment and duration of follow up recommended for Henoch-Schonlein purpura with normal or minimal urinary findings: a systematic review. Arch Dis Child 2005; 90:916–920. PMID:15871983
35. Florkowski CM, Chew-Harris JS. Methods of estimating GFR-different equations including CKD-EPI. Clin Biochem Rev 2011; 32:75–79. PMID:21611080
36. Jiang Y, Ma Z, Xin G, Yan H, Li W, Xu H, et al. Th1 and Th2 immune response in chronic hepatitis B patients during a long-term treatment with adefovir dipivoxil. Mediators Inflamm 2010; 143026. 37. Ye Q, Shang SQ, Liu AM, Zhang T, Shen HQ, Chen XJ, et al. 24h Urinary Protein Levels and Urine
Pro-tein/Creatinine Ratios Could Probably Forecast the Pathological Classification of HSPN. PLoS One 2015; 10(5):e0127767. doi:10.1371/journal.pone.0127767PMID:25996387
38. Aybar LT, McGregor JG, Hogan SL, Hu Y, Mendoza CE, Brant EJ, et al. Reduced CD5(+) CD24(hi) CD38(hi) and interleukin-10(+) regulatory B cells in active anti-neutrophil cytoplasmic autoantibody-associated vasculitis permit increased circulating autoantibodies. Clin Exp Immunol 2015; 180(2): 178–88. doi:10.1111/cei.12483PMID:25376552
39. Dumoitier N, Terrier B, London J, Lofek S, Mouthon L. Implication of B lymphocytes in the pathogenesis of ANCA-associated vasculitides. Autoimmun Rev 2015; 14(11):996–1004. doi:10.1016/j.autrev. 2015.06.008PMID:26143354
40. Jennette JC, Falk RJ. B cell-mediated pathogenesis of ANCA-mediated vasculitis. Semin Immuno-pathol 2014; 36(3):327–38. doi:10.1007/s00281-014-0431-yPMID:24777746
41. Unizony S, Lim N, Phippard DJ, Carey VJ, Miloslavsky EM, Tchao NK, et al. Peripheral CD5+ B cells in antineutrophil cytoplasmic antibody-associated vasculitis. Arthritis Rheumatol 2015; 67(2):535–44. doi:10.1002/art.38916PMID:25332071
42. Liu Y, Wang H, Hu X, Qu Z, Zhang H, Crew R, et al. A higher frequency of IL-10-producing B cells in Hepatitis B virus associated membranous nephropathy. Clin Exp Pharmacol Physiol 2016 Jan 30. 43. Sims GP, Ettinger R, Shirota Y, Yarboro CH, Illei GG, Lipsky PE. Identification and characterization of
circulating human transitional B cells. Blood 2005; 105(11):4390–8. PMID:15701725
44. Berkowska MA, Driessen GJ, Bikos V, Grosserichter-Wagener C, Stamatopoulos K, Cerutti A, et al. Human memory B cells originate from three distinct germinal center-dependent and -independent mat-uration pathways. Blood 2011; 118(8):2150–8. doi:10.1182/blood-2011-04-345579PMID:21690558 45. Berkowska MA, Heeringa JJ, Hajdarbegovic E, van der Burg M, Thio HB, van Hagen PM, et al. Human