CONTRACTS
Associate Professor PhD Oana
BĂRBULESCU
Transilvania University of Brasov Email: [email protected]Nontenured Lecturer PhD Ioan Constantin ENACHE
Transilvania University of Brasov Email: [email protected]Abstract:
This paper aims to investigate the relationship between leasing contracts and some factors that influence the value of these contracts. In order to do this, we have decided on some quantitative marketing research by appealing to statistics for accomplishing the objectives that we have set: to find a correlation between the turnover percentage assigned to leasing expenses and several influence factors. This study indicated that the more contracts are signed by a firm, the more likely is to assign a bigger fraction of the income to each new leasing contract. The study confirmed that bigger companies are relying more on leasing as a way of financing than small companies. This study also discovered that companies with more employees are using larger contracts in order to sustain their activity. The findings are expected to contribute to adjusting the offers by the leasing companies, taking into consideration these factors and to using these factors in order to better predict the market evolution.
Keywords: leasing market, companies, contracts, turnover, number of employees.
Introduction
The leasing operations implying a transaction where one party, called lessor or financier, send to another party, called user, for a certain period of time, the right of using an asset, for a specific sum of money, called leasing rate (Niţulescu, 2008).
The main feature of the leasing is the fact that the added value produced by a given asset is given by its use and not by the property title on the given asset (Achim, 2005). The real advantages of the leasing reside in the absence of supplementary guarantees and in the optimization of the cash flow of a company.
The fact that the SMEs do not have sufficient collateral guarantees or a credit history creates a series of limitations in terms of bank financing. Since the financing framework specific to the leasing operations involves eligibility requirements in a less restrictive contracting compared to bank loans, the leasing offers these companies the possibility to purchase goods necessary to the development.
Literature review
Debt-financing and/or equity-financing are believed in the view of the pecking order theory issued by Myers and Majluf (1984) to be the external solution for the firms that don’t own their own funds. Nevertheless, the cost of external money could be significantly increased by the absence of their own funds. Consequently, companies disposing of little money could turn to lease as an alternative to borrowing money, given the high cost of borrowing.
Previous studies have attempted to identify several potential determinants of lease operations. For example, Koh and Jang (2009) explain the relationship between the internal funds, debt ratio, growth opportunities, financial distress of a firm and use of lease. They have been measured the availability of internal funds through few options: cash holding, cash flow and accumulated earnings and finally conducted to understand that firms with law internal funds are more likely to use lease.
Debt capacity refers to the upper point of debt that a company may take. Firms attempt at keeping the debt at a supportable level so that the pressure of the debt does not imply any further costs for the company. At the point when firms go beyond their debt capacity, leasing can represent an alternative (Ang and Peterson, 1984). When borrowing from a creditor, the latter can establish an upper debt level that is called ’debt covenant’. The demands imposed by these conditions make firms use leasing on condition their debt capacity is close to the level imposed by creditors (Duke et al., 2002). Consequently, given the
increase of the debt level, the firm is more likely to retort to lease.
Many studies examine how growth opportunity influences the leasing decision. Some authors, (Jang et al. 2008) find that firms with large growth opportunities may seek funds from debts or equities. Further, Koh and Jang (2009) show that by comparison to debt and equity-financing, lease brings results for companies that develop fast since they keep the same ownership structure and maintain the same debt capacity of the firms.
When bankruptcy has been declared, the leasing company can repossess the leased item from the beneficiary, which reduces the risk of the leasing firm. That’s why the leasing companies can afford to be more generous when dealing with the financial problems of the firm by comparison to other creditors. On the one hand, the firms that are financially healthy have access to additional leasing besides the other financing forms, if it is necessary. Having the opportunity to choose from so many options, the firms that are financially healthy are in the position of choosing the most advantageous financing source. Given this situation, it is less likely that this category of firms retorts to leasing to a higher degree by comparison to the firms that have financial problems. That is to say that firms that have financial problems are more likely to retort to lease (Koh and Jang, 2009).
level lease increase as firm size increases.
In has been shown that companies leasing behavior is correlated with ownership, liquidity and leverage (Landry, Fortin, Callimaci, 2013). These three factors can predict the propensity of leasing or buying an asset and can indicate the strategies companies use in order to achieve their financial objectives.
It is important to mention the interaction between the sale rates and the lease rates: their relationship is a negative one and it follows from a Granger causality (Adrikopoulos, Merkellos, 2015). Other forms of financial options, like Modaraba – a financial contract used in several Muslim countries, can be used to find a way to finance the companies’ activity. Modaraba showed better results than leasing when it comes to profit efficiency and cost efficiency and, even more, Modaraba companies had efficiency drop during the financial crisis (Afza, Asghar, 2014).
The
evolution
of
the
Romanian leasing market
For the past eight years the leasing industry as a factor of economic growth has proved to be the only financing solution that enhanced concrete commercial bounds between producers and customers, the financial leasing remains, from the point of view of the newly-funded volume, the biggest donor of the Romanian economy in the area of non-banking financial institutions.
The leasing industry sticks to the general directions of the economy. Although the penetration rate of the leasing in Romania's GDP is very low compared to the developed countries in
the European Union, varying between 4.8% in 2008 (the financial leasing market being at 3.5 % of the GDP) and 1.5 % in 2013 (the financial leasing decreased to 0.9 % of the GDP), its evolution in recent years confirms its role as a barometer for the Romanian economy (ALB, 2015).
The share of the financial leasing in the total leasing operations was influenced by the changes that have occurred in the Tax Code in the second half of 2008.
If in the period 2007-2009 the leasing market in Romania proved to be particularly vulnerable, reacting to the economic changes, the volume of the transactions dropping from almost 5 billion Euros in 2007 to 1.3 billion in 2009, after this date the total annual value of the new financial leasing contracts did not have significant changes, indicating a certain stabilization of the market, though the local economic conditions were difficult. The contraction of the credit demand of the companies for equipment and vehicles and the disappearance of the one for the real estate sector explain the modest level of financial leasing market in the following period. Few sectors attracted financial leasing, among them being the agriculture, services, only a few industries and the construction sector. In the period 2007-2012, the financial leasing has a strengthened contribution of 9.5 bn Euros with a total added value created in the Romanian economy, representing 1.2 % of the GDP in the whole period, noting that in 2007-2008 it was about 2.6 % of the GDP and in the period 2010-2012 of about 0.6 % of the GDP (ALB, 2015).
decrease in the duration of the leasing contracts due to the funding of the lesser value assets, machinery or second-hand equipment, of the insignificant financing rate of the buildings and also due to the decrease of the maximum degrees of indebtedness imposed by the NBR.
The decrease of the period of conclusion of the contracts was corroborated to a decrease of the new leasing contracts. The decrease of the financing in those years can be attributed to a lower investment demand, to the difficulties of re-controlling the assets of the clients who cannot pay anymore but also to the legal framework that does not support the leasing industry, the insolvency law and the amendment of the Tax Code generating many problems in the sector.
Since 2013 the leasing market begins to grow, in 2014 it continues the consolidation rhythm in line with the evolution of the national economy, where the main indicators were favorable to growth, in a context when
the demand from the SMEs and their appetite for investment have also marked a comeback.
The year 2015 marked a return to the leasing industry, the financing volume being of about 1.6 billion Euros, which represents a growth by 20% compared to 2014. The growth of the market was mainly driven by financing for heavy commercial vehicles, which was close as a share to the funding for passenger cars, at the end of September the share of heavy vehicles in the total financing is about 41%, while the passenger cars accounted for 47%. The car leasing which represents three quarters of the market increased by 21% in the first nine months up to 887 million Euros (www.zf.ro). The financing for equipment went through a moderate increase and it maintains a share similar to that of previous years (about 22-24% of the total financed volumes). The financed areas referred to agriculture, constructions, the private medical sector, manufacturing industry and services.
Figure 1. Financial Leasing Market in Romania
The estimates for the future evolutions of the market forecast growth of 15-20 % in the next years, if the GDP will have positive evolution, in an annual rate of 3-4 % (ALB, 2015).
In terms of leasing market concentration it is worth noting the fact that at the end of 2014 ten players held a market share of almost 84 % and in terms of the vehicle financing, segment that had at the end of 2014 a ratio of 76 % an overall financial lease financing, the first five players controlled more than half (50.82 %) of the financing of vehicles. It should be also noted that the financial leasing has about 60 % of the market represented by the non-bank financial institutions (ALB, 2015).
Research methodology
In this regard, we undertook a piece of quantitative marketing research in the period of time from April to June 2014, on a sample made up from 400 companies from Braşov county, using the proportionally stratified sampling method (stratifying according to the activity field: agriculture, industry, construction, trade and services; and according to the firm size: micro-enterprises, small enterprises and medium-sized enterprises). This sample size was set on the basis of the data issued by the county statistic department – the number of firms in the Braşov County, taking into account a minimal error rate of 5 %. The data collection method was the enquiry based on a questionnaire consisting of 42 questions.Two methods were used when applying the questionnaires: questionnaires were applied by e-mail and by an interview operator. The firms were selected from a list we had with
the firms in the Braşov County which were organized according to their field of activity and size. Depending on the proportion of each group, we randomly (we used a random number generator) chose from the list the companies to be applied the questionnaire. Then, the information obtained was brought together by using the software SPSS version 19.0 for Windows.
The research focused on finding a correlation between the turnover percentage assigned to leasing expenses and several influence factors. It also tries to link size of leasing with the same influence factors. In order to select relevant influence factors the Chi Square statistic was used. Then an incremental model was deployed so that at each step it can be controlled whether the new factor has a significant contribution to the model.
In other words bigger companies are relying more on leasing as a way of financing than small companies.
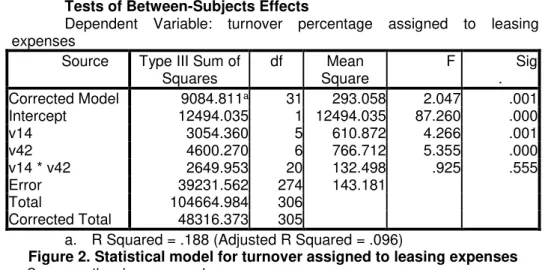
The second analysis was centered on the value of the leasing contract in
relation with the frequency of signing contracts, the number of employees and the interaction between these two independent variables (fig 2).
Tests of Between-Subjects Effects
Dependent Variable: turnover percentage assigned to leasing expenses
Source Type III Sum of Squares
df Mean Square
F Sig
. Corrected Model 9084.811a 31 293.058 2.047 .001
Intercept 12494.035 1 12494.035 87.260 .000
v14 3054.360 5 610.872 4.266 .001
v42 4600.270 6 766.712 5.355 .000
v14 * v42 2649.953 20 132.498 .925 .555
Error 39231.562 274 143.181
Total 104664.984 306
Corrected Total 48316.373 305
a. R Squared = .188 (Adjusted R Squared = .096)
Figure 2. Statistical model for turnover assigned to leasing expenses
Source: authors’ own research
The number of employees has a positive influence on the value of the leasing contract. Bigger companies are using larger contracts in order to sustain their activity. This variable in interaction with the number of signed contracts has a statistically significant
influence on the value of the contract. Similar with turnover percentage assigned to leasing expenses, the value of the leasing contact is correlated with the number of signed contracts. The more contracts are signed the bigger the value of each of them.
Tests of Between-Subjects Effects
Dependent Variable: value of the leasing contract Source Type III Sum of
Squares
df Mean Square F Sig.
Corrected Model 1493421974458.251a 20 74671098722.913 3.039 .000
Intercept 432070900755.737 1 432070900755.737 17.583 .000 v14 301222992083.989 5 60244598416.798 2.452 .034 v41 220906565444.744 3 73635521814.915 2.997 .031 v14 * v41 582916794066.581 12 48576399505.548 1.977 .026
Error 7740729231822.288 315 24573743593.087 Total 9760369691938.000 336
Corrected Total 9234151206280.540 335
a. R Squared = .162 (Adjusted R Squared = .109)
Figure 3. Statistical model for leasing contract value
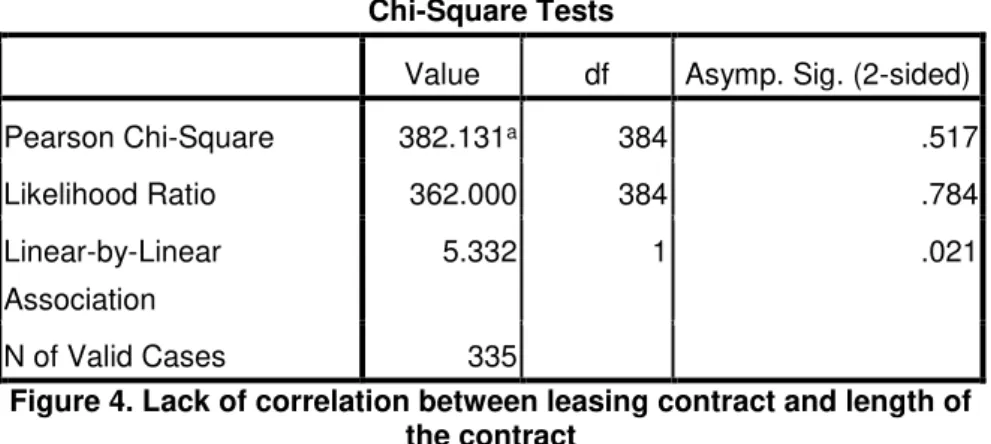
The analysis also tried to find correlations between the value of the contract and other variables like the length of the last contract, the perceived complexity of the leasing process, the perceived image of the leasing companies, the turnover of the
company or the legal status. None of these characteristics proved to be relevant. In the following figure we show the lack of correlation between the value of the last leasing contract and the length of the leasing contract.
Chi-Square Tests
Value df Asymp. Sig. (2-sided)
Pearson Chi-Square 382.131a 384 .517
Likelihood Ratio 362.000 384 .784
Linear-by-Linear
Association
5.332 1 .021
N of Valid Cases 335
Figure 4. Lack of correlation between leasing contract and length of the contract
Source: authors’ own research
Similar results were observed for all the variables presented above. Grouping the variables in larger stacks did not significantly improved the outcome of the test.
Conclusions
The leasing market proves to have several strong influence factors: the frequency of signing leasing contracts, the turnover of the company, the number of employees and the interaction between the number of employees and the frequency of signing leasing contracts. Our models shows that these factors can predict more than 15 % of the turnover percentage assigned to leasing expenses and the value of the leasing contract.
Given these results the leasing companies can adjust their offer by
taking into consideration these three factors and the described interaction. Furthermore the leasing market can use these factors in order to better predict the market evolution.
Nevertheless several factors that were expected to correlate with the value of the contracts proved to be statistically irrelevant. Further research can offer a different perspective on these factors and their impact.
Further research
REFERENCES
Achim, M.V. (2005). Leasing, o afacere de succes, Bucureşti, Editura Economică, 22. Adams, M., Hardwick, P. (1998). “Determinants of the leasing decision in United
Kingdom listed companies”, Applied Financial Economics 8 (5), 487-495. Adrikopoulos, A., Merkellos, R. (2015). “Dynamic interaction between markets for
leasing and delling automobiles”, Journal of Banking & Finance, No. 50, 260-270. Ang, J., Peterson, P.P. (1984). “The leasing puzzle”, Journal of Finance 39 (4),
1055-1065.
Afza, T., Asghar, A. (2014). “Efficiency of Modaraba and Leasing Companies in Pakistan”, Procedia – Social and Behavioral Sciences, no. 109, 470-482. ALB. (2015). Studiul „Sprijin pentru creştere în România. Analiza sectorului de
leasing financiar”, finalizat recent în cadrul parteneriatului dintre Asociaţia Societăţilor Financiare – ALB România/Diplomat Consult, Deloitte România şi Reff&Asociaţii, [online] Available at: http://www.piatafinanciara.ro/studiu-comparativ-relatia-leasing-crestere-economica/, [accesed 19 March 2014]. Bădulescu, D. (2010). Finanţarea IMM-urilor: dimensiunile nevoii şi răspunsurile
diferitelor structuri de creditare, Economie teoretică şi aplicată, vol. XVII, nr. 7 (548), 22-35.
Duke, J.C., Franz, D.P., Hunt, H.G., Toy, D.R. (2002), “Firm-specific determinants of off-balance sheet leasing: a test of the Smith/Wakeman model”,Journal of Business and Management 8 (4), 335-353.
Jang, S., Tang, C., Chen, M. (2008), “Financing behaviors of hotels companies”, International Journal of Hospitality Management 27, 478-487.
Koh, J.H., Jang, S. (2009), “Determinants of using operating lease in the hotel industry”, International Journal of Hospitality Management 28, 638-640. Landry, A., Fortin, A., Callimaci, A. (2013), “Family firms and lease decision”,
Journal of Family Business Strategy, No. 4, pp. 176-187.
Myers, S.C., Majluf, N.S. (1984), “Corporate financing and investment decisions when firms have information that investors do not have”, Journal of Financial Economics 13(2), 187-221.
Niţulescu G. (2008), The Romanian financial – banking guide, conducted under the auspices of the Romanian National Bank, 3rd edition, House of Guides
Publishing House, 111.
Shape, S.A., Nguyen, H.H. (1995). “Capital market imperfections and the incentive to lease”, Journal of Financial Economics 39 (2-3), 271-294.
http://www.zf.ro/banci-si-asigurari/piata-de-leasing-confirma-asteptarile-de-la- inceputul-anului-crestere-de-doua-cifre-si-finantari-de-circa-1-6-mld-euro-la-final-de-2015-14937559/, [accessed 5 March 2016].