Submitted5 December 2013 Accepted 19 May 2014 Published17 June 2014
Corresponding author
Constantino Mac´ıas Garcia, [email protected]
Academic editor
John Measey
Additional Information and Declarations can be found on page 22
DOI10.7717/peerj.420
Copyright
2014 Rodr´ıguez-Tejeda et al.
Distributed under
Creative Commons CC-BY 3.0
OPEN ACCESS
Geographic variation in the
advertisement calls of
Hyla eximia
and
its possible explanations
Ruth E. Rodr´ıguez-Tejeda1, Mar´ıa Guadalupe M´endez-C´ardenas2,
Valentina Islas-Villanueva3and Constantino Mac´ıas Garcia1 1Instituto de Ecolog´ıa, Universidad Nacional Aut ´onoma de M´exico, M´exico, Mexico 2Instituto de Investigaciones Antropol ´ogicas, Universidad Nacional Aut ´onoma de M´exico,
M´exico, Mexico
3Instituto de Ciencias del Mar y Limnolog´ıa, Universidad Nacional Aut ´onoma de M´exico, M´exico, Mexico
ABSTRACT
Populations of species occupying large geographic ranges are often phenotypically diverse as a consequence of variation in selective pressures and drift. This applies to attributes involved in mate choice, particularly when both geographic range and breeding biology overlap between related species. This condition may lead to in-terference of mating signals, which would in turn promote reproductive character displacement (RCD). We investigated whether variation in the advertisement call of the mountain treefrog (Hyla eximia) is linked to geographic distribution with respect to major Mexican river basins (Panuco, Lerma, Balsas and Magdalena), or to coexistence with its sister (the canyon treefrog,Hyla arenicolor) or another related species (the dwarf treefrog,Tlalocohyla smithii). We also evaluated whether call di-vergence across the main river basins could be linked to genetic structure. We found that the multidimensional acoustic space of calls from two basins whereH. eximia
currently interacts withT. smithii, was different from the acoustic space of calls from
H. eximiaelsewhere. Individuals from these two basins were also distinguishable from the rest by both the phylogeny inferred from mitochondrial sequences, and the genetic structure inferred from nuclear markers. The discordant divergence of
H. eximiaadvertisement calls in the two separate basins where its geographic range overlaps that ofT. smithiican be interpreted as the result of two independent events of RCD, presumably as a consequence of acoustic interference in the breeding cho-ruses, although more data are required to evaluate this possibility.
Subjects Animal Behavior, Evolutionary Studies, Zoology
Keywords Hyla eximia, Advertisement calls, Genetic and geographic distances, Acoustic interference, Geographic variation
INTRODUCTION
differences in ecology, such as prey availability (e.g.,Arnold, 1980;Bonansea & Vaira, 2007) or habitat structure (e.g.,Relyea, 2002;Skelly, 2004) can lead to differential adaptation between populations (Newman, 1992), but in species with generalized diets and habitat requirements such variation would have a limited effect on differentiation (e.g.,Virg´os, Llorente & Cort´es, 1999). On the other hand, environmental variation in the attributes that determine the transmission and reception of signals used in social (Wells, 1977;Sullivan & Wagner, 1988;Wagner, 1989) or sexual contexts (Searcy & Andersson, 1986) may lead to rapid population differentiation (Jennions & Petrie, 1997;Seehausen, van Alphen & Witte, 1997;Lougheed et al., 2006;Boul et al., 2007). This is because signals used by animals in a breeding context may convey information about the species, sex, breeding status, and even the condition of the sender (Gerhardt, 1992;Wilczynski & Chu, 2001), all of which may be relevant to conspecifics searching for mating partners (Butlin & Ritchie, 1994;Emerson, 2001;Forsman & Hagman, 2006). Geographic variation in mating signals has been widely reported in studies of character displacement, where specific traits (e.g., morphological, behavioral, ecological or physiological traits) differ among sympatric and allopatric populations due to the risk of maladaptive hybridization with related species (Brown & Wilson, 1956;Grant, 1972). Reproductive character displacement (RCD) is often studied in systems where sister species meet at typically narrow hybrid or tension zones (Butlin, 1987; Howard, 1993;Butlin & Ritchie, 1994). However an approach involving the study of signal variation across wide geographic areas, coupled with genetic and geographic data, could be helpful in identifying evolutionary patterns of signal evolution and tracing the links between micro and macro evolution of mating signals (Avise et al., 1987).
acoustic properties of the signals, such as frequency, duration, amplitude, temporal structure, etc.; see, for instance,Ryan & Rand (2003). In spite of variation, anuran songs are sufficiently stereotyped to permit females to identify and assess males (e.g., theHylidae; Gerhardt, 1991;Gerhardt, 1992), so much so thatHylaspp. have often been used as models to study pre-mating reproductive isolation amongst sister species (e.g.,Littlejohn, 1965; Ball & Jameson, 1966;Littlejohn, 1970;Duellman, 1973;Gerhardt, 1994;H¨obel & Gerhardt, 2003;Gerhardt, 2005).
Hyla eximiais a relatively small (ca. 3 cm) tree-frog endemic to the geologically complex Trans-Mexican Volcanic Belt (TMVB;de Cserna, 1989;Ferrari et al., 2012) and adjacent Mexican High Plateau (Duellman, 1970;Duellman, 2001). It gives its name to theH. eximia
species group (Smith et al., 2007), which includes eleven other species (Faivovich et al., 2005). The very similarH. wrightorumreplacesH. eximiato the north (through Arizona), andH. euphorbiaceais found to the south of the TMVB (allopatric withH. eximia).
H. plicatais endemic to the TMVB and is partially sympatric withH. eximia(Smith et al., 2007), andH. arenicoloris sympatric withH. eximiain parts of the Mexican Plateau. Like
H. eximia,H. arenicolorhas a wide geographic range; in the Mexican Plateau it is mainly found in the mountain zones of Balsas Basin, at elevations of 300–3000 m (Duellman, 2001).Tlalocohyla smithii(formerlyHyla smithii,Faivovich et al., 2005) is distributed in the Pacific lowlands of Mexico up to elevations of about 1000 m, from central Sinaloa to southern Oaxaca, and inland within the Balsas Basin (Duellman, 2001).Tlalocohyla smithii, is not part of theH. eximiagroup, but occupies the same matings pools.
Previous work has shown evidence of geographic variation inH. eximiacalls. Indeed, variation in pulse rate, call duration and the dominant frequency among recordings from several populations (Blair, 1960;Duellman, 1970;Sullivan, 1986;Duellman, 2001) was so great thatDuellman (1970)andDuellman (2001)concluded that the species lacks a typical call, though sample sizes per population were small. It has also been suggested that some variation in advertisement calls ofH. eximiamay be linked to RCD. Based on phonetic dataCort´es-Soto (2003)suggested thatH. eximiaandH. plicatahave evolved different advertisement calls in the 500 m altitudinal band (2400–2900 m asl) where their ranges overlap. There, the calls ofH. eximiaare shorter and contain fewer pulses than when the species are found in allopatry, suggesting that RCD has occurred. Here we describe the variation of the advertisement calls ofH. eximiaacross a substantial part of its geographic range, and explore whether this variation is linked to genetic structure (based on mitochondrial and nuclear DNA sequences), geography (i.e., hydrographic basins) and/or range overlaps with its sister species, the canyon treefrog (H. arenicolor), and a related species, the Mexican dwarf treefrog (Tlalocohyla smithii).
MATERIALS AND METHODS
Song descriptionBased on information from public databases we surveyed 51 locations whereH. eximia
Table 1 Populations sampled.Populations where advertisement calls ofHyla eximia,Hyla arenicolorandTlalocohyla smithiiwere recorded.
Population Symbol map
Latitude Longitude Chorus composition N
El Realejo, San Luis Potos´ı R 22◦40′23.98′′N −100◦25′5.45′′W H. eximiaallopatric 26 Laguna de Gerardo, San Luis Potos´ı L 22◦38′27.36′′N −100◦26′20.94′′W H. eximiaallopatric 29 Sierra de ´Alvarez, San Luis Potos´ı SA 22◦01′52.56′′N −100◦36′49.86′′W H. eximiaallopatric 15 Playita de San Rafael, Jalisco SR 20◦02′52.98′′N −103◦09′46.26′′W H. eximiaallopatric 25 Rancho Santa Elena, Hidalgo SE 20◦08′7.38′′N −98◦30′43.50′′W H. eximiasympatric
withH. arenicolor
18
Magdalena, Jalisco MA 20◦54′0.41′′N −103◦59′36.85′′W H. eximiasympatric
withT. smithii
20
Presa de Malinaltenango, Edo. de M´exico
PM 18◦48′32.01′′N −99◦43′26.18′′W H. eximiasympatric withT. smithii
7
Rancho Santa Elena, Hidalgo SE 20◦08′7.38′′N −98◦30′43.50′′W Hyla arenicolor 2 Km 58, San Luis Potos´ı K58 22◦01′12.18′′N −100◦36′7.26′′W Hyla arenicolor 7 Magdalena, Jalisco MA 20◦54′0.41′′N −103◦59′36.85′′W Tlalocohyla smithii 12 Presa de Malinaltenango,
Edo. de M´exico
PM 18◦48′32.01′′N −99◦43′26.18′′W Tlalocohyla smithii 5
Tecomatepec, Edo. de M´exico TC 18◦50′9.06′′N −99◦41′40.62′′W Tlalocohyla smithii 3
and to ensure the presence of the species in the breeding pools.Hyla eximiawas alone (allopatric) in four of the nine locations that were sampled. In two locations,H. eximia
was sympatric and formed breeding choruses withH. arenicolor, and in the remaining three withT. smithii(Table 1,Fig. 1). Here we considered “sympatric” the populations in which two species were found to simultaneously occupy the same microhabitat during the breeding season (form breeding choruses); this preliminary classification that will have to be confirmed with repeated sampling.
During the summer of 2011 we recorded advertisement calls from males of the three species. Calls were recorded in natural breeding aggregations with a directional microphone (SennheiserTMME66) connected to a digital recorder (MarantzTMPMD660). The microphone was held 1 m in front of the calling male, and the recording volume was adjusted to avoid saturation (0–6 dB). Each male was recorded for 1–1.5 min to ensure that adequate call series were obtained. Then we measured the body temperature of the frog by holding it from a hind limb and pointing an infrared thermometer (ExtechTM42529; ±0.05◦C) at its body, thus preventing heat transfer from the observer. Finally, we
measured the frog’s snout-vent length with a digital calliper (±0.05 mm) and collected a toe-clip from the distal phalanx of the fourth right front-leg digit for subsequent DNA extraction (seeGonser & Collura, 1996).
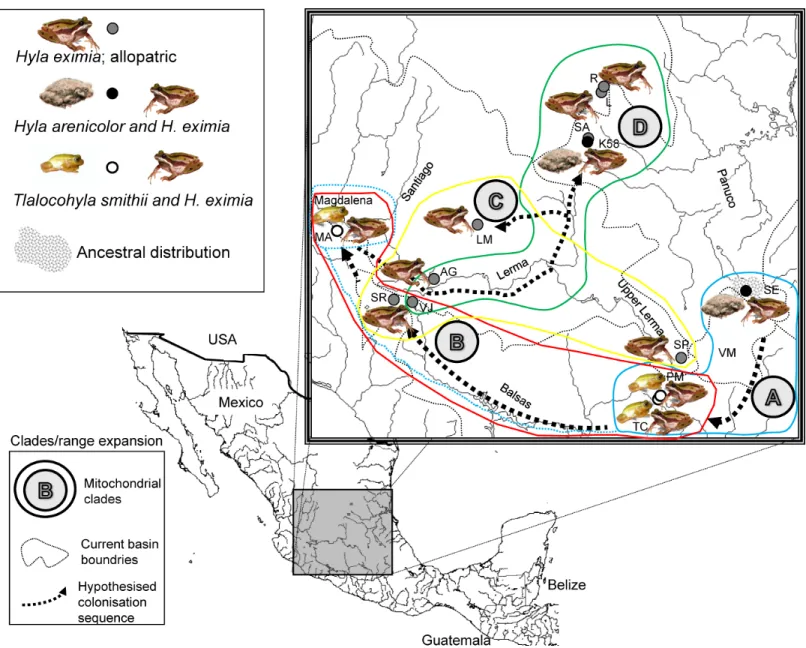
Figure 1 Localities sampled, chorus composition and mitochondrial clades.Hypothesized colonization routes ofH. eximiain central Mexico. The distribution of frogs belonging to clades A–D from a phylogenetic analysis of two concatenated mitochondrial genes (see text) is indicated with globes of different color (clade A, turquoise blue; clade B, red; clade C, yellow; D, green). Dotted arrows indicate the possible direction of the colonization, and are not intended to show the exact paths followed by the frogs. The occurrence of one individual from Magdalena in clade A is indicated with a dotted turquoise-blue line. Thin grey dotted lines represent boundaries between the major basins (Panuco, Lerma, Balsas and the currently closed Valley of Mexico), whereas rivers are indicated with continuous grey lines. Lerma River flows northwards until it meets the Santiago, which drains in the Pacific Ocean to the west. Balsas drains southwards, also in the Pacific, whereas the Panuco drains to the east, in the Gulf of Mexico. SeeTable 1for population codes.
pulse, PPF; kHz), pulse period (the sum of PD+IP, PP; s), pulse rate (pulses per second measured from the start of the first pulse to the start of the last pulse, PR; Hz), dominant frequency (frequency with the highest energy within the call, DF; kHz) and fundamental frequency (the lowest, or reference frequency of series of frequencies -called harmonics-that are its integer multiples, FF; kHz). Temporal variables were measured directly on the spectrogram, all the pulse variables were extracted with thePulse Train Analysisoption, and the frequency variables were obtained withPower spectrum logarithmicfunction (Fig. S1). Individual frogs were represented in the analyses by the average value of each call attribute.
To detect the call variation inH. eximiawe defined three chorus compositions: (1) allopatric, composed ofH. eximiamales only, (2)H. eximiain mixed choruses with
H. arenicolor, and (3)H. eximiain mixed choruses withT. smithii. We also analyzed the calls of (4)H. arenicolormales in mixed choruses withH. eximia, and (5)T. smithiimales in mixed choruses withH. eximia.
Call variation
To reduce the number of variables included in multivariate analyses in an objective way, we calculated for each chorus composition the correlation matrix of the twelve variables and discarded one attribute of any pair that had a correlation coefficient of≥0.7. Since temperature is known to affect several amphibian call attributes (Blair, 1958;Zweifel, 1959;Zweifel, 1968;Gerhardt & Mudry, 1980;Gayou, 1984;Gerhardt & Huber, 2002) we performed an analysis of covariance (ANCOVA) for each species and variable to assess the potential effect of temperature on call attributes from different chorus compositions. Since ANCOVAs showed a significant effect of temperature on call variables, we used ANCOVA residuals for all subsequent analyses.
Genetic variation
Using mitochondrial and nuclear genes we analyzed phylogenetic patterns to explore the extent to which geographic variation of songs across populations is related to genetic variation. Total genomic DNA of 30 individuals ofHyla eximiafrom 12 localities was extracted from EtOH-preserved toe clippings using the DNeasy Tissue Kit (QiagenTMInc., Valencia, CA, USA). Standard PCRs were carried out in 25µl reaction mixes with final concentrations of 1µM of each primer, 1.5 mM of MgCl2, 0.2 mM of each dNTP, 1xNH4 reaction buffer (50 mM Tris–HCl pH 8.8; 16 mM [NH4]2 SO4), 1.25 units of Taq DNA polymerase, and 1–4µl of DNA. Successful amplifications were performed using the following protocol: initial denaturing for 5 min at 95◦C, denaturing for 45 s at 94◦C,
annealing for 45 s at 48◦C (for Cyt b) and 57◦C (for ATP), extension for 1 min at 72◦C, final extension min for 7 min at 72◦C; denaturing, annealing and the first extension stage
were cycled 35–40 times.
We amplified two mitochondrial gene regions; cytochrome-b(754 bp) with the primers MVZ16-H AAATAGGAARTATCAYTCTGGTTTRAT and MVZ15-L GAAC-TAATGGCCCACACWWTACGNAA (Moritz et al., 1992;St¨ock et al., 2008;St¨ock et al., 2011), and ATPase subunits 8 and 6 (778 bp) with the primers LysAF CAACCAC-CCTTGATGAATGCC and C3FR GGGCTGGGGTTKACTATGTG (St¨ock et al., 2008; Bryson et al., 2010;Table S2). These mitochondrial gene regions have been found to be informative at different levels of variation within hylid frogs (references given above). We also amplified two nuclear gene regions using the same protocol as above, with a slight modification (see below). The Pro-opiomelanocortin gene region (POMC; 447 pb) with the primers POMC DRV F1 ATATGTCATGASCCAYTTYCGCTGGAA and POMC DRV R1 GGCRTTYTTGAAWAGAGTCATTAGWGG (annealing temperature =58◦C; modified fromWiens et al., 2005;Bryson et al., 2010), and the Rhodopsin (Rho)
gen region (291 pb) with the primers Rho1A ACCATGAACGGAACAGAAGGYCC and Rho1C CCAAGGGTAGCG AAGAARCCTTC (Bossuyt & Milinkovitch, 2000;Faivovich et al., 2005;Klymus et al., 2010;Table S2).
PCR products were sent for sequencing to the University of Washington High-Throughput Genomics Unit, Department of Genome Sciences, to the Service of DNA Sanger Sequencing. Sequences were aligned with Clustal X (Jeanmougin et al., 1998). Some regions were difficult to align, and were therefore adjusted manually using BioEdit (Hall, 1999). DNAsp (Librado & Rozas, 2009) was used to determine the number of unique haplotypes and invariable and polymorphic sites.
Phylogenetic analyses were performed for each gene using the maximum likelihood algorithm (ML; Felsenstein, 1981). We used the Hasegawa–Kishino–Yano model
We also constructed a haplotype network using TCS 2.1.1 for preliminary exploration of the phylogeographic relationships of the obtained haplotypes (Clement, Posada & Crandall, 2000). Genetic diversity was calculated as nucleotide(π )and haplotype (h)diversity for each of the sub-regions of the basins (northern, central and southern) using Arlequin 3.5.1.2 (Excoffier & Lischer, 2010), for both pairs of concatenated genes (mi-tochondrial and nuclear). We also calculated the population differentiation indexFSTand its significance levels, between pairs of basins, using Arlequin 3.5.1.2 (Excoffier & Lischer, 2010). To visualize the differences in nuclear genes between basins, the genetic structure was investigated using Structure 2.3 (Pritchard, Stephens & Donnelly, 2000) with the Ad-mixture model and correlated frequencies. A 500,000 burnin was employed and 5,000,000 generations of K 1 to 10 were performed with 10 iterations for each gene. We used the Evanno method to determine the true value of K (Evanno, Regnaut & Goudet, 2005) with the program Structure Harvester (Earl & vonHoldt, 2012). This analysis was employed only for nuclear genes, as it is not designed to find structure in linked or haploid genes.
Phenotypic, genetic and geographical distance
We performed Mantel tests and partial Mantel tests with 1000 resamplings using R v. 2.15.1 (R Development Core Team, 2011) to evaluate the correlation between acoustic (phenotypic), genetic and geographic distances. To calculate the acoustic matrix we employed the distances between canonical variables for each basin obtained from a discriminant analysis. The geographic distance was constructed with the geo- reference points taken at each locality; as the basin could include several localities, an average geo-reference was employed. The genetic distance matrix was built using theDxyvalues.
The project was reviewed and approved by the Consejo T´ecnico de la Investigaci ´on Cient´ıfica (CTIC) of UNAM.
RESULTS
Song description
We obtained 169 good quality recordings of male advertisement calls. These came from nineHyla arenicolor, 20Tlalocohyla smithiiand 140Hyla eximiafrom both sympatric and allopatric localities. A detailed description of the calls ofH. eximiabased on our complete sample is available in theSupplemental Information(see song descriptionS1) along with descriptions of those ofH. arenicolorandT. smithiiwhich are also summarized inTables 2 and3. Briefly, the calls ofH. eximiaconsist of a single note that lasts less than a quarter of a second, has a dominant frequency of about 2.6 kHz, and is composed of ca. 18 pulses. The call ofHyla arenicolor(Table 3) is roughly three times longer, (0.88 s), although it is composed of only a few more (about 20 pulses) but these pulses are longer and louder than the calls ofH. eximia. Calls ofH. arenicolorare lower-pitched than those ofH. eximia
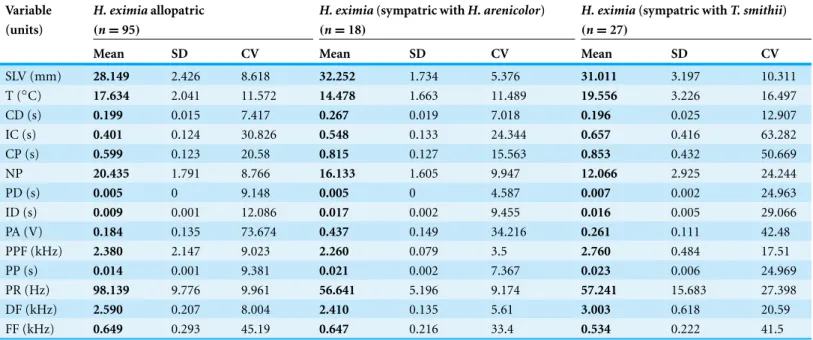
Table 2 Descriptive data forH. eximia.Descriptive data of morphology, body temperature and attributes of the advertisement calls ofH. eximia.
Variable H. eximiaallopatric H. eximia(sympatric withH. arenicolor) H. eximia(sympatric withT. smithii) (units) (n=95) (n=18) (n=27)
Mean SD CV Mean SD CV Mean SD CV
SLV (mm) 28.149 2.426 8.618 32.252 1.734 5.376 31.011 3.197 10.311
T (◦C) 17.634 2.041 11.572 14.478 1.663 11.489 19.556 3.226 16.497
CD (s) 0.199 0.015 7.417 0.267 0.019 7.018 0.196 0.025 12.907
IC (s) 0.401 0.124 30.826 0.548 0.133 24.344 0.657 0.416 63.282
CP (s) 0.599 0.123 20.58 0.815 0.127 15.563 0.853 0.432 50.669
NP 20.435 1.791 8.766 16.133 1.605 9.947 12.066 2.925 24.244
PD (s) 0.005 0 9.148 0.005 0 4.587 0.007 0.002 24.963
ID (s) 0.009 0.001 12.086 0.017 0.002 9.455 0.016 0.005 29.066
PA (V) 0.184 0.135 73.674 0.437 0.149 34.216 0.261 0.111 42.48
PPF (kHz) 2.380 2.147 9.023 2.260 0.079 3.5 2.760 0.484 17.51
PP (s) 0.014 0.001 9.381 0.021 0.002 7.367 0.023 0.006 24.969
PR (Hz) 98.139 9.776 9.961 56.641 5.196 9.174 57.241 15.683 27.398
DF (kHz) 2.590 0.207 8.004 2.410 0.135 5.61 3.003 0.618 20.59
FF (kHz) 0.649 0.293 45.19 0.647 0.216 33.4 0.534 0.222 41.5
Notes.
SVL, snout vent length; T, corporal temperature; CD, call duration; IC, inter-call duration; CP, call period; NP, number of pulses; PD, pulse duration; ID, inter-pulse duration; PA, pulse amplitude; PPF, pulse peak frequency; PP, pulse period; PR, pulse rate; DF, dominant frequency; FF, fundamental frequency.
Some males produced a third note with different structure and duration than the previous two, but it is not clear whether this is also part of the advertisement call. For our analyses we considered just the first note, as it is the most constant element in our recordings, and it is the one more likely to interfere with the advertisement calls ofH. eximiacalls. Spectrograms of typical advertisement calls of the three species are shown inFig. 2.
Call variation
The following variables were highly correlated in the calls ofHyla eximiain allopatry: pulse amplitude and interval between calls (0.997), and call period and inter-call duration (0.993). In sympatry withH. arenicolor, the correlated variables of calls ofH. eximiawere: call period and inter-call duration (0.991), pulse rate and inter-pulse duration (−0.984), pulse period and inter-pulse duration (0.954), and pulse rate and pulse period (−0.953). Correlated variables in the contact zone betweenH. eximiaandT. smithiiwere: call period and inter-call duration (0.999), pulse period and pulse duration (0.996), pulse rate and inter-pulse duration (−0.966), dominant frequency and pulse peak frequency (0.943), and pulse rate and number of pulses (0.920).
The following attributes of the calls ofH. arenicolorwere intercorrelated: pulse rate and inter-pulse duration (−0.985), pulse period and inter-pulse duration (0.965), pulse rate and pulse period (−0.941), and call period and inter-call duration (0.917). In the case of
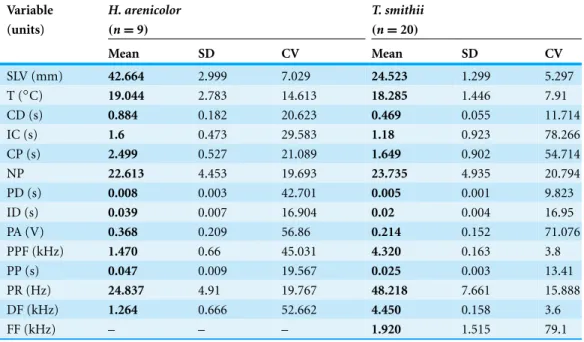
Table 3 Descriptive data for H. arenicolorand T. smithii. Descriptive data of morphology, body temperature and attributes of the advertisement calls ofH. arenicolorandT. smithii.
Variable H. arenicolor T. smithii
(units) (n=9) (n=20)
Mean SD CV Mean SD CV
SLV (mm) 42.664 2.999 7.029 24.523 1.299 5.297
T (◦C) 19.044 2.783 14.613 18.285 1.446 7.91
CD (s) 0.884 0.182 20.623 0.469 0.055 11.714
IC (s) 1.6 0.473 29.583 1.18 0.923 78.266
CP (s) 2.499 0.527 21.089 1.649 0.902 54.714
NP 22.613 4.453 19.693 23.735 4.935 20.794
PD (s) 0.008 0.003 42.701 0.005 0.001 9.823
ID (s) 0.039 0.007 16.904 0.02 0.004 16.95
PA (V) 0.368 0.209 56.86 0.214 0.152 71.076
PPF (kHz) 1.470 0.66 45.031 4.320 0.163 3.8
PP (s) 0.047 0.009 19.567 0.025 0.003 13.41
PR (Hz) 24.837 4.91 19.767 48.218 7.661 15.888
DF (kHz) 1.264 0.666 52.662 4.450 0.158 3.6
FF (kHz) – – – 1.920 1.515 79.1
Notes.
SVL, snout vent length; T, corporal temperature; CD, call duration; IC, inter-call duration; CP, call period; NP, number of pulses; PD, pulse duration; ID, inter-pulse duration; PA, pulse amplitude; PPF, pulse peak frequency; PP, pulse period; PR, pulse rate; DF, dominant frequency; FF, fundamental frequency. The calls ofH. arenicolorshowed no fundamental frequency.
Considering that correlations≥0.7 indicate redundant variables, we dropped from the analyses the following variables: call period (CP), pulse period (PP), pulse rate (PR), inter-pulse duration (ID) and pulse peak frequency (PPF). Consequently, analyses were performed using seven variables: call duration (CD), inter-call duration (IC), number of pulses (NP), pulse duration (PD), pulse amplitude (PA), dominant frequency (DF) and fundamental frequency (FF).
Covariance analyses revealed that temperature, chorus composition and the interaction between them affect call attributes of each species in different ways (Table S1). To control for the effect of temperature, in cases where the interaction between temperature and chorus composition was significant we used the residuals from the ANCOVA, rather than the original variable, in all subsequent analyses.
Figure 2 Call spectrograms and averages of call attributes.(A) Spectrograms of advertisement calls produced by individuals of each chorus composition (A, allopatricHyla eximia; B,Hyla arenicolor; C,H. eximiasympatric withH. arenicolor; D,Tlalocohyla smithii; and E,H. eximia
sympatric withT. smithii). (B) From top to bottom, mean temporal, pulse and frequency variables. Categories in theXaxis correspond to the chorus composition. Variable identity, indicated next (right) to the solid symbols, apply also to the open symbols (e.g., circles of both types represent the same variable). Solid symbols indicateH. eximiapopulations and open symbols represents the heterospecific species.
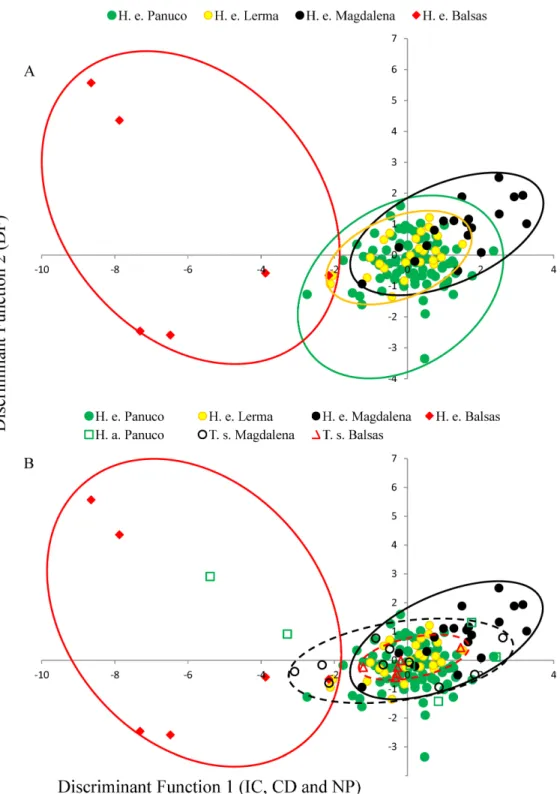
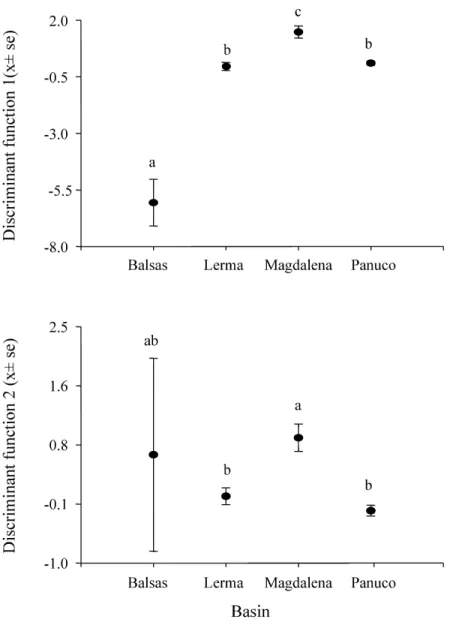
Figure 4 Scores ofHyla eximiacalls from the first two canonical functions.Post hoc tests reveal significant differences (indicated by different letters above the bars) between the mean values of canonical scores of calls from different basins.
T. smithiireveals no overlap of canonical acoustic space between the calls ofH. eximiafrom the Balsas basin and those of co-occurringT. smithii, and a partial overlap between the calls ofH. eximiaat Magdalena those of the localT. smithii(Fig. 3). There is complete overlap between the canonical acoustic space of calls ofH. eximiafrom the several populations in the Panuco basin, whether they are sympatric withH. arenicoloror not, and between those and the calls ofH. eximiain the Lerma basin (Fig. 3).
Genetic variation
Table 4 Genetic diversity of populations ofH. eximia.Haplotype(h)and nucleotide(π )diversity of populations ofH. eximiafrom each sub-region of the sampled basins. The two mitochondrial genes were concatenated as well as the two nuclear genes.
Basin mtDNA Nuclear
N,H h π N,H h π
Northern Panuco 6, 4 0.800 (±0.172)
0.022 (±0.016)
5, 4 0.900 (±0.161)
0.123 (±0.080) Central Panuco 7, 5 0.857
(±0.137)
0.023 (±0.016)
6, 5 0.933 (±0.122)
0.200 (±0.121) Southern Panuco 3, 3 1.000
(±0.272)
0.064 (±0.052)
1, 1 1.000 (±0.000)
0.000 (±0.000) Northern Lerma 2, 2 1.000
(±0.500)
0.058 (±0.062)
– –
Central Lerma 9, 9 1.000 (±0.052)
0.077 (±0.045)
8, 8 1.000 (±0.062)
0.190 (±0.109) Southern Lerma 3, 3 1.000
(±0.272)
0.064 (±0.052)
3, 3 1.000 (±0.272)
0.157 (±0.123)
Magdalena 2, 2 1.000
(±0.500)
0.461 (±0.466)
3, 3 1.000 (±0.272)
0.118 (±0.094)
Balsas 3, 3 1.000
(±0.272)
0.269 (±0.205)
2, 2 1.000 (±0.500)
0.088 (±0.095) Notes.
Standard deviation in parentheses.
N, analyzed samples number;H, number of haplotypes.
concatenated gene pair are shown inTable 4. Mitochondrial nucleotide diversity was generally low, and the high values from Magdalena(π=0.462)and Balsas(π=0.269)are probably not reliable since standard deviations are high due to small sample size (Table 4). Mitochondrial haplotype diversity was very high in all regions (Table 4). Since in most cases the number of haplotypes is identical to the sample size, it does not represent the populations’ haplotype diversity.
Table 5 Population differentiation ofH. eximia.
Basin Northern panuco Central panuco Southern panuco Central lerma Southern lerma Magdalena Balsas
Northern Panuco – −0.025
(P=0.513)
0.133 (P=0.405)
0.175
(P=0.009)
0.304
(P=0.036)
0.303
(P=0.045)
0.300 (P=0.054) Central Panuco −0.088
(P=0.639)
– 0.189
(P=0.117)
0.060 (P=0.090)
0.239
(P=0.000)
0.089 (P=0.234)
0.075 (P=0.225) Southern Panuco 0.904
(P=0.027)
0.915 (P=0.018)
– 0.182
(P=0.045)
0.223 (P=0.486)
0.294 (P=0.099)
0.363 (P=0.333) Central Lerma 0.101
(P=0.090)
0.077 (P=0.126)
0.840
(P=0.000)
– 0.236
(P=0.027)
−0.017 (P=0.504)
0.098 (P=0.063) Southern Lerma 0.328
(P=0.027)
0.309
(P=0.009)
0.863 (P=0.090)
0.131 (P=0.063)
– 0.268
(P=0.063)
0.299 (P=0.18)
Magdalena 0.334
(P=0.081)
0.445 (P=0.054)
0.565 (P=0.099)
0.364 (P=0.387)
0.161 (P=0.108)
– −0.031
(P=0.396)
Balsas 0.538
(P=0.018)
0.611
(P=0.000)
0.628 (P=0.153)
0.560
(P=0.000)
0.409 (P=0.198)
−0.431 (P=0.495)
–
Notes.
MitochondrialFSTbelow, and nuclearFSTabove the diagonal.
The mitochondrial haplotype network seems to reflect the distribution of individuals into the major basins (Fig. 6). Again, haplotypes from southern Panuco are not connected to any other basin. Two of the three Balsas haplotypes are also isolated from those from other basins, except for one haplotype from Magdalena (the other Balsas haplotype is linked to haplotypes from central Lerma). By and large, the haplotypes from central and northern Panuco are closely linked, and relatively closely linked also to those from the three Lerma sub basins (Fig. 6).
We found 25 different haplotypes of concatenated nuclear genes (Table 4). The greatest nucleotide diversity of nuclear genes was found in central Panuco(π =0.200)central (π =0.190)and southern Lerma (0.157), but the latter has a high standard deviation (Table 4). Just as with mitochondrial genes, nuclear haplotype diversities were often≃1 and are certainly overestimations.
The reconstruction based on nuclear genes is much less clear, with very shallow branches, although it also suggests a link between Lerma and both Balsas and Panuco (Fig. 5). The degree of nuclear genetic differentiation ofH. eximiabetween regions is roughly consistent with that shown by mitochondrial genes: populations from southern Lerma (mitochondrial clade A) are significantly differentiated from those in northern and central Panuco, as well as central Lerma (mitochondrial clade D), yet this latter clade is formed by frogs from regions that are significantly differentiated by nuclear genes. Frogs from Magdalena (mitochondrial clade B) are significantly differentiated from those from northern Panuco (mitochondrial clade D;Table 5).
Figure 6 Haplotype network of concatenated mitochondrial genes.Haplotypes correspond to each of the basins’ sub-regions.
the population structure is too subtle (Latch et al., 2006), which could be our case as the reduced sample size failed to produce significant values of population differentiation.
Phenotypic, genetic and geographical distance
There was no significant correlation between call variation and geographic distance (Mantel testr=0.125,P=0.306) even when controlling for mitochondrial (Mantel partial testr=0.126,P=0.218) or nuclear(r=0.185,P=0.234),Dxy. NuclearDxywas not correlated with geographic distance(r=0.097,P=0.311). This pattern remains when controlling for call variation(r=0.167,P=0.293). We did find a significant correlation between geographic distance and mitochondrialDxy(r=0.372,P=0.035), and this association remained when controlling for call variation(r=0.372,P=0.042). Call variation was not correlated with either mitochondrial(r=0.022,P=0.409)or nuclear (r=0.426,P=0.108),Dxy, even when controlling for geographic distance (mitochondrial
Dxy,r=0.026,P=0.419; nuclearDxy,r=0.443,P=0.128).
DISCUSSION
Song descriptionIntraspecific variation in the attributes of the advertisement calls ofH. arenicolorand of the
across the whole geographic range of the Canyon treefrog revealed that such differences are not large enough to promote speciation, although a degree of assortative mating preferences was evident over large geographic scales (Klymus & Gerhardt, 2012), and at least some of that variation may be linked to introgression with species in theH. eximia
group (seeKlymus et al., 2010). Three populations ofHyla wrightorum, a member of the latter group, were found to produce calls of different dominant frequency (and two differed in the duration of their calls;Gergus, Reeder & Sullivan, 2004). Pulse rate, an attribute often involved in mate recognition in these treefrogs (e.g.,Klymus & Gerhardt, 2012), was not different between populations, thus the authors suggested that call variation in
H. wrightorumis unlikely to promote mating isolation (although we note that differences in dominant frequency may be due to local adaptation to facilitate transmission (Littlejohn, 1970) and could thus lead to assortative mating).
Variation in the calls ofH. eximiahas been less comprehensively studied. An early report byBlair (1960)classified some populations as either producing “slow” (PR∼50 Hz) or “fast” (PR∼100 Hz) calls. That study was not concerned with exploring the possible origin of such variation but we now know that two populations then categorized as producing slow calls correspond to chorus whereH. eximiais sympatric withT. smithii; in these we recorded songs with low PR and relatively high PPF and DF. In fact, the calls of frogs recorded in sympatry withT.smithiiwere more variable (mean CV=29%) than those recorded elsewhere (seeTable 2andFig. 2). This is unlikely to be an artifact of a small sample size, as this estimate is based on a larger sample than that used to assess variation in the attributes of calls produced in sympatry withH. arenicolor. In mixed choruses, calls ofH. eximiamay be masked by the long and/or the short notes ofT. smithiicalls. This may mean that males ofH. eximiaconfront unpredictable note periodicity, since calls of
T. smithiiare made of different notes, both of variable length, and each with a different and also variable period (Table 3). This would promote high variation of inter-call interval inH. eximia, which may explain the high coefficient of variation of IC in those sympatric localities (Table 2).
We could not discern a link between type of variable (temporal, frequency, structural) and the amount of variation it harbors (Table 2;Fig. 2), but pulse peak frequency, dominant frequency, call duration and pulse duration were the least variable elements ofH. eximiacalls, and may thus be useful elements for species recognition.
Call variation
In his comprehensive work,Duellman (1970)andDuellman (2001)suggested that
frequency plays an important role in species recognition (Littlejohn, 1965;Gerhardt & Davis, 1988;Gerhardt, 1994) and mate discrimination in other hylids (e.g.,Dendropsophus ebraccatus (Hyla ebraccata),Wollerman, 1998). There are no published studies of mate choice inH. eximia, but in the relatedH. arenicolorfemale mate choice is influenced by call PR (Klymus & Gerhardt, 2012), which is a key element for maintaining isolation between lineages ofH. arenicolorand might also lead, through its correlation with NP, to reproductive isolation between populations ofH. eximia. Call (CD) and inter-call duration (IC) reflect calling effort, and the energy required to increase them depends on body size (Gerhardt, 1994). We found no differences between populations or basins in body size, thus it is possible that variation of call structure in the Balsas localities is adaptive, enabling
H. eximiato avoid interference from the calls ofT. smithii(see below).
Calls ofH. eximiain Balsas and Magdalena were also different in frequency (DF; function 2) from calls elsewhere. This is a static trait (Gerhardt, 1991) that, like other such attributes of treefrog calls, is determined by morphology (several body structures, muscle size, larynx structure, among others;Dubley & Rand, 1991;McClelland, Wilczynski & Ryan, 1996;Wells, 2001;Gerhardt & Huber, 2002), resulting in structural similarity of notes and seemingly simple calls (compared to the more complex bird song). A change in this attribute would be energetically costly, and it is therefore likely that the observed variation in DF is the result of selection to improve communication efficiency, which may include avoiding interference from heterospecific calls.
In the Balsas and Magdalena basins,H. eximiashares choruses withT. smithii. Calls ofH. eximiafrom Balsas are very variable, and their canonical acoustic space (as defined by discriminant functions 1 and 2;Fig. 3) is different from that of the localT. smithii, which seems to indicate reproductive character displacement, a possibility that requires corroboration from more intense sampling and phonotaxis studies. Interestingly, the distribution in the same canonical space of the calls ofH. eximiafrom Magdalena shows that they are shifted in the opposite canonical direction than in Balsas. This can be caused by random differences being selected in different populations, as long as they reduce overlap withT. smithii.However, we note that in MagdalenaH. eximiaalso faces interference with another frog species;Gastrophryne sp. Probably because this is a larger frog, its calls are much longer and lower-pitched (Duellman, 2001) than to those ofH. eximia. This results in a more limited acoustic space available forH. eximiato accommodate its call to avoid masking, being simultaneously limited by the temporal and spectral attributes of the calls ofT. smithiiand ofGastrophryne sp.
While at Balsas and Magdalena the calls ofH. eximiadiffer significantly from those of their conspecifics elsewhere (and are completely different from those ofT. smithiiin Balsas), calls from localities sympatric withH. arenicolor(mostly in the Panuco basin) were similar to those from allopatric populations. This was unexpected since, although both species are morphologically very different (H. arenicolorhas a rough, granulated skin and is somewhat larger than smooth-skinnedH. eximia, which is more similar to the smaller
is evidence suggesting ancient mitochondrial introgression (Bryson et al., 2010;Klymus & Gerhardt, 2012), thus mating interference between them was expected. It may be that, since the calls ofH. eximiaandH. arenicolorare substantially different, there is no, or little, interference between their calls to drive character displacement, although it may also be that the interaction of the two species is too recent in northern and central Panuco (see below).
Genetic variation
While call variation between some regions covered in our sample is supported by mitochondrial phylogeny and population structure, it cannot be properly interpreted as a consequence of the phylogeny ofH. eximia. The mitochondrial reconstruction is generally well supported, although it draws a puzzling phylogenetic history ofH. eximia. It suggests, very preliminarily, that the populations in our sample originated in the south-east of the current species distribution, and expanded clockwise in their colonization of what are now the basins of rivers Balsas, Magdalena (Ameca), and central (lower) Lerma, from where they may have reached the northern (Santiago) and southern (upper) Lerma, as well as the central and upper Panuco basins (Fig. 1). Published phylogeographic hypotheses forH. arenicoloroften include a few sequences ofH. eximiaand cover a limited portion of its geographic range, so that no phylogeographic hypotheses for this species can be drawn from them (seeBryson et al., 2010;Klymus & Gerhardt, 2012). Thus we provisionally propose the above phylogenetic scenario ofH. eximiabased on our best -resolved (mitochondrial) reconstruction (Fig. 1).
Phenotypic, genetic and geographical distance
Call variation between the regions covered in our sample may not be random (i.e., due to drift); it was greater in particular basins (Balsas and Magdalena) and chorus compositions (H. eximia–T. smithii), but did not correlate with genetic or geographic distance. Absence of a correlation between acoustic and genetic distance has been reported in other studies. For instance, inOophaga(Dendrobates)pumilio(Pr¨ohl et al., 2007), the correlation is lost when the analysis controls for geographic distance, and a similar effect occurred in some populations of the T ´ungara frogEngystomops(Physalaemus)pustulosus(Ryan, Rand & Weigt, 1996). These findings are perhaps not surprising, since one of the forces that most effectively shape anuran call attributes is female mate choice (Boul et al., 2007), and this is most effective when mistakes are penalized as in a hybrid zone. Thus we should in fact expect greater call variation between populations when reproductive character displacement is favored in at least one of them (Pfennig and Pfennig, 2010), than when populations are distant geographically but do not face mating call interference. Indeed, we rule out the possibility that a correlation between genetic and acoustic distance exists but was undetected, since we have adequate call samples, and, as expected, mitochondrial genetic distance was correlated with geographic distance, making it likely that our genetic screening is unbiased.
result of morphological differentiation in attributes that influence call production (e.g., the body size inHyla leucophyllata,Lougheed et al., 2006; see alsoEmerson, 2001;Gerhardt & Huber, 2002;Castellano et al., 2002;Hoskin et al., 2005). However, an exploratory analysis failed to detect significant differences in body size among populations ofH. eximia, thus it is unlikely that the variation in calls found between basins is due to differences in the body size. Other causes of call differentiation include local differences in call assemblage (Wollerman & Wiley, 2002), in signal transmission efficiency (related to the type of habitat), or in sexual selection (acting through reproductive isolation mechanisms). The first is compatible with our explanation of call differentiation to avoid masking by the calls ofT. smithii, whereas the reported lack of differentiation amongst the populations not sympatric withT. smithii, which cover a much larger and presumably environmentally variable geographic area, argues against the other two. We thus provisionally propose that the geographic variation of advertisement calls ofH. eximiain the Balsas and Magdalena basins populations is due to reproductive character displacement produced by sharing mating choruses with the related and morphologically similarT. smithiiand with the distantly relatedGastrophryne sp.
ACKNOWLEDGEMENTS
Field work was conducted under SEMARNAT license SGPA/DGVS/03580/09, and was made possible by the help of J ´Avila, A Archundia, A Briones, J Carillo, C Ch´avez, MA Mart´ınez, M Nu˜nez, Tom´as, MJ God´ınez, B Pe˜na, I Barbosa, C Montes, N Lifshitz, E Quir ´oz, N Miranda, M Su´arez, M M´endez, E Berm ´udez, R Beamonte, F Mendieta, A Freyermuth, C R´ıos, A Garc´ıa, E V´azquez and E ´Avila-Luna, who also provided logistical support. G Cort´es-Soto and A R´ıos-Chel´en helped with the initial sound analyses, S Benitez-Vieyra and a former referee provided useful statistical advice and L Kiere helped improving the English. This project was founded with a grant from CONACyT (83779) to CMG, and a scholarship to RERT also from CONACyT. This paper constitutes RERT’s partial fulfilment of the Graduate Program in Biological Sciences of the National Autonomous University of Mexico (UNAM).
ADDITIONAL INFORMATION AND DECLARATIONS
Funding
This work was financed with funds from a CONACyT (Consejo Nacional de Ciencia y Tecnolog´ıa; the Mexican Science Council) grant 83779 to CMG, and a scholarship to RERT from CONACyT. The funders had no role in study design, data collection and analysis, decision to publish, or preparation of the manuscript.
Grant Disclosures
The following grant information was disclosed by the authors:
Competing Interests
The authors declare there are no competing interests.
Author Contributions
• Ruth E. Rodr´ıguez-Tejeda conceived and designed the experiments, performed the experiments, analyzed the data, wrote the paper, prepared figures and/or tables, reviewed drafts of the paper.
• Mar´ıa Guadalupe M´endez-C´ardenas performed the experiments, analyzed the data, prepared figures and/or tables, reviewed drafts of the paper.
• Valentina Islas-Villanueva analyzed the data, prepared figures and/or tables, reviewed drafts of the paper.
• Constantino Mac´ıas Garcia conceived and designed the experiments, contributed
reagents/materials/analysis tools, wrote the paper, prepared figures and/or tables, reviewed drafts of the paper.
Animal Ethics
The following information was supplied relating to ethical approvals (i.e., approving body and any reference numbers):
The project was approved by the Consejo T´ecnico de la Investigaci ´on Cient´ıfica (CTIC), the Science Council of our university (UNAM). There is no specific ethical committee in our university for reviewing proposals of this type (the ethical committees deal mostly with medical proposals and with the ethics of academic interactions), but all projects have to be approved by the internal council of scientific research which looks at, amongst other things, the ethical aspects of all projects.
Field Study Permissions
The following information was supplied relating to field study approvals (i.e., approving body and any reference numbers):
Secretar´ıa de Manejo y Aprovechamiento de los Recursos Naturales (SEMARNAT)–the Mexican Ministery for thew Environment–provided the licence to conduct field work on the species included in this report, and to collect tissue samples for DNA extraction (SGPA/DGVS/03580/09).
DNA Deposition
The following information was supplied regarding the deposition of DNA sequences: We have submitted the sequences to GenBank and have accession numbers for the nuclear and mitochondrial genes; these can be found inTable S2(GenBank submission ID 1700625).
Supplemental Information
REFERENCES
Am´ezquita A, Lima AP, Jehle R, Castellanos L, Ramos ´O, Crawford AJ, Gasser H, H¨odl W. 2009. Calls, colours, shape, and genes: a multi-trait approach to the study of geographic variation in the Amazonian frogAllobates femoralis.Biological Journal of the Linnean Society98:826–838
DOI 10.1111/j.1095-8312.2009.01324.x.
Arnold SJ. 1980.The microevolution of feeding behaviour. In: Kamil A, Sargent T, eds.Foraging behaviour: ecological, ethological and psychological approaches. New York: Garland.
Avise JC. 2000.Phylogeography. The history and formation of species. Cambridge, Massachussets: Harvard University Press.
Avise JC, Arnold J, Ball RM, Bermingham E, Lamb T, Neigel E, Reeb CA, Saunders NC. 1987. Intraspecific phylogeography: the mitochondrial DNA bridge between population genetics and systematic.Annual Review of Ecology and Systematics18:489–522.
Ball RW, Jameson DL. 1966.Premating mechanisms in sympatric and allopatricHyla regillaand
Hyla californiae.Evolution20(4):533–551DOI 10.2307/2406588.
Blair WF. 1958.Mating call in the speciation of anuran amphibians.The American naturalist
92(862):27–51DOI 10.1086/282007.
Blair WF. 1960.Mating call as evidence of relations in theHyla eximiagroup.The Southwestern Naturalist5(3):129–135DOI 10.2307/3669508.
Bonansea MI, Vaira M. 2007.Geographic variation of the diet ofMelanophryniscusrubriventris
(Anura: Bufonidae) in Northwestern Argentina.Journal of Herpetology41(2):231–236
DOI 10.1670/0022-1511(2007)41[231:GVOTDO]2.0.CO;2.
Bossuyt F, Milinkovitch MC. 2000.Convergent adaptive radiations in Madagascan and Asian ranid frogs reveal covariation between larval and adult traits.Proceedings of the National Academy of Sciences of the United States of America97:6585–6590DOI 10.1073/pnas.97.12.6585. Boul KE, Funk WC, Darst R, Cannatella DC, Ryan MJ. 2007.Sexual selection drives speciation
in an Amazonian frog.Proceedings of the Royal Society Biological Sciences274:399–406
DOI 10.1098/rspb.2006.3736.
Brown WL, Wilson EO. 1956. Character displacement. Systematic Zoology5:49–64
DOI 10.2307/2411924.
Brush JS, Narins PM. 1989.Chorus dynamics of a neotropical amphibian assemblage: comparison of computer simulation and natural behaviour.Animal Behaviour37:33–44
DOI 10.1016/0003-3472(89)90004-3.
Bryson Jr RW, de Oca AN, Jaeger JR, Riddle BR. 2010.Elucidation of cryptic diversity in a widespread nearctic treefrog reveals episodes of mitochondrial gene capture as frogs diversified across a dynamic landscape.Evolution64(8):2315–2330.
Butlin RK. 1987. Speciation by reinforcement. Trends in Ecology & Evolution 2:8–13
DOI 10.1016/0169-5347(87)90193-5.
Butlin RK, Ritchie MG. 1994.Slater PJB, Halliday TR, Barret P, eds.Behaviour and evolution. New York: Cambridge University Press.
Castellano S, Cuatto B, Rinella R, Rosso A, Giacoma C. 2002.The advertisement call of the european treefrogs (Hyla arborea): a multilevel study of variation.Ethology108(1):75–89
DOI 10.1046/j.1439-0310.2002.00761.x.
Chek AA, Bogart JP, Lougheed SC. 2003.Mating signal partitioning in multi-species assemblages: a null model test using frogs.Ecology Letters6(3):235–247
Clement M, Posada D, Crandall K. 2000.TCS: a computer program to estimate gene genealogies.
Molecular Ecology9(10):1657–1660DOI 10.1046/j.1365-294x.2000.01020.x.
Cocroft RB, Ryan MJ. 1995.Patterns of advertisement call evolution in toads and chorus frogs.
Animal Behaviour49:283–303DOI 10.1006/anbe.1995.0043.
Cort´es-Soto G. 2003.Diferenciaci ´on en el canto deHyla eximiaeHyla plicataen zonas de simpatr´ıa. BSc thesis, Universidad Aut ´onoma del Estado de M´exico.
Coyne JA, Orr HA. 2004.Speciation. Sunderland, Massachusetts: Sinauer Associates, Inc.
de Cserna Z. 1989.An outline of the geology of Mexico. In: Bally AW, Palmer AR, eds.The geology of north america-an overview, Vol. A. Colorado: Geological Society of North America, 233–264. Dubley R, Rand AS. 1991.Sound production and vocal sac inflation in the T ´ungara Frog,
Physalaemus pustulosus(Leptodactylidae).Copeia(2):460–470.
Duellman WE. 1970.Hylid frogs of Middle America,Monographs of the Museum of Natural History,
Vol. 1. Lawrence: University of Kansas. i-xi, 1–753.
Duellman WE. 1973. Frogs of the Hyla geografica group. Copeia (3):515–533
DOI 10.2307/1443117.
Duellman WE. 2001.Hylid frogs of Middle America. Vol 1. Ithaca, NY: Society for the Study of Amphibians and Reptiles, 694 pp.
Earl DA, vonHoldt BM. 2012.STRUCTURE HARVESTER: a website and program for visualizing
STRUCTURE output and implementing the Evanno method.Conservation Genetics Resources
4(2):359–361DOI 10.1007/s12686-011-9548-7.
Emerson S. 2001.Male advertisement calls: behavioural variation and physiological processes. In: Ryan M, ed.Anuran comumnication. Washington and London: Smithsonian Institution Press, 36–44.
Evanno G, Regnaut S, Goudet J. 2005.Detecting the number of clusters of individuals using the software STRUCTURE: a simulation study.Molecular Ecology14(8):2611–2620
DOI 10.1111/j.1365-294X.2005.02553.x.
Excoffier L, Lischer HE. 2010.Arlequin suite ver 3.5: a new series of programs to perform population genetics analyses under Linux and Windows. Molecular Ecology Resources
10:564–567DOI 10.1111/j.1755-0998.2010.02847.x.
Faivovich J, Haddad CFB, Garcia PCA, Frost DR, Campbell JA, Wheeler WC. 2005.Systematic review of the frog family Hylidae, with special reference to Hylinae: phylogenetic analysis and taxonomic revision.Bulletin of the American Museum of Natural History294:1–240
DOI 10.1206/0003-0090(2005)294[0001:SROTFF]2.0.CO;2.
Felsenstein J. 1981.Evolutionary trees from DNA sequences: a maximum likelihood approach.
Journal of Molecular Evolution17:368–376DOI 10.1007/BF01734359.
Ferrari L, Orozco-Esquivel T, Manea V, Manea M. 2012. The dynamic history of the
Trans-Mexican Volcanic Belt and the Mexico subduction zone.Tectonophysics522–523:122–149
DOI 10.1016/j.tecto.2011.09.018.
Forsman A, Hagman M. 2006.Calling is an honest indicator of paternal genetic quality in Poison Frogs.Evolution60(10):2148–2157DOI 10.1111/j.0014-3820.2006.tb01852.x.
Gamble LR, MacGarigal K, Compton BW. 2007.Fidelity and dispersal in the pond- breeding amphibian,Ambystoma opacum: implications for spatio-temporal population dynamics and conservation.Biological Conservation139(3–4):247–257DOI 10.1016/j.biocon.2007.07.001. Gayou DG. 1984.Effects of temperature on the advertisement call ofHyla versicolor.Copeia
Gergus EWA, Reeder TW, Sullivan BK. 2004.Geographic variation inHyla wrightorum: advertisement calls, allozymes, mtDNA, and morphology. Copeia 4:758–769
DOI 10.1643/CG-04-061R.
Gerhardt HC. 1991.Female mate choice in treefrogs: static and dynamic criteria.Animal Behaviour
42:615–635DOI 10.1016/S0003-3472(05)80245-3.
Gerhardt HC. 1992.Multiple messages in acoustic signals.Seminars in the Neurosciences4:391–400
DOI 10.1016/1044-5765(92)90047-6.
Gerhardt HC. 1994.Reproductive character displacement of female mate choice in the grey treefrog,Hyla chrysoscelis.Animal Behaviour47:959–969DOI 10.1006/anbe.1994.1127. Gerhardt HC. 2005.Advertisement-call preferences in diploid-tetraploid treefrogs (Hyla
chrysoscelis andHyla versicolor): implications for mate choice and the evolution of communication systems.Evolution59(2):395–408DOI 10.1111/j.0014-3820.2005.tb00998.x. Gerhardt HC, Davis MS. 1988.Variation in the coding of species identity in the advertisement calls ofLitoria verreauxi(Anura: Hylidae).Evolution42(3):556–565DOI 10.2307/2409039. Gerhardt HC, Huber F. 2002.Acoustic communication in insects and Anurans. Common problems
and diverse solutions. Chicago and London: The University of Chicago Press.
Gerhardt HC, Mudry KM. 1980.Temperature effects on frequency preferences and advertisement call frequencies in the treefrog,Hyla cinerea(Anura: Hylidae).Journal of Comparative Physiology
137:1–6DOI 10.1007/BF00656911.
Gonser RA, Collura RV. 1996.Waste not, want not: toe-clips as a source of DNA.Journal of Herpetology30(3):445–447DOI 10.2307/1565192.
Grant PR. 1972.Convergent and divergent character displacement.Biological Journal of the Linnean Society4:39–68DOI 10.1111/j.1095-8312.1972.tb00690.x.
Hall TA. 1999.BioEdit: a user-friendly biological sequence alignment editor and analysis program for Windows 95/98/NT.Nucleic Acids Symposium Series41:95–98.
Hartmann MT, Giasson LOM, Hartmann PA, Haddad CFB. 2005.Visual communication
in Brazilian species of anurans from the Atlantic forest.Journal of Natural History
39(19):1675–1685DOI 10.1080/00222930400008744.
H¨obel G, Gerhardt C. 2003. Reproductive character displacement in the acoustic communication system of green tree frogs (Hyla cinerea).Evolution57(4):894–904
DOI 10.1111/j.0014-3820.2003.tb00300.x.
Hoskin CJ, Higgie M. 2010.Speciation via interactions: the divergence of mating traits within species.Ecology Letters13:409–420DOI 10.1111/j.1461-0248.2010.01448.x.
Hoskin CJ, Higgie M, McDonald KR, Moritz C. 2005.Reinforcement drives rapid allopatric speciation.Nature437:1353–1356DOI 10.1038/nature04004.
Howard DJ. 1993.Reinforcement: origin, dynamics and fate of an evolutionary hypothesis. In: Harrison RG, ed.Hybrid zones and the evolutionary process. New York: Oxford University Press, 46–69.
Jeanmougin F, Thompson JD, Gouy M, Higgins DG, Gibson TJ. 1998.Multiple sequence alignment with ClustalX.Trends in Biochemical Sciences23:403–405
DOI 10.1016/S0968-0004(98)01285-7.
Klymus KE, Humfeld SC, Marshall VT, Cannatella D, Gerhardt HC. 2010.Molecular patterns of differentiation in canyon treefrogs (Hyla arenicolor): evidence for introgressive hybridization with the Arizona treefrog (H. wrightorum) and correlations with advertisement call differences.
Journal of Evolutionary Biology23(7):1425–1435DOI 10.1111/j.1420-9101.2010.02008.x. Klymus KE, Gerhardt HC. 2012.AFLP markers resolve intra-specific relationships and infer
genetic structure among lineages of the canyon treefrog,Hyla arenicolor.Molecular Phylogenetics and Evolution65:654–667DOI 10.1016/j.ympev.2012.07.028.
Latch EK, Dharmarajan G, Glaubitz JC, Rhodes OEJ. 2006.Relative performance of Bayesian clustering software for inferring population substructure and individual assignment at low levels of population differentiation.Conservation Genetics7:295–302
DOI 10.1007/s10592-005-9098-1.
Laugen AT, Laurila A, R¨as¨anen K, Meril¨a J. 2003.Latitudinal countergradient variation in the common frog (Rana temporaria) development rates-evidence for local adaptation.Journal of Evolutionary Biology16:996–1005DOI 10.1046/j.1420-9101.2003.00560.x.
Librado P, Rozas J. 2009.DnaSP v5: a software for comprehensive analysis of DNA polymorphism data.Bioinformatics25:1451–1452DOI 10.1093/bioinformatics/btp187.
Littlejohn MJ. 1965.Premating isolation in theHyla ewingicomplex (Anura: Hylidae).Evolution
19:234–243DOI 10.2307/2406376.
Littlejohn MJ. 1970. A reappraisal of mating call differentiation in Hyla cadaverina
(=Hyla californiae) andHyla regilla.Evolution25:98–102DOI 10.2307/2406502.
Lougheed SC, Austin JD, Bogart JP, Boag PT, Chek AA. 2006.Multi-character perspectives on the evolution of intraspecific differentiation in a neotropical hylid frog.BMC Evolutionary Biology
6:23DOI 10.1186/1471-2148-6-23.
McClelland BE, Wilczynski W, Ryan M. 1996.Correlations between call characteristics and morphology in male cricket frogs (Acris crepitans).The Journal of Experimental Biology
199:1907–1919.
Moritz C, Uzzell T, Spolsky S, Hotz H, Darevsky I, Kupriyanova L, Danielyan F. 1992.The material ancestry and approximate age of parthenogenetic species of caucasian rock lizards (Lacerta: Lacertidae).Genetica87:53–62DOI 10.1007/BF00128773.
Newman RA. 1992.Adaptive plasticity in amphibian metamorphosis.Bioscience42(9):671–678
DOI 10.2307/1312173.
Panhuis TM, Butlin R, Zuk M, Tregenza T. 2001.Sexual selection and speciation.Trends in Ecology and Evolution16:364–371DOI 10.1016/S0169-5347(01)02160-7.
Pfennig DW, Pfennig KS. 2010.Character displacement and the origins of diversity.The American Naturalist176(1):S26–S44DOI 10.1086/657056.
Posada D. 2008.jModelTest: phylogenetic model averaging.Molecular Biology and Evolution
25(7):1253–1256DOI 10.1093/molbev/msn083.
Pritchard JK, Stephens M, Donnelly P. 2000.Inference of population structure using multilocus genotype data.Genetics155:945–959.
Pr¨ohl H, Hagemann S, Karsch J, H¨obel G. 2007.Geographic variation in male sexual signals in strawberry poison frogs (Dendrobates pumilio).Ethology113:825–837
DOI 10.1111/j.1439-0310.2007.01396.x.
Relyea RA. 2002.Local population differences in phenotypic plasticity: predator-induced changes in wood frog tadpoles.Ecological Monographs72:77–93
DOI 10.1890/0012-9615(2002)072[0077:LPDIPP]2.0.CO;2.
Reynolds RG, Fitzpatrick BM. 2007.Assortative mating in poison-dart frogs based on an ecologically important trait.Evolution61(9):2253–2259DOI 10.1111/j.1558-5646.2007.00174.x. Ryan MJ, Rand AS. 2003.Sexual selection in female perceptual space: how female t ´ungara frogs
perceive and respond to complex population variation in acoustic mating signals.Evolution
57(11):2608–2618.
Ryan MJ, Rand AS, Weigt LA. 1996.Allozyme and advertisement call variation in the T ´ungara frog,Physalaemus pustulosus.Evolution50(6):2435–2453DOI 10.2307/2410711.
Schwartz JJ, Buchanan BW, Gerhardt HC. 2002. Acoustic interactions among male gray treefrogs,Hyla versicolor, in a chorus setting.Behavioral Ecology and Sociobiology53:9–19
DOI 10.1007/s00265-002-0542-7.
Searcy WA, Andersson M. 1986.Sexual selection and the evolution of song.Annual Review of Ecology and Systematics17:507–533DOI 10.1146/annurev.es.17.110186.002451.
Seehausen O, van Alphen J, Witte F. 1997.Cichlid fish diversity threatened by eutrophication that curbs sexual selection.Science277:1808–1811DOI 10.1126/science.277.5333.1808.
Skelly DK. 2004.Microgeographic countergradient variation in the wood frog, Rana sylvatica.
Evolution58(1):160–165DOI 10.1111/j.0014-3820.2004.tb01582.x.
Smith SA, de Oca AN, Reeder TW, Wiens JJ. 2007.A phylogenetic perspective on elevational species richness patterns in Middle American treefrogs: why so few species in lowland tropical rainforests?Evolution61:1188–1207DOI 10.1111/j.1558-5646.2007.00085.x.
St¨ock M, Dubey S, Klutsch C, Litvinchuk SN, Scheidt U, Perrin N. 2008.Mitochondrial and nuclear phylogeny of circum-Mediterranean tree frogs from theHylaarborea group.Molecular Phylogenetics and Evolution49(3):1019–1024DOI 10.1016/j.ympev.2008.08.029.
St¨ock M, Horn A, Grossen C, Lindtke D, Sermier R, Betto-Colliard C, Dufresnes C, Bonjour E, Dumas Z, Luquet E, Maddalena T, Sousa HC, Martinez-Solano I, Perrin N. 2011.Ever-young sex chromosomes in European tree frogs.PLoS Biology9(5):E1001062
DOI 10.1371/journal.pbio.1001062.
Sullivan BK. 1986.Advertisement call variation in the Arizona tree frog,Hyla wrightorumTaylor, 1938.Great Basin Naturalist46:378–381.
Sullivan BK, Wagner Jr E. 1988.Variation in advertisement and release calls, and social influences on calling behaviour in the gulf coast toad (Bufo valliceps).Copeia4:1014–1020
DOI 10.2307/1445726.
Taylor RC, Klein BA, Stein J, Ryan MJ. 2008. Faux frogs: multimodal signalling and the value of robotics in animal behaviour. Animal Behaviour 76:1089–1097
DOI 10.1016/j.anbehav.2008.01.031.
Virg ´os E, Llorente M, Cort´es Y. 1999.Geographical variation in genet (Genetta genetta) diet: a literature review.Mammal Review29(2):119–128DOI 10.1046/j.1365-2907.1999.00041.x. Wagner Jr WE. 1989.Social correlates of variation in male calling behaviour in Blanchard’s
cricket frog, Acris crepitans blanchardi.Ethology 82(19):27–45DOI 10.1111/j.1439-0310.1989.tb00485.x.
Wells KD. 1977.The social behaviour of anuran amphibians.Animal Behaviour25:666–693
Wells KD. 2001.The energetics of calling in frogs. In: Ryan M, ed.Anuran communication. Washington and London: Smithsonian Institution Press, 45–60.
Wells KD, Schwartz JJ. 2007.The behavioral ecology of anuran communication. In: Narins PM, Feng AS, Fay RR, Popper AN, eds.Hearing and sound communication in amphibians. New York: Springer, 44–86.
West-Eberhard MJ. 1983.Sexual selection, social competition, and speciation.The Quarterly Review of Biology58(2):155–183DOI 10.1086/413215.
Wiens JJ. 2004.What is speciation and how should we study it?American Naturalist163:914–923
DOI 10.1086/386552.
Wiens JJ, Fetzner JW, Parkinson CL, Reeder TW. 2005.Hylid frog phylogeny and sampling strate-gies for speciose clades.Systematic Biology54(5):778–807DOI 10.1080/10635150500234625. Wilczynski W, Chu J. 2001.Acoustic communication, endocrine control, and the neurochemical
systems of the brain. In: Ryan M, ed.Anuran communication. Washington and London: Smithsonian Institution Press, 23–35.
Wollerman L. 1998.Stabilizing and directional preferences of femaleHyla ebraccatafor calls differing in static properties.Animal Behaviour55(6):1619–1630DOI 10.1006/anbe.1997.0697. Wollerman L, Wiley RH. 2002.Possibilities for error during communication by neotropical
frogs in a complex acoustic environment.Behavioral Ecology and Sociobiology52:465–473
DOI 10.1007/s00265-002-0534-7.
Yamaguchi A, Gooler D, Herrold A, Patel S, Pong WW. 2008.Temperature-dependent regulation of vocal pattern generator. Journal of Neurophysiology100:3134–3143
DOI 10.1152/jn.01309.2007.
Zweifel RG. 1959.Effect of temperature on call of the frog,Bombina variegata.Copeia4:322–327
DOI 10.2307/1439890.
Zweifel RG. 1968.Effects of temperature, body size, and hybridization on advertisement calls of toads, Bufo a. americanusand Bufo woodhoussii fowleri.Copeia 2:269–285
DOI 10.2307/1441753.
Zeisset I, Beebee TJC. 2008.Amphibian phylogeography: a model for understanding historical aspects of species distributions.Heredity101:109–119DOI 10.1038/hdy.2008.30.