Divergence in the
D. melanogaster
and
D. pseudoobscura
Lineages
Ineˆs C. Conceic¸a˜o1¤, Montserrat Aguade´1,2*
1Departament de Gene`tica, Facultat de Biologia, Universitat de Barcelona, Barcelona, Spain,2Institut de Recerca de la Biodiversitat, Universitat de Barcelona, Barcelona, Spain
Abstract
Background:In insects, like in most invertebrates, olfaction is the principal sensory modality, which provides animals with essential information for survival and reproduction. Odorant receptors are involved in this response, mediating interactions between an individual and its environment, as well as between individuals of the same or different species. The adaptive importance of odorant receptors renders them good candidates for having their variation shaped by natural selection.
Methodology/Principal Findings: We analyzed nucleotide variation in a subset of eight Or genes located on the 3L chromosomal arm ofDrosophila melanogasterin a derived population of this species and also in a population ofDrosophila pseudoobscura. Some heterogeneity in the silent polymorphism to divergence ratio was detected in theD. melanogaster/D. simulanscomparison, with a single gene (Or67b) contributing,37% to the test statistic. However, no other signals of a very
recent selective event were detected at this gene. In contrast, at the speciation timescale, the MK test uncovered the footprint of positive selection driving the evolution of two of the encoded proteins in bothD. melanogaster—OR65c and OR67a —andD. pseudoobscura—OR65b1 and OR67c.
Conclusions:The powerful polymorphism/divergence approach provided evidence for adaptive evolution at a rather high proportion of theOrgenes studied after relatively recent speciation events. It did not provide, however, clear evidence for very recent selective events in eitherD. melanogasterorD. pseudoobscura.
Citation:Conceic¸a˜o IC, Aguade´ M (2010) Odorant Receptor (Or) Genes: Polymorphism and Divergence in the D. melanogasterandD. pseudoobscura Lineages. PLoS ONE 5(10): e13389. doi:10.1371/journal.pone.0013389
Editor:Robert DeSalle, American Museum of Natural History, United States of America
ReceivedJuly 25, 2010;AcceptedSeptember 21, 2010;PublishedOctober 13, 2010
Copyright:ß2010 Conceic¸a˜o, Aguade´. This is an open-access article distributed under the terms of the Creative Commons Attribution License, which permits unrestricted use, distribution, and reproduction in any medium, provided the original author and source are credited.
Funding:I.C.C. was supported by predoctoral fellowship SFRH/BD/11107/2002 from Fundacao para a Ciencia e a Tecnologia, Portugal. This work was supported by grants BFU2004-02253 and BFU2007-63229 from Comision Interdepartamental de Ciencia y Tecnologia, Spain, and 2005SGR-00166 from Comissio Interdepartamental de Recerca i Innovacio Tecnologica, Generalitat de Catalunya, Spain, to M.A. The funders had no role in study design, data collection and analysis, decision to publish, or preparation of the manuscript.
Competing Interests:The authors have declared that no competing interests exist.
* E-mail: [email protected]
¤ Current address: Instituto Gulbenkian de Cieˆncia, Oeiras, Portugal
Introduction
Animals can recognise and discriminate chemical signals in the environment, which provides essential information for survival and can profoundly influence their behaviour [1]. In the case of airborne molecules, the recognition starts with their interaction with odorant receptors that reside in the olfactory receptor neurons (ORNs; [2]). These ORNs transmit signals into the Central Nervous System, where they are processed, ultimately leading to behavioural responses.
Odorant receptor (Or) genes encode signal-transduction proteins with seven transmembrane domains. In insects, they are members of a large and rather old multigene family, with orthologs in orders as diverse as Diptera, Homoptera, Hymenoptera and Coleoptera (e.g., [3,4,5]). Because olfaction contributes to find food and mates as well as to detect predators, genes involved in olfactory perception are candidates to have evolved by the action of positive natural selection. Indeed, a maximum likelihood analysis of nonsynon-ymous and synonnonsynon-ymous divergence across five species of the
melanogaster subgroup with complete genome sequences revealed that the overall evolution of theOrfamily during the last,12 MY
was nonneutral [6]. Also, the comparison ofOrpolymorphism in a specieswide sample ofDrosophila simulans and divergence of those fromD. melanogasterorthologs provided some evidence of adaptive evolution of OR proteins in theD. simulanslineage [6].
The analysis of polymorphism, unlike that of divergence, can uncover the footprint left on DNA sequences by very recent selective events. Moreover, the analysis of polymorphism and divergence at coding regions constitutes a powerful approach to detect the action of recurrent positive selection driving to fixation amino acid changes after relatively recent speciation events. In an effort to uncover the action of positive selection acting onOrgenes at these two timescales, we have analyzed within-population variation in two well characterized species (D. melanogasterandD. pseudoobscura) as well as divergence to a closely related species (D. simulansandD. miranda, respectively) at a subset of eightOrgenes —Or63a,Or65a-b-c
Muller’s D element). InD. pseudoobscura, theOrgenes studied are located on the XR chromosomal arm, with the exception of genes
Or65b2, Or65b4 and Or65b5 that are located on element C (chromosome 3) and gene Or67a on element E (chromosome 2) due to transposition events that predated the X-autosome fusion [7]. Our multilocus analysis of polymorphism and divergence provided no clear indication of very recent action of positive selection on the
Orgenes studied. It did, however, uncover the footprint of positive selection driving the evolution of a relatively large proportion of the encoded proteins in both the D. melanogaster and D. pseudoobscura
lineages.
Results and Discussion
Levels of polymorphism
Table 1 summarizes the estimated levels of nucleotide variation at the Or genes studied in Drosophila melanogaster and D. pseudoobscura. A total of 18.9 and 19.5 kb were analyzed in each of these species, respectively (Table S1). The number of segregating sites was 445 in D. melanogaster and 421 in D. pseudoobscura, with the former species exhibiting a lower overall proportion of polymorphic sites with singletons (31%) than the latter species (62%). In both species, the estimated nonsynonymous nucleotide diversity was almost ten-fold lower than synonymous estimates (Table 1). Estimates of noncoding diversity did not differ significantly from those of synonymous diversity in either D. melanogasterorD. pseudoobscura(Wilcoxon signed-rank test; P = 0.31 and 0.36, respectively), which would seem in contrast with the
higher level of constraint at intergenic regions than that at synonymous sites previously observed inD. melanogaster/D. simulans
comparisons [8,9]. Moreover, similarly to previous surveys [10,11,12], no significant difference in the level of either noncoding or synonymous polymorphism was detected in D. pseudoobscura between the sex-linked and autosomal genes (Wil-coxon signed-rank test; P = 0.22 and 0.18, respectively). The time elapsed since the X-autosome fusion (8–12 My; [13]) cannot probably account for these results since it would seem sufficient for variation at the newly X-linked arm (XR) to have attained the new equilibrium and therefore for the newly sex-linked genes to exhibit the expected reduction of variation relative to autosomal genes. The previously detected bias in the species sex-ratio toward a higher proportion of females [14] might be one of the factors contributing to the detected similarity.
There is evidence of recombination in the history of all genes studied in bothD. melanogaster and D. pseudoobscura (i.e.,Rm$1), with the exception of geneOr67bin the latter species (Table S2). As expected from recombination rates based on genetic map distances, the overall degree of genetic association between polymorphisms (as summarized by the ZnS statistic; Table S2) was generally higher inD. melanogaster(from 0.20 to 0.66) than in
D. pseudoobscura(from 0.14 to 0.53).
No clear indication of very recent adaptive substitutions
Multilocus HKA tests were performed using silent polymor-phism (in D. melanogaster and D. pseudoobscura) and divergence (between D. melanogaster and D. simulans, and between D.
Table 1.Nucleotide variation in different functional regions of theOrgenes.
S p Haplotypes K
Species Gene Na nc s a Totalb nc s a Total No. Hd K
nc Ks Ka Ka/Ks
D. melanogaster Or63a 12 28 14 6 48 (13) 0.009 0.016 0.002 0.007 10 0.97 0.050 0.118 0.011 0.089
Or65a 14 17 17 8 42 (14) 0.005 0.023 0.002 0.006 13 0.99 0.028 0.110 0.023 0.208
Or65b 13 11 4 6 21 (0) 0.023 0.005 0.003 0.006 7 0.83 0.170 0.160 0.033 0.207
Or65c 12 6 34 6 47 (24) 0.014 0.039 0.002 0.011 11 0.99 0.121 0.155 0.034 0.221
Or67a 12 52 17 2 71 (36) 0.011 0.015 0.0004 0.007 12 1 0.106 0.202 0.078 0.388
Or67b 13 20 2 1 23 (4) 0.009 0.004 0.0002 0.004 10 0.95 0.090 0.214 0.009 0.044
Or67c 14 34 26 7 67 (34) 0.006 0.022 0.002 0.006 8 0.82 0.061 0.197 0.009 0.047
Or69a 11 91 23 14 128 (27) 0.023 0.021 0.003 0.014 11 1 0.079 0.119 0.032 0.265
Total 259 137 50 447 (152)
Average 0.013 0.018 0.002 0.008 0.944 0.088 0.159 0.029 0.184
D. pseudoobscura Or63a 8 39 9 12 60 (35) 0.039 0.011 0.005 0.014 8 1 0.082 0.065 0.011 0.173
Or65b1 8 21 22 5 48 (26) 0.034 0.028 0.002 0.015 8 1 0.063 0.058 0.024 0.411
Or65b2 7 7 12 7 26 (16) 0.011 0.017 0.002 0.007 7 1 - - -
-Or65b4 6 13 14 17 44 (36) 0.019 0.020 0.007 0.012 6 1 0.048 0.061 0.017 0.285
Or65b5 7 26 21 11 58 (27) 0.013 0.029 0.005 0.012 7 1 0.053 0.115 0.021 0.183
Or67a 8 22 32 12 66 (42) 0.036 0.039 0.004 0.015 8 1 0.078 0.077 0.015 0.199
Or67b 8 7 4 1 12 (6) 0.003 0.004 0.0003 0.002 7 0.96 0.021 0.030 0.005 0.180
Or67c 8 47 24 2 73 (43) 0.011 0.030 0.001 0.009 8 1 0.028 0.040 0.005 0.121
Or69a 8 20 7 7 34 (30) 0.002 0.003 0.001 0.002 8 1 0.033 0.038 0.008 0.224
Total 202 145 74 421 (261)
Average 0.019 0.020 0.003 0.010 0.996 0.051 0.060 0.013 0.222
S, no. of segregating sites;p, nucleotide diversity;K, nucleotide divergence; nc, noncoding; s, synonymous; a, nonsynonymous;Hd, haplotype diversity.
aNumber of lines sequenced.
bNumber of singletons are given in parentheses.
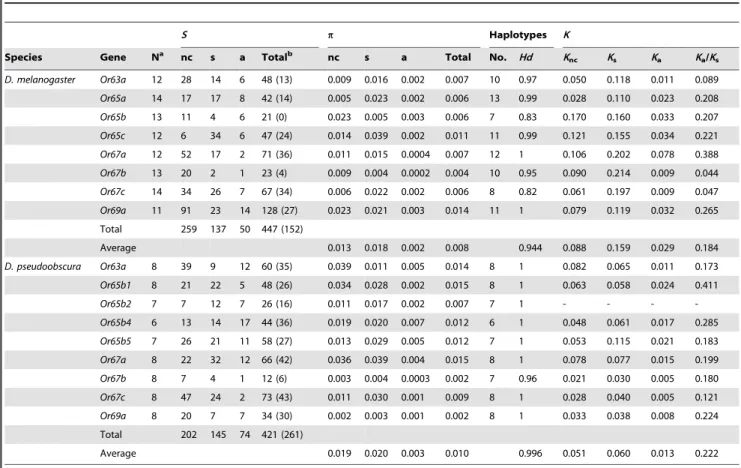
pseudoobscura and D. miranda, respectively; Fig. 1). Only in theD. melanogaster/D. simulanscomparison, the low probability associated to the test statistic (x2= 13.27; P = 0.07) pointed to a possible decoupling between levels of polymorphism and divergence across genes. In this comparison, a single gene exhibiting a local reduction in polymorphism —Or67b— contributed 36.6% to the test statistic. However, no clear signature of a recent selective sweep was detected in the pattern of polymorphism at this gene using either summary statistics based on the frequency spectrum (Tajima’s D and normalized Fay and Wu’s H [16,17,18]; see below) or the Kim and Stephan test [15], which also considers the spatial distribution of variation (results not shown).
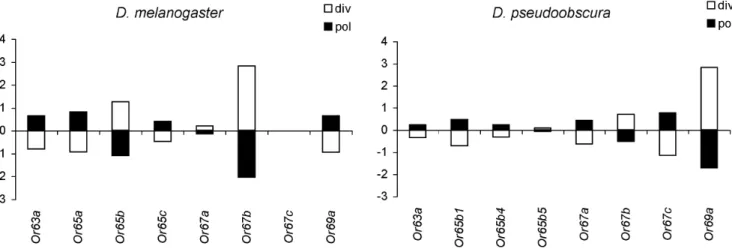
The frequency distribution of nucleotide variants was investi-gated using Tajima’sDand normalized Fay and Wu’sH(Fig. 2; [16,17,18]). InD. melanogaster, the estimatedDvalues varied widely across genes whereas the H estimates were generally negative (Fig. 2). The estimated values did not depart from neutral expectations either under stationarity or under the bottleneck scenario proposed for derived European populations ([19,20,21]; results not shown).
In D. pseudoobscura, a general skew toward negative values of both Tajima’s D and Fay and Wu’s H was observed, which resulted in average negative values for both statistics (20.648 and 20.265, respectively). A similar observation concerning the folded frequency spectrum (i.e., Tajima’s D statistic) was previously reported in this species and led the authors to consider a scenario of population expansion as the most plausible explanation for the detected pattern [11,22].
Evidence for adaptive evolution of ORs in theD. melanogasterandD. pseudoobscura lineages
The MK test that was performed for each gene separately yielded highly significant results for genesOr65candOr67ain the
D. melanogaster/D. simulanscomparison, and for genesOr65b1and
Or67cin theD. pseudoobscura/D. mirandacomparison (Table 2). In all these cases, an excess of fixed nonsynonymous changes was detected. When correcting for multiple testing (using the stringent sequential Bonferroni correction; [23]), the tests remained significant for the same four genes. When applying the MK test to the pooled set of genes, highly significant results were obtained in both comparisons (D. melanogaster/D. simulansandD.
pseudoobs-cura/D. miranda), indicating a general trend toward an excess of fixed nonsynonymous changes. In all cases, the removal of singleton polymorphisms did not affect the results (results not shown), which together with the below-one values of the neutrality index [24] for all four genes (0.16 and 0.08 forOr65cand Or67a
and 0.15 and 0.06 forOr65b1andOr67c, respectively) suggests that these genes exhibited indeed a significant excess of nonsynon-ymous fixed mutations. Moreover, in theD. melanogaster compar-ison, the polarized MK test (using D. yakuba as the outgroup) revealed a significant excess of fixed nonsynonymous mutations at genesOr65cand Or67ain the D. melanogasterlineage (results not shown). Little is known about the specific functions of the encoded receptors in each species except that inD. melanogasterthe receptors encoded by genes of theOr65cluster seem to have pheromones as ligands [25] whereas genesOr67aandOr67care known to respond strongly to a broad range of food odours [26].
In bothD. melanogasterandD. pseudoobscura, two of the eightOr
genes studied exhibited the footprint of protein adaptive evolution. The estimated proportion (0.25 in both lineages) is based on a small number of genes and does not differ significantly from that estimated (0.1) in a genomewide study, which included a larger number ofOrgenes (20) that were partially sequenced in a sample including both African and cosmopolitan lines ofD. melanogaster
[27]. This relatively high proportion would seem consistent with diverse observations inD. melanogaster. Indeed, in this species the expression of some chemoreceptor genes is highly sexually dimorphic and frequently sexually antagonistic, and the extent of transcriptional responses to changing conditions is heteroge-neous among the chemoreceptor repertoire [28]. Moreover, some of the encoded proteins have indeed pheromones as ligands and they might either signal the presence of inappropriate mating partners or contribute to the identification of conspecific partners [29]. Other odorant receptors exhibit a strong response to food odours and might serve to signal food sources in the environment. The challenges imposed by changing environmental conditions, such as those often associated with speciation and species range expansions, might thus trigger the adaptive evolution of ORs and also promote adaptive regulatory changes in the chemoreceptor genes. However, the proportion of Or genes under positive selection detected in both our study and the genomewide study [27], as well as that ofGrgenes (2 out of 20) in the latter study, do
Figure 1. Multilocus HKA.Summary of a multilocus HKA test, which compares polymorphism withinD. melanogasterandD. pseudoobscurato divergence fromD. simulansandD. miranda, respectively. Solid bars represent contributions to the overallx2test statistic caused by polymorphism levels at each locus; open bars represent contributions caused by divergence. Positive values indicate an excess of polymorphism or divergence relative to neutral expectations. Likewise, negative values indicate a defect relative to expectation.
not differ significantly from the proportion of non-chemosensory genes (29 out of 379; [27]). A similar result was obtained when chemosensory (OrandGr) genes inD. simulans[6] were compared to a genomewide sample of non-chemosensory genes [30]. In Drosophila, adaptive protein evolution at the speciation timescale —as evidenced by the polymorphism to divergence comparison in
D. melanogaster,D. simulansandD. pseudoobscura— would thus seem as pervasive among ORs as among the rest of proteins.
Materials and Methods
Drosophila strains
Fourteen isochromosomal lines for the third chromosome of
Drosophila melanogasterobtained from a natural population of Sant Sadurnı´ d’Anoia (Spain; [31]), and 13 highly inbred lines ofD. pseudoobscura from a natural population of Davis (USA; kindly provided by C. Segarra) were used for the analysis of polymorphism. Highly inbred lines obtained by ten generations of sib-mating were also used for the analysis of divergence: one line each of D. simulans (Mozambique; [32]) and D. miranda (kindly provided by C. Segarra).
DNA extraction, amplification and sequencing
DNA was extracted from i) one single individual per inbred line (a male in the case ofD. pseudoobscuraandD. miranda); and ii) ten individuals per isochromosomal line, using either a modification of protocol 48 in Ashburner [33] or the PUREGENE DNA Purification kit (Gentra Systems, Inc.) for DNA extraction of a single fly.
Amplification and sequencing primers were designed based on the D. melanogaster and D. pseudoobscura genome sequences using program Oligo 4 (Molecular Biology Insights, Inc.). In general, amplification primers were designed to be conserved between species. Sequencing primers were species-specific and spaced on average 500 nucleotides. The purification step was a modification of the protocol described in Deanet al.[34]. Sequencing products were ethanol precipitated and later separated on automatic sequencers ABI 377 or ABI 3700 (ABI Applied Biosystems). All sequences were obtained on both strands. The sequences reported in this article are deposited in the EMBL sequence database library under accession numbers EU274289, EU128651 and FR669264 – FR669446.
Sequence Analysis
For newly generated sequences, consensus sequences were obtained using the SeqMan program of the DNASTAR Lasergene software package [35].Orgenes fromD. yakubawere downloaded from the Comparative Assembly Freeze 1 (CAF1), according to the GLEANR Annotation in the AAAWiki website (http://rana. lbl.gov/drosophila/; [36]). Sequences were aligned using the MegAlign program of the DNASTAR Lasergene software package [35] or the BioEdit program [37].
Figure 2. Summary statistics.Tajima’sDand normalized Fay and Wu’sHstatistics forD. melanogasterandD. pseudoobscura. doi:10.1371/journal.pone.0013389.g002
Table 2.McDonald and Kreitman tests.
Species Gene FS FNS PS PNS P-valuea
D. melanogaster Or63a 28 8 14 6 0.54
Or65a 24 22 17 8 0.22
Or65b 37 28 4 6 0.50
Or65c 28 30 34 6 ,0.001***
Or67a 47 67 17 2 ,0.001***
Or67b 52 9 2 1 0.40
Or67c 36 6 26 7 0.54
Or69a 44 47 23 14 0.18
TOTAL 296 217 137 50 ,0.001***
D. pseudoobscura Or63a 15 6 9 12 0.12
Or65b1 12 18 22 5 0.003**
Or65b4 7 7 14 17 1.00
Or65b5 24 16 21 11 0.81
Or67a 12 8 32 12 0.39
Or67b 8 5 4 1 0.61
Or67c 3 4 24 2 0.011**
Or69a 18 13 7 7 0.75
TOTAL 99 77 133 67 0.044*
FS, fixed synonymous substitutions; FNS, fixed nonsynonymous substitutions; PS, polymorphic synonymous substitutions; PNS, polymorphic nonsynonymous substitutions.
*P,0.05; **P,0.01; ***P,0.001.
aTwo-tailed Fisher’s exact test.
The MacClade program [38] was used to edit the DNA alignments for further analysis. Most analyses of polymorphism and divergence were performed using the DnaSP program [39]. The normalized Fay and Wu’sHstatistic [18] was calculated with a program kindly provided by S. E. Ramos-Onsins.
The level of DNA polymorphism was estimated as the per-site nucleotide diversity (p: [40]), and nucleotide divergence between
species as K, the number of per-site substitutions corrected according to Jukes and Cantor [41]. The minimum number of recombination events (Rm) was calculated according to Hudson and Kaplan [42]. TheZnSstatistic [43] was used to quantify the overall genetic association (linkage disequilibrium) between polymorphic sites.
Four tests were used in order to detect the footprint left by recent selective events on the level and pattern of polymorphism: the Hudson-Kreitman-Aguade´ test (HKA test: [44]), the Tajima’s
D[16] and the normalized Fay and Wu’sH[17,18] tests, and the maximum likelihood Kim and Stephan test [15]. The multilocus HKA test was conducted using program HKA (distributed by Jody Hey through http://lifesci.rutgers.edu/,heylab). Moreover, the
McDonald and Kreitman test (MK test; [45]), which compares the ratios of nonsynonymous to synonymous polymorphic and fixed changes was used to detect the footprint left by recurrent positive selection acting at the protein level after speciation.
Supporting Information
Table S1 Number of nucleotide positions.
Found at: doi:10.1371/journal.pone.0013389.s001 (0.01 MB PDF)
Table S2 Genetic association.
Found at: doi:10.1371/journal.pone.0013389.s002 (0.01 MB PDF)
Acknowledgments
We thank D. Orengo and C. Segarra for providing the isochromosomalD. melanogasterstrains and the highly inbred D. pseudoobscura and D. miranda
lines, respectively; S. E. Ramos-Onsins for sharing his unpublished program; and Servei de Geno`mica at Serveis Cientı´fico-Te`cnics from Universitat de Barcelona for automatic sequencing facilities.
Author Contributions
Conceived and designed the experiments: MA. Performed the experiments: ICC. Analyzed the data: ICC. Contributed reagents/materials/analysis tools: MA. Wrote the paper: ICC MA.
References
1. Krieger J, Breer H (1999) Olfactory reception in invertebrates. Science 286: 720–723.
2. Clyne PJ, Warr CG, Freeman MR, Lessing D, Kim J, et al. (1999) A novel family of divergent seven-transmembrane proteins: candidate odorant receptors in Drosophila. Neuron 22: 327–338.
3. Krieger J, Klink O, Mohl C, Raming K, Breer H (2003) A candidate olfactory receptor subtype highly conserved across different insect orders. J Comp Physiol A Neuroethol Sens Neural Behav Physiol 189: 519–526.
4. Jones WD, Nguyen TA, Kloss B, Lee KJ, Vosshall LB (2005) Functional conservation of an insect odorant receptor gene across 250 million years of evolution. Curr Biol 15: R119–121.
5. Zhou JJ, Vieira FG, He XL, Smadja C, Liu R, et al. (2010) Genome annotation and comparative analyses of the odorant-binding proteins and chemosensory proteins in the pea aphid Acyrthosiphon pisum. Insect Molecular Biology 19 Suppl 2: 113–122.
6. McBride CS, Arguello JR, O’Meara BC (2007) Five Drosophila genomes reveal nonneutral evolution and the signature of host specialization in the chemoreceptor superfamily. Genetics 177: 1395–1416.
7. Conceic¸a˜o IC, Aguade´ M (2008) High Incidence of Interchromosomal Transpositions in the Evolutionary History of a Subset of Or Genes in Drosophila. J Mol Evol.
8. Halligan DL, Eyre-Walker A, Andolfatto P, Keightley PD (2004) Patterns of Evolutionary Constraints in Intronic and Intergenic DNA of Drosophila. Genome Res 14: 273–279.
9. Haddrill PR, Charlesworth B, Halligan DL, Andolfatto P (2005) Patterns of intron sequence evolution in Drosophila are dependent upon length and GC content. Genome Biol 6: R67.
10. Kovacevic M, Schaeffer SW (2000) Molecular population genetics of X-linked genes in Drosophila pseudoobscura. Genetics 156: 155–172.
11. Machado CA, Kliman RM, Markert JA, Hey J (2002) Inferring the history of speciation from multilocus DNA sequence data: the case of Drosophila pseudoobscura and close relatives. Mol Biol Evol 19: 472–488.
12. Gallach M, Arnau V, Marin I (2007) Global patterns of sequence evolution in Drosophila. BMC Genomics 8: 408.
13. Dobzhansky TG (1970) Genetics of the evolutionary process. New York: Columbia University Press.. pp ix, 505 p. p.
14. Pascual M, Mestres F, Serra L (2004) Sex-ratio in natural and experimental populations of Drosophila subobscura from North America. Journal of Zoological Systematics & Evolutionary Research 42: 33–37.
15. Kim Y, Stephan W (2002) Detecting a local signature of genetic hitchhiking along a recombining chromosome. Genetics 160: 765–777.
16. Tajima F (1989) Statistical method for testing the neutral mutation hypothesis by DNA polymorphism. Genetics 123: 585–595.
17. Fay JC, Wu CI (2000) Hitchhiking under positive Darwinian selection. Genetics 155: 1405–1413.
18. Zeng K, Fu YX, Shi S, Wu CI (2006) Statistical tests for detecting positive selection by utilizing high-frequency variants. Genetics 174: 1431– 1439.
19. Glinka S, Ometto L, Mousset S, Stephan W, De Lorenzo D (2003) Demography and Natural Selection Have Shaped Genetic Variation in Drosophila melanogaster: A Multi-locus Approach. Genetics 165: 1269–1278.
20. Orengo DJ, Aguade´ M (2004) Detecting the footprint of positive selection in a european population of Drosophila melanogaster: multilocus pattern of variation and distance to coding regions. Genetics 167: 1759–1766.
21. Hutter S, Li H, Beisswanger S, De Lorenzo D, Stephan W (2007) Distinctly different sex ratios in African and European populations of Drosophila melanogaster inferred from chromosomewide single nucleotide polymorphism data. Genetics 177: 469–480.
22. Hamblin MT, Aquadro CF (1999) DNA sequence variation and the recombinational landscape inDrosophila pseudoobscura. A study of the second chromosome. Genetics 153: 859–869.
23. Holm S (1979) A simple sequential rejective multiple test procedure. Scandinavian Journal of Statistics 6: 65–70.
24. Rand DM, Kann LM (1996) Excess amino acid polymorphism in mitochondrial DNA: contrasts among genes from Drosophila, mice, and humans. Mol Biol Evol 13: 735–748.
25. Vosshall LB, Stocker RF (2007) Molecular architecture of smell and taste in Drosophila. Annu Rev Neurosci 30: 505–533.
26. Hallem EA, Carlson JR (2006) Coding of odors by a receptor repertoire. Cell 125: 143–160.
27. Shapiro JA, Huang W, Zhang C, Hubisz MJ, Lu J, et al. (2007) Adaptive genic evolution in the Drosophila genomes. Proc Natl Acad Sci U S A 104: 2271–2276.
28. Zhou S, Stone EA, Mackay TF, Anholt RR (2009) Plasticity of the chemoreceptor repertoire in Drosophila melanogaster. PLoS Genet 5: e1000681.
29. van der Goes van Naters W, Carlson JR (2007) Receptors and neurons for fly odors in Drosophila. Curr Biol 17: 606–612.
30. Begun DJ, Holloway AK, Stevens K, Hillier LW, Poh YP, et al. (2007) Population genomics: whole-genome analysis of polymorphism and divergence in Drosophila simulans. PLoS Biology 5: e310.
31. Orengo DJ, Aguade M (2004) Detecting the footprint of positive selection in a european population of Drosophila melanogaster: multilocus pattern of variation and distance to coding regions. Genetics 167: 1759–1766.
32. Rozas J, Gullaud M, Blandin G, Aguade´ M (2001) DNA variation at the rp49 gene region of Drosophila simulans: evolutionary inferences from an unusual haplotype structure. Genetics 158: 1147–1155.
33. Ashburner M (1989) Drosophila: A laboratory handbook. New York: Cold Spring Harbor Laboratory Press. 476 p.
34. Dean MD, Ballard KJ, Glass A, Ballard JWO (2003) Influence of Two Wolbachia Strains on Population Structure of East African Drosophila simulans. Genetics 165: 1959–1969.
35. Burland TG (2000) DNASTAR’s Lasergene sequence analysis software. Methods Mol Biol 132: 71–91.
37. Hall TA (1999) BioEdit: a user-friendly biological sequence alignment editor and analysis program for Windows 95/98/NT. Nucleic Acids Symposium Series 41: 95–98.
38. Maddison WP, Maddison DR (2000) MacClade 4: Analysis of Phylogeny and Character Evolution: Sinauer Associates, Inc.
39. Rozas J, Sa´nchez-DelBarrio JC, Messeguer X, Rozas R (2003) DnaSP, DNA polymorphism analyses by the coalescent and other methods. Bioinformatics 19: 2496–2497.
40. Nei M (1987) Molecular Evolutionary Genetics. New York: Columbia University Press.
41. Jukes TH, Cantor CR (1969) Evolution of protein molecules. In: Munro HN, ed. Mammalian Protein Metabolism. New York: Academic Press. pp 21–123. 42. Hudson RR, Kaplan NL (1985) Statistical properties of the number of
recombination events in the history of a sample of DNA sequences. Genetics 111: 147–164.
43. Kelly JK (1997) A test of neutrality based on interlocus associations. Genetics 146: 1197–1206.
44. Hudson RR, Kreitman M, Aguade´ M (1987) A test of neutral molecular evolution based on nucleotide data. Genetics 116: 153–159.