ACPD
10, 12133–12184, 2010Black carbon and sulphate aerosol in
the Arctic
D. Hirdman et al.
Title Page
Abstract Introduction
Conclusions References
Tables Figures
◭ ◮
◭ ◮
Back Close
Full Screen / Esc
Printer-friendly Version Interactive Discussion
Discussion
P
a
per
|
Dis
cussion
P
a
per
|
Discussion
P
a
per
|
Discussio
n
P
a
per
|
Atmos. Chem. Phys. Discuss., 10, 12133–12184, 2010 www.atmos-chem-phys-discuss.net/10/12133/2010/ doi:10.5194/acpd-10-12133-2010
© Author(s) 2010. CC Attribution 3.0 License.
Atmospheric Chemistry and Physics Discussions
This discussion paper is/has been under review for the journal Atmospheric Chemistry and Physics (ACP). Please refer to the corresponding final paper in ACP if available.
Long-term trends of black carbon and
sulphate aerosol in the Arctic: changes in
atmospheric transport and source region
emissions
D. Hirdman1, J. F. Burkhart1, H. Sodemann1, S. Eckhardt1, A. Jefferson2,3, P. K. Quinn4, S. Sharma5, J. Str ¨om6, and A. Stohl1
1
Norwegian Institute for Air Research (NILU), Norway
2
National Oceanic & Atmospheric Administration (NOAA) Earth System Research Laboratory (ESRL) Global Monitoring Division, United States of America, USA
3
Cooperative Institute for Research in Environmental Sciences, University of Colorado, United States of America, USA
4
ACPD
10, 12133–12184, 2010Black carbon and sulphate aerosol in
the Arctic
D. Hirdman et al.
Title Page
Abstract Introduction
Conclusions References
Tables Figures
◭ ◮
◭ ◮
Back Close
Full Screen / Esc
Printer-friendly Version Interactive Discussion
Discussion
P
a
per
|
Dis
cussion
P
a
per
|
Discussion
P
a
per
|
Discussio
n
P
a
per
|
5
Environment Canada, Science and Technology Branch, Climate Research Division, Canada
6
Norwegian Polar Institute, Tromsø, Norway
Received: 21 April 2010 – Accepted: 4 May 2010 – Published: 10 May 2010
Correspondence to: D. Hirdman (dhi@nilu.no)
ACPD
10, 12133–12184, 2010Black carbon and sulphate aerosol in
the Arctic
D. Hirdman et al.
Title Page
Abstract Introduction
Conclusions References
Tables Figures
◭ ◮
◭ ◮
Back Close
Full Screen / Esc
Printer-friendly Version Interactive Discussion
Discussion
P
a
per
|
Dis
cussion
P
a
per
|
Discussion
P
a
per
|
Discussio
n
P
a
per
|
Abstract
As a part of the IPY project POLARCAT (Polar Study using Aircraft, Remote Sensing, Surface Measurements and Models, of Climate, Chemistry, Aerosols and Transport) and building on previous work (Hirdman et al., 2010), this paper studies the long-term trends of both atmospheric transport as well as equivalent black carbon (EBC) and sul-5
phate for the three Arctic stations Alert, Barrow and Zeppelin. We find a general down-ward trend in the measured EBC concentrations at all three stations, with a decrease of−2.1±0.4 ng m−3yr−1 (for the years 1989–2008) and −1.4±0.8 ng m−3yr−1 (2002– 2009) at Alert and Zeppelin respectively. The decrease at Barrow is, however, not sta-tistically significant. The measured sulphate concentrations show a decreasing trend 10
at Alert and Zeppelin of −15±3 ng m−3yr−1 (1985–2006) and −1.3±1.2 ng m−3yr−1 (1990–2008) respectively, while the trend at Barrow is unclear.
To reveal the influence of different source regions on these trends, we used a clus-ter analysis of the output of the Lagrangian particle dispersion model FLEXPART run backward in time from the measurement stations. We have investigated to what extent 15
variations in the atmospheric circulation, expressed as variations in the frequencies of the transport from four source regions with different emission rates, can explain the long-term trends in EBC and sulphate measured at these stations. We find that the long-term trend in the atmospheric circulation can only explain a minor fraction of the overall downward trend seen in the measurements of EBC (0.3–7.2%) and sulphate 20
(0.3–5.3%) at the Arctic stations. The changes in emissions are dominant in explaining the trends. We find that the highest EBC and sulphate concentrations are associated with transport from Northern Eurasia and decreasing emissions in this region drive the downward trends. Northern Eurasia (cluster: NE, WNE and ENE) is the dominant emission source at all Arctic stations for both EBC and sulphate during most seasons. 25
ACPD
10, 12133–12184, 2010Black carbon and sulphate aerosol in
the Arctic
D. Hirdman et al.
Title Page
Abstract Introduction
Conclusions References
Tables Figures
◭ ◮
◭ ◮
Back Close
Full Screen / Esc
Printer-friendly Version Interactive Discussion
Discussion
P
a
per
|
Dis
cussion
P
a
per
|
Discussion
P
a
per
|
Discussio
n
P
a
per
|
1 Introduction
Short-lived pollutants have recently received much attention as climate forcers, particu-larly in the Arctic (Quinn et al., 2008). Black carbon (BC) has gained the greatest inter-est due to its strong effects on the radiative balance in the Arctic, both as an Arctic haze aerosol absorbing short-wave radiation in the atmosphere (Polissar et al., 1999) as well 5
as by decreasing the albedo if deposited on ice or snow (Hansen and Nazarenko, 2004; Flanner and Zender, 2006; Flanner et al., 2007). Like other aerosols, BC may also in-fluence the microphysical properties of clouds (Garrett et al., 2002; Br ´eon et al., 2002). To fully understand past and present effects of BC on the Arctic climate, it is necessary to know the long-term changes of BC concentrations. Furthermore, it is important to 10
know where the source regions of BC are located and how their contributions to BC in the Arctic have changed over time. A recent ice-core study by McConnell et al. (2007) presented a historical BC record, which showed that BC concentrations over the ice cap of Greenland peaked around 1910 and thereafter decreased steadily. Continuous measurements of aerosol light absorption (which can be converted to equivalent BC 15
(EBC) concentrations) at Alert and Barrow started in the late 1980s. These records are now long enough for meaningful trend analysis. Previous studies using these data sets have shown – in agreement with the ice-core study of McConnell et al. (2007) – a general decrease of EBC since the start of the measurements (Sharma et al., 2004, 2006; Quinn et al., 2007). However, small increases of EBC were reported for both sta-20
tions for the last years of each study (Sharma et al., 2006; Quinn et al., 2007). The two parallel EBC measurement time series available from Zeppelin are both still relatively short but for one a decreasing trend over the last decade was reported (Eleftheriadis et al., 2009).
The major BC source region for the Arctic surface stations has repeatedly been iden-25
ACPD
10, 12133–12184, 2010Black carbon and sulphate aerosol in
the Arctic
D. Hirdman et al.
Title Page
Abstract Introduction
Conclusions References
Tables Figures
◭ ◮
◭ ◮
Back Close
Full Screen / Esc
Printer-friendly Version Interactive Discussion
Discussion
P
a
per
|
Dis
cussion
P
a
per
|
Discussion
P
a
per
|
Discussio
n
P
a
per
|
studies show that agricultural as well as boreal forest fires in central and western Eura-sia may in fact, for periods of time, dominate the aerosol concentrations in large parts of the Arctic troposphere in spring (Stohl et al., 2007; Treffeisen et al., 2007; Engvall et al., 2009; Warneke et al., 2009, 2010). The BC source locations in summer are still debated. Neither Polissar et al. (2001) nor Sharma et al. (2006) found any specific 5
source regions for Alert in summer while the later study identified Western China and the Pacific to be associated with enhanced EBC concentrations at Barrow. Iziomon et al. (2006) on the other hand pointed out that Barrow in summer was influenced by emissions from anthropogenic sources as well as from forest fires originating in the central and eastern parts of Russia. The studies of EBC measured at Zeppelin agree 10
in that the continental influence on the station is limited during summertime but the re-sults are inconclusive with regard to specific source regions (Eleftheriadis et al., 2009; Hirdman et al., 2010). Eleftheriadis et al. (2009) pointed out the countries around the Baltic Sea as potential source regions together with Scotland/Ireland and regions in Russia (North-West corner and Norilsk). Other studies have emphasized the impor-15
tance of emissions from yearly reoccurring boreal forest fires at high latitudes to the EBC concentrations not only at Zeppelin but for the whole Arctic troposphere in sum-mer (Stohl, 2006; Stohl et al., 2006; Hirdman et al., 2010). Model results indicate that source regions for BC in the middle and upper troposphere are markedly different, with a stronger influence from source regions further south (Koch and Hansen, 2005; Stohl, 20
2006; Hirdman et al., 2010).
Several studies have attempted to estimate to what extent the observed trends in the Arctic EBC concentrations can be attributed to changes in atmospheric transport com-pared to the emission changes in the source regions. A study by Sharma et al. (2004) concluded that the trends in EBC seen at Alert are mainly due to changed emissions in 25
ACPD
10, 12133–12184, 2010Black carbon and sulphate aerosol in
the Arctic
D. Hirdman et al.
Title Page
Abstract Introduction
Conclusions References
Tables Figures
◭ ◮
◭ ◮
Back Close
Full Screen / Esc
Printer-friendly Version Interactive Discussion
Discussion
P
a
per
|
Dis
cussion
P
a
per
|
Discussion
P
a
per
|
Discussio
n
P
a
per
|
correlated to the anthropogenic emissions of Northern Eurasia and North America and consistent with their documented reductions.
Most aerosols predominantly scatter, not absorb light (Charlson et al., 1992). Even though trends of aerosol light scattering will not be studied here specifically, it is still of interest to know how its trend correlates to the EBC trends. Measurements of the 5
aerosol light scattering coefficient at Barrow have been made since May of 1976. Bod-haine and Dutton (1993) reported that the spring-time values were stable for the first three years, and then experienced two years of lower values before they reached a maximum in 1982 and decreased strongly thereafter until 1992. From 1997 until 2006, the data show a significant increase in March but no trend at all later in spring (Quinn et 10
al., 2007). Thus, both EBC and aerosol light scattering show a strong decrease during the 1980s and until the late 1990s’ but a slight increase or no trend since then. One important light scattering component of the Arctic aerosol is sulphate, for which in situ measurements are available as far back as the late 1970s. Sirois and Barrie (1999) and Sharma et al. (2004) reported that there was no trend in the measured sulphate 15
concentrations at Alert between 1980 and 1991, but they observed a significant de-crease of up to 56% thereafter which was speculated to reflect the reduced emissions from Russia. This negative trend was confirmed at several stations around the Arctic (Quinn et al., 2007), and Quinn et al. (2009) reported a 60% decrease over the past three decades.
20
In a previous paper we investigated the current sources and sinks of several short-lived species for four Arctic stations (Hirdman et al., 2010). For our statistical analysis, we combined the measurement data with transport model calculations. We took ad-vantage of the superior performance of the model calculations of a Lagrangian particle dispersion model (LPDM) compared with trajectory calculations which ignore atmo-25
spheric turbulence and convection (Stohl et al., 2002; Han et al., 2005). Here we extend the work of Hirdman et al. (2010) by applying the LPDM for the entire time period for which Arctic measurements of EBC and sulphate are available.
ACPD
10, 12133–12184, 2010Black carbon and sulphate aerosol in
the Arctic
D. Hirdman et al.
Title Page
Abstract Introduction
Conclusions References
Tables Figures
◭ ◮
◭ ◮
Back Close
Full Screen / Esc
Printer-friendly Version Interactive Discussion
Discussion
P
a
per
|
Dis
cussion
P
a
per
|
Discussion
P
a
per
|
Discussio
n
P
a
per
|
Arctic observatories Alert (Canada), Barrow (Alaska), and Zeppelin (Svalbard, Nor-way) and assess the relative importance of changing transport patterns and changing source region emissions on measured concentrations of EBC and sulphate. The paper is structured as follows: In Sect. 2, the methods used are described. Subsequently, in Sect. 3.1, the climatologies of atmospheric transport towards the three Arctic observa-5
tories are presented. In Sect. 3.2, the potential source regions of the clustered trans-port are identified and thereafter characterized for trends. In the following Sects. 3.3 and 3.4, the EBC and sulphate mean concentrations are investigated in association to the different clusters. Section 3.5 separates the influence of changing transport pat-terns from the changes in clustered source region emissions and quantifies the contri-10
bution of each on the overall trend. Thereafter follows a discussion of the implications of the results. Conclusions will be drawn in Sect. 4.
2 Methods
2.1 Measurements
2.1.1 Sites
15
The measurement data used in this study have been collected at three different sites: Alert, Canada (62.3◦W, 82.5◦N, 210 m a.s.l.), Barrow, Alaska (156,6◦W, 71,3◦N, 11 m a.s.l.) and Zeppelin on Svalbard, Norway (11.9◦E, 78.9◦N, 478 m a.s.l.). The Alert station is located on the north-eastern tip of Ellesmere Island (Hopper et al., 1994; Helmig et al., 2007a). The surroundings, both land and ocean, are mainly ice or snow 20
ACPD
10, 12133–12184, 2010Black carbon and sulphate aerosol in
the Arctic
D. Hirdman et al.
Title Page
Abstract Introduction
Conclusions References
Tables Figures
◭ ◮
◭ ◮
Back Close
Full Screen / Esc
Printer-friendly Version Interactive Discussion
Discussion
P
a
per
|
Dis
cussion
P
a
per
|
Discussion
P
a
per
|
Discussio
n
P
a
per
|
˚
Alesund located at the coast is minimal, due to the usually stable stratification of the at-mosphere and the location of the station 400 m above the community. Air masses can arrive either from the ice-free North Atlantic Ocean or from the generally ice-covered Arctic Ocean.
2.1.2 Data
5
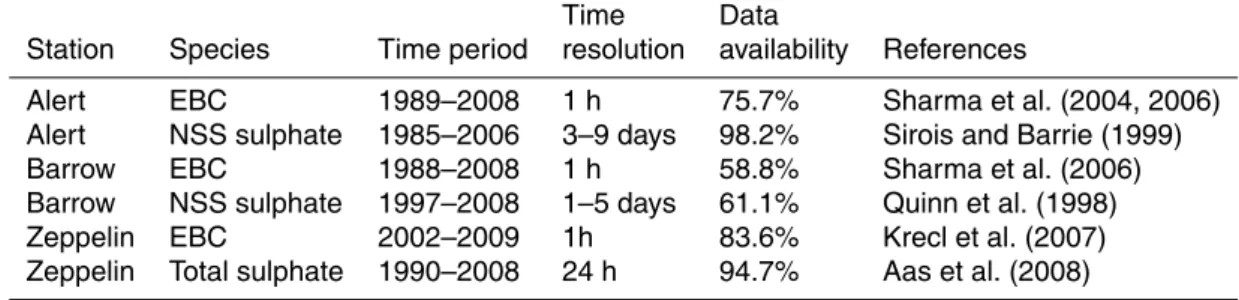
Table 1 summarizes the measurement data used here. The EBC data derived from aerosol light absorption measurements from all three stations have a time resolution of 1 h. Data were averaged to match the model time resolution of 3 h (see Sect. 2.2). For the daily sulphate measurements from Zeppelin, the 3-hourly model results were averaged to daily values. The sample duration of sulphate measurements at Alert and 10
Barrow varied and was, therefore put on a common daily mean basis together with the model data.
Aerosol light absorption measurements with aethalometers have been made at Bar-row since 1988 and at Alert since 1989. In October 1997, as a part of the standard NOAA/ESRL/GMD aerosol optical measurements system design (Delene and Ogren, 15
2002), the aerosol instrumentation at Barrow was upgraded and since then a particle soot absorption photometer (PSAP) has been used to measure the light absorption. At Zeppelin, measurements have been performed since 2002 using a custom built PSAP that is based on the same measurement principle. The BC study by Eleftheriadis et al. (2009) used data from an aethalometer running in parallel with the PSAP. The re-20
sponses of both aethalometers and PSAPs depend on the loading of particles on the filter and on the amount of light that the particles scatter (Bond et al., 1999; Wein-gartner et al., 2003; Arnott et al., 2005). No corrections for this have been made for the aethalometer measurements, neither at Alert nor at Barrow. However, the PSAP data taken at Barrow and Zeppelin were corrected for these dependencies according 25
ab-ACPD
10, 12133–12184, 2010Black carbon and sulphate aerosol in
the Arctic
D. Hirdman et al.
Title Page
Abstract Introduction
Conclusions References
Tables Figures
◭ ◮
◭ ◮
Back Close
Full Screen / Esc
Printer-friendly Version Interactive Discussion
Discussion
P
a
per
|
Dis
cussion
P
a
per
|
Discussion
P
a
per
|
Discussio
n
P
a
per
|
sorption coefficient σap. Conversion between σap and BC is not straightforward and requires the assumption that all the light absorption measured is from BC. It is also assumed that all BC has the same light absorption efficiency. The PSAP data will therefore be reported as EBC, whereσap values have been converted approximately to BC mass concentration using a value of 10 m2g−1, typical of aged BC aerosol (Bond 5
and Bergstrom, 2006). The conversion to BC in the aethalometers is done internally but relies on the same assumptions. Therefore, we will also refer to the aethalometer data as EBC. At Alert, the EBC data were further corrected based on a comparison with elemental carbon measurements based on a thermal method (Sharma et al., 2004).
An inter-comparison between the aethalometer and PSAP measurements at Barrow 10
was made for a period of overlapping measurements during 1998. The results indi-cated that the calculated mean and median values of the aethalometer measurements were, 19.9% and 19.5%, respectively, higher than the PSAP measurements (e.g. see Fig. 16). Unfortunately, the differences in the datasets are not systematic. Thus, it may be misleading to join the two time series and we will report trends separately for the 15
aethalometer and PSAP measurements at Barrow.
To avoid local contamination by emissions from the town of Barrow, EBC values at Barrow were only used when the wind direction fell within the “clean-air sector” from 0–130◦ (Bodhaine, 1995). This screening likely also affects how representative these data are when analyzing potential source regions such as the influence from the North 20
American continent on this part of the Arctic as discussed more thoroughly in Hirdman et al. (2010).
Measurements of sulphate and other inorganic ions at Alert, Barrow and Zeppelin were analyzed using ion chromatographic analyses on filter samples taken at daily or longer intervals (Table 1). The stations sample different particle size ranges. At Zep-25
influ-ACPD
10, 12133–12184, 2010Black carbon and sulphate aerosol in
the Arctic
D. Hirdman et al.
Title Page
Abstract Introduction
Conclusions References
Tables Figures
◭ ◮
◭ ◮
Back Close
Full Screen / Esc
Printer-friendly Version Interactive Discussion
Discussion
P
a
per
|
Dis
cussion
P
a
per
|
Discussion
P
a
per
|
Discussio
n
P
a
per
|
ence from sea-salt by using measurements of sodium on the same filters and a ratio of sulphate to sodium in seawater. At Zeppelin, the sodium content in the filters has only been measured since 1999. In order to use all the data since 1990, the sulphate measurements at Zeppelin were not corrected for the influence of sea-salt sulphate. Due to the high altitude location of the Zeppelin station, the sea salt contribution is only 5
16–22 ng/m3or 9–18% of the measured annual mean concentrations since 1999. For interpretation of our results, we also used various indices for atmospheric circula-tion patterns. Daily North Atlantic Oscillacircula-tion (NAO) index data used were provided by the Climate Analysis Section, NCAR, Boulder, USA (Hurrell, 1995). The seasonal val-ues of the atmospheric circulation indices NAO, Pacific-North American pattern (PNA) 10
and Arctic Oscillation (here abbreviated as AOI in order not to confuse it with a later defined transport cluster), used in this study were derived from monthly values pro-vided by the Climate Prediction Center (CPC) at the National Weather Service (NWS), USA. The monthly NAO and PNA index values were derived using principal component analysis (Barnston and Livezey, 1987), while the AOI index was derived using empirical 15
orthogonal functions (EOF) (Higgins et al., 2000).
2.2 Model calculations
In our trend analyses we make use of the FLEXPART LPDM (Stohl et al., 1998, 2005; Forster et al., 2007). FLEXPART calculates the trajectories of so-called tracer parti-cles using the mean winds interpolated from the analysis fields plus parameterizations 20
representing turbulence and convective transport. These processes, which are not included in standard trajectory models, are important for a realistic simulation of the transport of trace substances (Stohl et al., 2002). As shown in Han et al. (2005) and discussed in Hirdman et al. (2010), this leads to more accurate results even though the calculations become more computationally demanding and the statistical analysis 25
of the model results more challenging.
ACPD
10, 12133–12184, 2010Black carbon and sulphate aerosol in
the Arctic
D. Hirdman et al.
Title Page
Abstract Introduction
Conclusions References
Tables Figures
◭ ◮
◭ ◮
Back Close
Full Screen / Esc
Printer-friendly Version Interactive Discussion
Discussion
P
a
per
|
Dis
cussion
P
a
per
|
Discussion
P
a
per
|
Discussio
n
P
a
per
|
for the period 2002–2008. For earlier years, the ERA-40 re-analysis data (Uppala et al., 2005) were used also with 1◦×1◦ resolution. Analyses at 00:00, 06:00, 12:00 and 18:00 UTC and 3-h forecasts at 03:00, 09:00, 15:00 and 21:00 UTC were used. During every 3-h interval, 40 000 particles were released at the measurement point and followed backward for 20 days. The reported global mean atmospheric lifetimes of 5
BC range widely in different studies, from 3–4 days (Liu et al., 2005) to 4–8 days (Park et al., 2005). In the Arctic, the lifetimes may be as long as several weeks to a month during winter (Sharma et al., 2006). The 20 days of our transport simulations should therefore be long enough to capture transport from the most relevant source regions.
In backward mode, FLEXPART calculates an emission sensitivity functionS, called 10
source-receptor-relationship by Seibert and Frank (2004). The S value (in units of s m−3) in a particular grid cell is proportional to the particle residence time in that cell and measures the simulated concentration at the receptor that a source of unit strength (1 kg s−1) in the cell would produce for an inert tracer which is not affected by chemical or other removal processes. The distribution ofS close to the surface is of particular 15
interest, as most emissions occur near the ground. Thus, S values are calculated for a so-called footprint layer 0–100 m above ground. S can be folded with emission distributions of any species to calculate receptor concentrations of that species ignoring loss processes. However, here concentrations are not calculated but insteadS is used directly for our statistical analyses.
20
2.3 Statistical methods
We used a cluster analysis (see, e.g., Kalkstein et al., 1987) to semi-objectively classify the emission sensitivities from FLEXPART into distinctly different groups. The classi-fications, done separately for the three stations, allow studying how the frequency of the different clusters has changed over time and, thus, how atmospheric transport to 25
trans-ACPD
10, 12133–12184, 2010Black carbon and sulphate aerosol in
the Arctic
D. Hirdman et al.
Title Page
Abstract Introduction
Conclusions References
Tables Figures
◭ ◮
◭ ◮
Back Close
Full Screen / Esc
Printer-friendly Version Interactive Discussion
Discussion
P
a
per
|
Dis
cussion
P
a
per
|
Discussion
P
a
per
|
Discussio
n
P
a
per
|
port cluster. This allows separating the effects of changes in atmospheric transport to the Arctic from effects of emission changes in a few important source regions, on the Arctic EBC and sulphate concentrations.
In principle, the gridded FLEXPART footprint emission sensitivities S(i ,j,n) could have been clustered directly. Here,i andj are the indices of the latitude/longitude grid 5
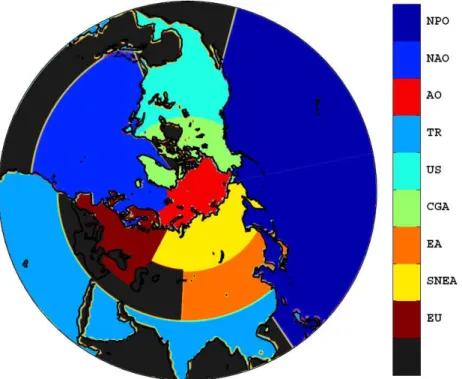
andnruns over the total number of casesN. However, due to the large number of grid cells, this is not feasible. Instead, following the approach used by Paris et al. (2009), we divided the Earth into 9 different geographical regions (Fig. 1). We then sumS(i ,j,n) within each of these 9 regions and use these 9 values, subsequently called ST(l ,n) for the clustering. Here,l runs over the 9 geographical regions and replaces the grid 10
indicesi and j. To avoid that relatively small changes in transport over regions close to the station have a too large influence on the clustering result,ST was standardized (Eq. 1):
SST(l ,n)=ST(l ,n)−ST(l)
σ(l) (1)
where ST(l) and σ(l) are the mean value and standard deviation of ST within each 15
region.
SST, was then used to identifyMdifferent transport clusters. The clustering was done using a two-phase iterative algorithm that minimizes the point-to-centroid distances summed over allM clusters, where each of the values inSST was treated as a point in parameter space. In the first phase, theSST values are simultaneously reassigned 20
to their nearest cluster centroid until convergence of cluster membership is achieved. The result from the first phase serves as an approximate solution and starting point for the second phase. In the second phase, eachSST value is individually reassigned if this reduces the sum of distances. After each reassignment the cluster centroids are recalculated in order to find a local and hopefully a global minimum of the sum of all 25
point-to-centroid distances (Seber, 1984; Spath, 1985).
ACPD
10, 12133–12184, 2010Black carbon and sulphate aerosol in
the Arctic
D. Hirdman et al.
Title Page
Abstract Introduction
Conclusions References
Tables Figures
◭ ◮
◭ ◮
Back Close
Full Screen / Esc
Printer-friendly Version Interactive Discussion
Discussion
P
a
per
|
Dis
cussion
P
a
per
|
Discussion
P
a
per
|
Discussio
n
P
a
per
|
et al., 1987). Here, it is a compromise between a desired large number of clusters to clearly separate differences in major transport patterns and the necessity to have a large enough number of cases in each cluster, so that seasonal averages over these cases are suitable for trend analyses. We successively varied the number of clusters (M=2,..., 8). Using visual analysis and applying the silhouette technique (Kaufman and 5
Rousseeuw, 1990) we chose to useM=4 clusters for all three stations. Since the first centroids are chosen in a random way, the clustering was repeated several times and the most persistent patterns were selected for further analysis.
For displaying our results, we first calculate the mean footprint sensitivitySMF:
SMF(i ,j)= 1 N
N X
n=1
S(i ,j,n) (2)
10
SMF indicates where, on a climatological basis, surface sources can potentially influ-ence the measurements during the last 20 days of transport. Similarly, we calculate the mean footprint emission sensitivity for each individual clusterm:
SCM(i ,j,m)= 1 Nm
Nm X
n=1
S(i ,j,m) (3)
Here n runs over all Nm cases in cluster m. Finally, for displaying our results, we 15
normalizeSCMwithSMF:
SCF(i ,j,m)= 1 M
SCM(i ,j,m)
SMF(i ,j) (4)
to show, for every cluster, the cluster-mean footprint emission sensitivity relative to the total mean footprint sensitivity. Since we choseM=4 clusters, SCF(i ,j,m)>0.25 indi-cates an above-average footprint sensitivity for clustermin grid cell (i ,j). For instance, 20
ACPD
10, 12133–12184, 2010Black carbon and sulphate aerosol in
the Arctic
D. Hirdman et al.
Title Page
Abstract Introduction
Conclusions References
Tables Figures
◭ ◮
◭ ◮
Back Close
Full Screen / Esc
Printer-friendly Version Interactive Discussion
Discussion
P
a
per
|
Dis
cussion
P
a
per
|
Discussion
P
a
per
|
Discussio
n
P
a
per
|
where the grouping is done based on measurement data (Ashbaugh, 1983; Ashbaugh et al., 1985; Hirdman et al., 2009, 2010).
A linear regression approach was applied in order to analyze the overall trends in a) cluster frequencies showing changes in atmospheric transport to the stations, and b) the measured concentrations of the different species at each station. The linear 5
regression used here is part of a statistical toolbox which makes use of a least-squares approach to find a solution to the system, where the norm of the residual vector is minimized (Chatterjee and Hadi, 1986). The confidence intervals are computed using a QR (orthogonal, triangular) decomposition of the predictor variable (Goodall, 1993). In trend figures, trends statistically significantly (at the 90% level) different from zero 10
are plotted with a solid line, insignificant lines with a dashed line.
3 Results
3.1 Transport climatologies
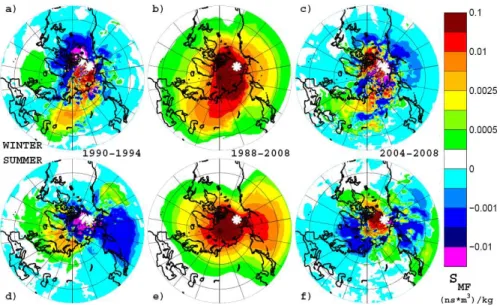
As explained by Hirdman et al. (2010), plots ofSMF (Eq. 2) can be interpreted as flow-climatologies where high values indicate frequent transport reaching the station from 15
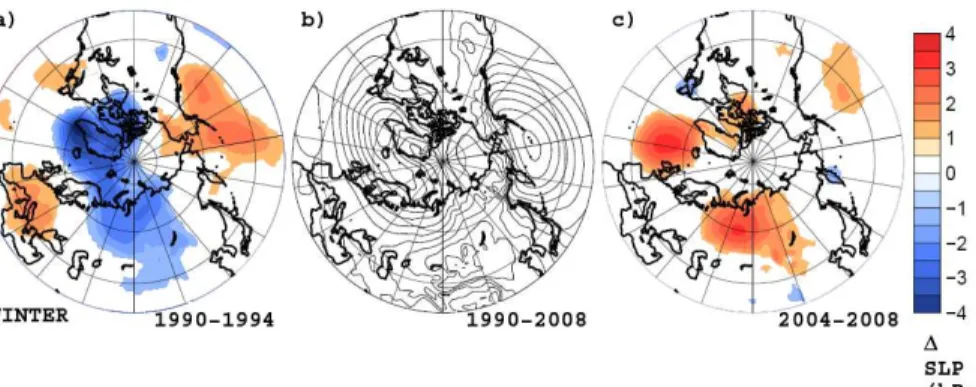
that region. To highlight overall trends in transport, we initially focus on the years 1990– 1994 when most of the measurements discussed in this paper were started, and on the last five years (2004–2008) for which measurements data were available for most data sets. We show difference plots ofSMFfor these periods to the mean for the period 1985–2009 (Figs. 2–4).
20
Alert: for Alert, during winter (DJF), transport from western Russia was enhanced in the earlier period (1990–1994) (Fig. 2a), while transport from the north-eastern parts of Russia, Greenland and Quebec and the neighbouring parts of the Arctic Ocean was more pronounced during the period 2004–2008 (Fig. 2c). In summer (JJA), the influence from Northern Eurasia and the North Pacific Ocean was more pronounced 25
north-ACPD
10, 12133–12184, 2010Black carbon and sulphate aerosol in
the Arctic
D. Hirdman et al.
Title Page
Abstract Introduction
Conclusions References
Tables Figures
◭ ◮
◭ ◮
Back Close
Full Screen / Esc
Printer-friendly Version Interactive Discussion
Discussion
P
a
per
|
Dis
cussion
P
a
per
|
Discussion
P
a
per
|
Discussio
n
P
a
per
|
western North Atlantic Ocean and Greenland was strong during the last five years (Fig. 2f).
Barrow: in the winters of 1990–1994, Barrow saw more atmospheric transport from Kazakhstan, eastern Russia and the East Siberian Sea (Fig. 3a), whereas during the winters of 2004–2008, the station was more influenced by transport from north-western 5
Eurasia, Greenland and the Canadian Arctic (Fig. 3c). In summer, the first period was characterized by enhanced transport from the remote parts of the Arctic Ocean, the North Atlantic Ocean and their coastal regions (Fig. 3d), whereas the later period was more influenced by local transport from the Beaufort Sea (Fig. 3f).
Zeppelin: for Zeppelin, in the winters of 1990–1994, transport from Russia was more 10
frequent (Fig. 4a), while transport from Europe, Greenland and eastern Canada was more frequent during the winters of 2004–2008 (Fig. 4c). In summer, the first period was characterized by enhanced influence from North-Central Eurasia and more remote influences from North Atlantic Ocean and North Pacific Ocean (Fig. 4d), whereas the later period was more influenced by transport from within the Arctic Ocean, Greenland 15
and North-Eastern Canada (Fig. 4f).
These differences are associated with the overall difference in the mean circula-tion. The early period was characterized by a stronger Icelandic low, with influence extending well across the Eurasian Arctic, and a weaker Siberian high (Fig. 5). The Pacific storm track was also weaker than on average. In the later period, the North 20
Atlantic storm track was somewhat weaker than normal, and the Siberian high more pronounced. This change in the mean circulation may also be identified with the NAO index (Hurrell and Deser, 2010), which was more strongly positive during the winters of 1990–1994 (average PC-based NAO index of 1.28) than during the winters of 2004– 2008 (average of 0.51). A pronounced shift from higher to lower NAO index values 25
en-ACPD
10, 12133–12184, 2010Black carbon and sulphate aerosol in
the Arctic
D. Hirdman et al.
Title Page
Abstract Introduction
Conclusions References
Tables Figures
◭ ◮
◭ ◮
Back Close
Full Screen / Esc
Printer-friendly Version Interactive Discussion
Discussion
P
a
per
|
Dis
cussion
P
a
per
|
Discussion
P
a
per
|
Discussio
n
P
a
per
|
hanced for high phases of the NAO. Burkhart et al. (2006) have also shown positive correlation between NAO and nitrate concentrations in Greenland ice cores. These findings are in agreement with our result of more frequent transport from lower-latitude continental regions during the first five years of the measurements than during the last five years, for all three stations.
5
The influence of transport from the North Atlantic Ocean on the Arctic weakens with distance but even for Barrow, its influence exceeds that of transport from the North Pacific Ocean (Dickson et al., 2000). This explains the strong correlation of transport with NAO even for Barrow. The fact that similar differences in the atmospheric flow patterns exist for the summers (Figs. 2–4d and 2–4f) corroborates well with the picture 10
that the NAO influence is significant also during summer (Folland et al., 2009). The use of ERA-40 reanalysis data up until 2001 and operational analyses data thereafter does not seem to have caused any discontinuities in simulated transport.
3.2 Cluster analysis results: seasonalities of transport
For each of the three stations one set of four unique clusters was identified by the 15
cluster analysis spanning the entire time period of available measurements (1985– 2009). The clusters represent unique transport pathways (see Sect. 2.3). The four unique clusters identified for Barrow and Alert have similar characteristics, therefore we give them the same names for the purposes of discussion. For Zeppelin, only two of the four clusters are similar to clusters found for the other stations; the other two 20
represent unique transport pathways to Zeppelin. Below we describe the six clusters relevant to the three stations.
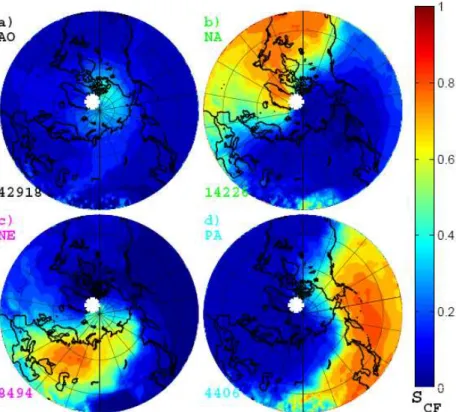
The 1st cluster is common for all three stations and features enhancedSCF values over the Arctic Ocean (and the oceans beyond for Barrow and Zeppelin). It will there-fore be referred to as the Arctic Ocean (AO) cluster (panels a in Figs. 7–9). The 2nd 25
ACPD
10, 12133–12184, 2010Black carbon and sulphate aerosol in
the Arctic
D. Hirdman et al.
Title Page
Abstract Introduction
Conclusions References
Tables Figures
◭ ◮
◭ ◮
Back Close
Full Screen / Esc
Printer-friendly Version Interactive Discussion
Discussion
P
a
per
|
Dis
cussion
P
a
per
|
Discussion
P
a
per
|
Discussio
n
P
a
per
|
3rd cluster, influencing Alert and Barrow (panels’ c in Figs. 7 and 8), shows highSCF values over Northern Eurasia and especially over its western parts. We subsequently refer to this cluster as the Northern Eurasia (NE) cluster. The 4th and 5th clusters are unique to Zeppelin and essentially form a separation of the NE cluster into a western and eastern part. The 4th cluster shows highSCF values mainly over western Eurasia 5
(Fig. 9c) and will therefore be referred to as WNE, while the 5th cluster shows high SCFvalues over eastern Eurasia and will consequently be referred to as ENE (Fig. 9d). Finally, the 6th cluster (Figs. 7d and 8d), only relevant for Alert and Barrow, shows high SCFvalues over the North Pacific Ocean and South-East Asia and will thus be referred to as the Pacific-Asian (PA) cluster.
10
Alert:at the Alert station, on an annually averaged basis, AO is the dominant cluster, accounting for over 61% of all cases (Fig. 10). Its frequency is similar from spring to autumn with a maximum of 70% in autumn. In winter, its frequency is only 45%. The reduction in AO frequency during winter is compensated by an increased frequency of the NE cluster which has the largest seasonal variation; 33% in winter, but less than 1% 15
in summer. This is consistent with the fact that atmospheric transport from continental source regions into the Arctic is stronger in winter than in summer (Stohl, 2006). The frequencies of the NA and the PA clusters vary less with season, accounting for 19– 24% and 5–8% of all cases, respectively.
Barrow: at Barrow, the AO cluster is also most frequent (62% of all cases), with a 20
maximum frequency in late summer and early autumn (over 80%) and a minimum in winter (39%) (Fig. 10). As for Alert, the NE cluster has the strongest seasonal cycle at Barrow with a maximum frequency of over 34% during the winter and a minimum of less than 1% in summer. Also consistent with Alert, the frequencies of the NA and PA clusters are fairly constant throughout the year (13–18% and 8–13%) except for 25
summer when the NA frequency decreases significantly (to less than 2%) while the PA frequency peaks at 22%.
ACPD
10, 12133–12184, 2010Black carbon and sulphate aerosol in
the Arctic
D. Hirdman et al.
Title Page
Abstract Introduction
Conclusions References
Tables Figures
◭ ◮
◭ ◮
Back Close
Full Screen / Esc
Printer-friendly Version Interactive Discussion
Discussion
P
a
per
|
Dis
cussion
P
a
per
|
Discussion
P
a
per
|
Discussio
n
P
a
per
|
for 52% of all cases, with a frequency maximum in spring of 57% and a wintertime minimum of 38%. NA accounts for 25% of all cases and is most frequent in summer (40%) and least frequent in winter (17%). The frequencies of the two Eurasian clusters, WNE and ENE, both peak in winter (18% and 28% respectively) and have a minimum during summertime (6% and 1%).
5
3.3 Cluster analysis results: trends of transport
Trends were calculated over the periods for which measurement data were available for the different stations. These periods are slightly different for the three stations.
Alert: the cluster frequencies at Alert show large interannual variability but also strong long-term trends for two of the four clusters. The AO cluster’s frequency 10
was 60–70% at the beginning of the time period but it decreased by about 11% (or
−0.5±0.2% yr−1) during the 24 year period (Fig. 11a). The frequency of the NA clus-ter, on the other hand, shows a similar but opposite trend increasing by 12% (or +0.5±0.3% yr−1) over the same time period.
Barrow: the cluster frequencies at Barrow also experience large interannual variabil-15
ity, but their trends are not as clear as for Alert and the rates of change are smaller (Fig. 11b). The NA influence has increased by 6.2% (±4.0%), while the NE influence decreased by 5.2% (±4.4%). The changes for AO and PA are not statistically signifi-cant.
Zeppelin: at Zeppelin none of the four clusters has a statistically significant trend in 20
frequency because of large interannual variations and the shorter time period consid-ered for this station (Fig. 11c).
The variations in atmospheric transport may, as mentioned above, be related to cir-culation changes expressed by the NAO index. The strongest correlation between the seasonal NAO index and the frequency of each cluster is found for Alert and Barrow 25
correla-ACPD
10, 12133–12184, 2010Black carbon and sulphate aerosol in
the Arctic
D. Hirdman et al.
Title Page
Abstract Introduction
Conclusions References
Tables Figures
◭ ◮
◭ ◮
Back Close
Full Screen / Esc
Printer-friendly Version Interactive Discussion
Discussion
P
a
per
|
Dis
cussion
P
a
per
|
Discussion
P
a
per
|
Discussio
n
P
a
per
|
tion to the NAO index in the summer (not shown).
3.4 Equivalent Black Carbon: cluster means and trends
The annual geometrical mean EBC concentration differ between the stations where Alert is associated with the highest values, followed by Barrow and thereafter Zeppelin (Fig. 12). At all three stations, the highest measured EBC mean concentrations for 5
all seasons but summer are associated with the Northern Eurasian clusters NE, WNE and ENE (Fig. 12). This result is consistent with earlier studies (Hopper et al., 1994; Polissar et al., 1999, 2001; Sharma et al., 2004, 2006; Hirdman et al., 2010; Gong et al., 2010) which concluded that Northern Eurasia is the main source of EBC for the Arctic near the surface.
10
Alert: at Alert, the mean EBC concentrations corresponding to the other transport clusters are much lower (by∼45–110 ngm−3or 220–375%), than the NE EBC concen-trations and are not significantly different from each other (Fig. 12a). The annual mean EBC concentrations measured at Alert have a clear negative trend of−3.8% yr−1, in ac-cordance with earlier studies (Sharma et al., 2006; Quinn et al., 2007) (Fig. 13a). The 15
largest decreasing EBC concentration trend is seen for cluster NE (Table 3), whereas the weakest decrease is associated with the NA cluster (Table 3) (Fig. 13a).
Barrow: at Barrow, on an annual basis, the NE cluster is associated with the high-est and the PA cluster generally is associated with the lowhigh-est EBC concentrations (Fig. 12b). In summer, however, the highest EBC concentrations are related to the 20
NA and PA clusters. This result corresponds well with earlier findings indicating that regional sources (including forest fires) are most important for the EBC concentrations in that part of the Arctic in summer (Barrie, 1986; Brock et al., 1989; Stohl, 2006; Hirdman et al., 2010). Due to the change of instrumentation at Barrow in 1998 (as discussed earlier in Sect. 2.1.2), all statistical calculations with this data set are made 25
ACPD
10, 12133–12184, 2010Black carbon and sulphate aerosol in
the Arctic
D. Hirdman et al.
Title Page
Abstract Introduction
Conclusions References
Tables Figures
◭ ◮
◭ ◮
Back Close
Full Screen / Esc
Printer-friendly Version Interactive Discussion
Discussion
P
a
per
|
Dis
cussion
P
a
per
|
Discussion
P
a
per
|
Discussio
n
P
a
per
|
significant.
Zeppelin: at Zeppelin, the highest annual mean EBC concentrations are associated with the ENE cluster followed by the WNE cluster (Fig. 12c), while the lowest EBC con-centrations occur with cluster NA. However, in spring, cluster WNE has, in some years, the highest EBC mean values due to the influence from the agricultural fires in Eastern 5
Europe in springtime (Stohl et al., 2007; Treffeisen et al., 2007) while the EBC concen-trations associated with cluster ENE are more stable. The annual EBC concenconcen-trations decrease at a rate of−9% yr−1(−1.44±0.8 ngm−3yr−1) (Fig. 13c), which is more than the−0.95 ngm−3yr−1reported by Eleftheriadis et al. (2009) for the time period 2001– 2007. The decrease is consistent and significant for all clusters but ENE, which shows 10
a statistically significant increase in winter (+9.4% yr−1or 4.1±3.3 ngm−3yr−1) and this increase might be related to emission increases in China.
Comparing these results to previous trend studies, we find that the annual mean EBC concentration measured at Alert (1989–2008) show an even larger decreasing trend than previously presented (−72% against−54% during 1989–2006, Sharma et 15
al., 2006). Also the EBC at Zeppelin (2002–2009) showed a stronger negative trend (−1.44±0.8 ngm−3yr−1), than the decrease of−0.95 ngm−3yr−1reported by Eleftheri-adis et al. (2009) for the time period 2001–2007. For the EBC concentrations measured at Barrow, there were no significant trends observed due to the change in instrumen-tation and the inconsistency between these measurements (see Sect. 2.1.2). Previous 20
studies have merged the two time series and derived long-term trends (Sharma et al., 2006; Quinn et al., 2007). However, the uncertainties associated with this are large.
3.5 Sulphate aerosol: cluster means and trends
In accordance with EBC, the annual geometrical mean sulphate concentration for Alert once again is associated with the highest values, followed by Barrow and Zeppelin 25
ACPD
10, 12133–12184, 2010Black carbon and sulphate aerosol in
the Arctic
D. Hirdman et al.
Title Page
Abstract Introduction
Conclusions References
Tables Figures
◭ ◮
◭ ◮
Back Close
Full Screen / Esc
Printer-friendly Version Interactive Discussion
Discussion
P
a
per
|
Dis
cussion
P
a
per
|
Discussion
P
a
per
|
Discussio
n
P
a
per
|
(Raatz and Shaw, 1984; Quinn et al., 2007, 2009; Hirdman et al., 2010). There are, however, prominent seasonal differences between the three stations.
Alert:the highest annual mean sulphate values measured at Alert are systematically associated with the NE cluster (Fig. 14a). This holds true for all seasons except for summer when the sulphate concentrations for all clusters are low and similar. For the 5
other three clusters, the interannual variation of sulphate concentrations is large and no systematic difference between the clusters is found. The annual trend in sulphate at Alert is negative for all clusters and for all seasons. Between 1985 and 2006, the sulphate concentrations decreased by 63.9% (see Fig. 15a). The negative relative trends are similar for the AO, NE and PA clusters, all displaying a decrease of 66–68% 10
while the NA decrease is less than 53% (see Table 3).
Barrow: at Barrow, the highest sulphate concentrations are also associated with the NE cluster followed by the NA cluster (Fig. 14b). The lowest concentrations are related to the PA cluster, except in the year of 2006 when it is instead related to the overall highest concentrations. No significant trends were seen in the measured sulphate at 15
Barrow over the time period of this study, neither for the entire data set nor for any of the clustered subsets (Fig. 15b). This is due mainly to the short time period with available data. The Alert data show that the trends at this station were stronger for the earlier years than for the period for which data are available at Barrow.
Zeppelin: the highest sulphate concentrations at Zeppelin are associated with the 20
ENE clusters, followed by the WNE cluster (Fig. 14c). The smelting industry in Norilsk is situated in the region where the ENE cluster is most sensitive to emissions, again confirming the importance of this source region (Khokhar et al., 2005; Hirdman et al., 2010). The lowest concentrations are associated with the NA cluster. There was a gen-eral, statistically significant, decrease of sulphate concentrations at Zeppelin of 21.5% 25
over the whole time period (see Fig. 15c). This decreasing trend is most pronounced for the WNE cluster (−52.6%) and least so for the NA cluster (−9.7%) (for more details see Table 3).
ACPD
10, 12133–12184, 2010Black carbon and sulphate aerosol in
the Arctic
D. Hirdman et al.
Title Page
Abstract Introduction
Conclusions References
Tables Figures
◭ ◮
◭ ◮
Back Close
Full Screen / Esc
Printer-friendly Version Interactive Discussion
Discussion
P
a
per
|
Dis
cussion
P
a
per
|
Discussion
P
a
per
|
Discussio
n
P
a
per
|
at the three stations agrees quite well (although somewhat lower) with what has been previously reported for springtime by Quinn et al. (2007). Alert shows a clear decrease of−64% (1985–2006) compared with−66–71% in springtime (1981–2003) as reported by Quinn et al. (2007). The reduction in measured sulphate of−22% (1990–2008) at Zeppelin well compares with −27–33% in spring 1990–2003) reported by Quinn et 5
al. (2007). In agreement with Quinn et al. (2007), we find no significant trends for Barrow.
3.6 The relative importance of changing transport and changing emissions for the overall trends
So far, we have investigated the mean EBC and sulphate concentrations and their 10
trends for every cluster individually and this comparison was made using geometric mean concentrations. The following section use arithmetic mean concentrations to enable a contribution calculation. The contribution of a particular cluster to the total annual mean concentration also depends on its frequency. To quantify the annual con-tributions of the four clusters, we multiplied the cluster arithmetic mean concentrations 15
with the respective cluster’s frequency. The resulting time series includes the effects of both changing transport pathways and changing emissions on the four clusters’ con-tributions to the total concentration. When summing up the concon-tributions from all four clusters, the original measurement time series is obtained. To investigate the effect of changing transport pathways on the cluster contributions alone, we also calculated the 20
contributions when holding the cluster mean concentrations constant over time. For this, we arbitrarily used the cluster-mean concentrations derived from the first three years of the time series. In this case, the sum of the cluster contributions is influenced only by changes in cluster frequencies. Comparison of trend estimates with constant and varying cluster-mean concentrations thus allow quantification of the fraction of 25
ar-ACPD
10, 12133–12184, 2010Black carbon and sulphate aerosol in
the Arctic
D. Hirdman et al.
Title Page
Abstract Introduction
Conclusions References
Tables Figures
◭ ◮
◭ ◮
Back Close
Full Screen / Esc
Printer-friendly Version Interactive Discussion
Discussion
P
a
per
|
Dis
cussion
P
a
per
|
Discussion
P
a
per
|
Discussio
n
P
a
per
|
bitrary but the results when using mean values over the whole period were consistent with this approach (not shown).
3.6.1 Equivalent Black Carbon
Alert:at Alert, the largest contribution to the measured EBC is from the AO cluster (see Fig. 16a), due to the high frequency of this cluster, which more than compensates for 5
the below-average concentrations associated with it. The second largest contributor is cluster NE followed by clusters NA and PA. The EBC concentrations decreased rapidly in the 1990s but remained nearly constant since 1998. While there is a large observed trend over the whole period, −3.7±0.9 ngm−3yr−1, there is no trend at all (0.0±0.2 ngm−3yr−1) when holding the cluster-mean concentrations constant. This is 10
explained by the fact that the mean EBC concentrations of clusters AO and NA, which show the largest and opposing trends in frequency, are very similar (see Fig. 11). This shows that at Alert, changes in the EBC concentrations are driven mainly by emission changes, not by circulation changes, despite the trend of the NAO indices towards lower values during the period of available measurement data, which is consistent with 15
the findings of Gong et al. (2010).
Barrow: at Barrow, the interannual variability of the annual mean EBC concentrations is larger than at Alert and none of the trends is statistically significant at a 90% confi-dence level (Fig. 16b). The variability is driven mainly by changing contributions from the dominant AO cluster. However, in some years (e.g., 1994) cluster NE is the largest 20
contributor. Trend estimates at Barrow are complicated by the break in the measure-ment record but it appears that the trend since 1998 was very small:−0.06 ngm−3yr−1. There was a much larger downward trend of−2.07 ngm−3yr−1 during the first period, however. When holding the cluster mean concentrations constant, there is still a small downward trend of−0.15 ngm−3yr−1over the entire time period, which is driven mainly 25
How-ACPD
10, 12133–12184, 2010Black carbon and sulphate aerosol in
the Arctic
D. Hirdman et al.
Title Page
Abstract Introduction
Conclusions References
Tables Figures
◭ ◮
◭ ◮
Back Close
Full Screen / Esc
Printer-friendly Version Interactive Discussion
Discussion
P
a
per
|
Dis
cussion
P
a
per
|
Discussion
P
a
per
|
Discussio
n
P
a
per
|
ever, during the second period, the circulation-driven trend is actually 233% of the observed trend, so that it seems possible that emissions in regions influencing Barrow have slightly (but insignificantly) increased during the second period.
Zeppelin: even though the EBC data record is rather short at Zeppelin (Fig. 16c), mean concentrations have been decreasing during that period and about 4.9% of that 5
decrease can be explained by circulation changes, the larger part is driven by emis-sion reductions. The overall decreasing trend runs counter to a recent BC emisemis-sion inventory for the Svalbard area, which reports small but strongly increasing emissions between the year 2000 and 2007, which are mostly driven by increased shipping emis-sions (Vestreng et al., 2009). Obviously, the EBC concentrations at Zeppelin are still 10
more influenced by emission sources outside the Svalbard area than by the relatively small local emissions. However, further increases in local emissions would eventually also increase local concentrations.
3.6.2 Sulphate aerosol
Alert: the cluster contribution to the measured sulphate shows strong similarities with 15
the EBC at Alert, with relatively small interannual variability (Fig. 17a) but a strong and consistent downward trend. While only 5.3% of the total observed trend can be explained by the trend in the transport, variability of the transport does explain a lot of the year-to-year variation of the measured sulphate, with observed local maxima or minima mostly corresponding to maxima and minima of the time series with fixed 20
cluster concentrations. A strong decrease of the measured sulphate concentrations can be observed especially in the early 1990s, after the break-down of the former Soviet Union.
Barrow: at Barrow, the total observed change,+4.6±11.8 ngm−3yr−1, is insignificant (Fig. 17b). When holding the cluster mean concentrations constant, there is a small 25
ACPD
10, 12133–12184, 2010Black carbon and sulphate aerosol in
the Arctic
D. Hirdman et al.
Title Page
Abstract Introduction
Conclusions References
Tables Figures
◭ ◮
◭ ◮
Back Close
Full Screen / Esc
Printer-friendly Version Interactive Discussion
Discussion
P
a
per
|
Dis
cussion
P
a
per
|
Discussion
P
a
per
|
Discussio
n
P
a
per
|
increased over the time period considered. However, the time period is too short to reveal any significant trend.
Zeppelin: at Zeppelin, the overall observed trend is−3.4±1.7 ngm−3yr−1, whereas when holding the cluster mean concentrations constant the overall trend is insignificant and small,−0.01±0.49 ngm−3yr−1 (Fig. 17c). Only 0.3% of the decreasing trend can 5
be explained by the changes in the circulation.
4 Conclusions
In this paper we have presents trend calculations for equivalent black carbon and sul-phate for three Arctic stations, Alert, Barrow, and Zeppelin. We have also investigated which source regions have determined the overall concentrations and their long-term 10
trends. Finally, we have quantified the impact of variations in atmospheric transport on the long-term trends. Listed below are the main findings of this study.
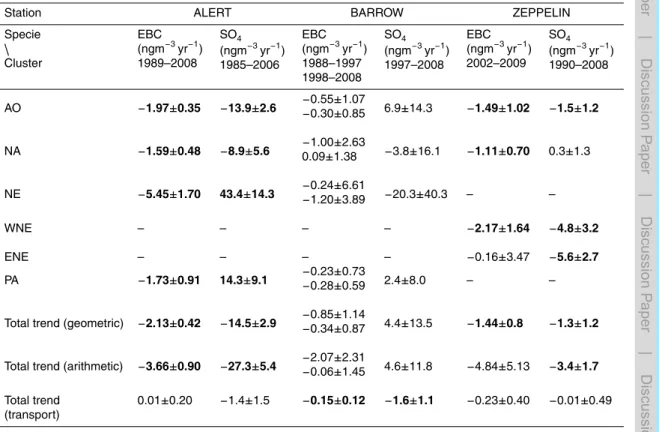
1. There is a general downward trend in the measured EBC concentrations at all stations, with an annual decrease of −2.1±0.4 ngm−3 yr−1 (for the years 1989– 2008) and−1.4±0.8 ngm−3yr−1(2002–2009) at Alert and Zeppelin respectively. 15
The decrease at Barrow is not statistically significant.
2. The measured sulphate concentrations show a decreasing trend at Alert and Zep-pelin of −15±3 ngm−3 (1985–2006) and −1.3±1.2 ngm−3 (1990–2008) per year respectively, while the trend at Barrow is unclear.
3. Northern Eurasia (clusters NE, WNE and ENE) is the dominant emission source 20
region for both EBC and sulphate at all Arctic stations.
ACPD
10, 12133–12184, 2010Black carbon and sulphate aerosol in
the Arctic
D. Hirdman et al.
Title Page
Abstract Introduction
Conclusions References
Tables Figures
◭ ◮
◭ ◮
Back Close
Full Screen / Esc
Printer-friendly Version Interactive Discussion
Discussion
P
a
per
|
Dis
cussion
P
a
per
|
Discussion
P
a
per
|
Discussio
n
P
a
per
|
(AO, NA, PA, and WNE) have been stable or decreasing over the time periods in this study, thus driving the overall trend.
5. Transport explains a major part of the interannual variability of EBC and sulphate concentrations at the stations. At the same time, however, only a minor part of the long-term trends in EBC (0.3–7.2%) and sulphate (0.3–5.3%) can be explained 5
by changes in transport patterns.
6. The interannual variation of the cluster frequency is relatively well correlated to the annual NAO index, which shows a downward trend since most of the measure-ments started. However, the circulation changes are not large enough to cause substantial long-term trends of EBC and sulphate.
10
7. The large interannual variability in the measured EBC and sulphate concentra-tions at all staconcentra-tions and can mask trends over shorter periods, which points out the importance of continuous monitoring in the Arctic over long time periods. 8. The change of instrumentation at Barrow in 1998 severely affects our capability to
derive EBC trends for periods overlapping this point in time. While previous stud-15
ies have reported longer-term trends, based on a comparison of measurements during overlapping period, we have low confidence in longer-term trend estimates at Barrow.
Acknowledgements. We thank ECMWF and met.no for access to the ECMWF archives. We
would also like to thank the Global Monitoring Division at NOAA Earth System Research Labo-20
ACPD
10, 12133–12184, 2010Black carbon and sulphate aerosol in
the Arctic
D. Hirdman et al.
Title Page
Abstract Introduction
Conclusions References
Tables Figures
◭ ◮
◭ ◮
Back Close
Full Screen / Esc
Printer-friendly Version Interactive Discussion
Discussion
P
a
per
|
Dis
cussion
P
a
per
|
Discussion
P
a
per
|
Discussio
n
P
a
per
|
References
Aas, W., Solberg, S., Manø, S., and Yttri, K. E.: Monitoring of long range transported air pollutants, annual report for 2007, Norwegian Institute for Air Research, Kjeller, 2008. Ambaum, M. H. P., Hoskins, B. J., and Stephenson, D. B: Arctic Oscillation or North Atlantic
Oscillation?, J. Climate, 14, 3495–3507, 2001. 5
Arnott, W., Hamasha, K., Moosmuller, H., Sheridan, P., and Ogren, J.: Towards aerosol light-absorption measurements with a 7-wavelength aethalometer: Evaluation with a photoacous-tic instrument and 3-wavelength nephelometer, Aerosol Sci. Technol., 39, 17–29, 2005. Ashbaugh, L.: A statistical trajectory technique for determining air-pollution source regions, J.
Air Pollut. Control Assoc., 33, 1096–1098, 1983. 10
Ashbaugh, L., Malm, W., and Sadeh, W.: A residence time probability analysis of sulfur con-centrations at grand-canyon-national-park, Atmos. Environ., 19, 1263–1270, 1985.
Barnston, A. G. and Livezey, R. E.: Classification, seasonality and persistence of low-frequency atmospheric circulation patterns, Mon. Weather Rev., 115, 1083–1126, 1987.
Barrie, L.: Arctic air-pollution – an overview of current knowledge, Atmos. Environ., 20, 643– 15
663, 1986.
Bodhaine, B. A. and Dutton, E. G.: A long-term decrease in Arctic Haze at Barrow, Alaska, Geophys. Res. Lett., 20, 947–950, 1993.
Bond, T., Anderson, T., and Campbell, D.: Calibration and intercomparison of filter-based mea-surements of visible light absorption by aerosols, Aerosol Sci. Technol., 30, 582–600, 1999. 20
Bond, T. and Bergstrom, R.: Light absorption by carbonaceous particles: An investigative review, Aerosol Sci. Technol., 40, 27–67, 2006.
Br ´eon, F.-M., Tanr ´e, D., and Generosso, S.: Aerosol Effect on Cloud Droplet Size Monitored from Satellite, Science, 295, 5556, doi:10.1126/science.1066434, 2002.
Brock, C. A., Radke, L. F., Lyons, J. H., and Hobbs, P. V.: Arctic Hazes in summer over Green-25
land and the North American Arctic. I: Incidence and Origins, J. Atmos. Chem., 9, 129–148, 1989.
Burkhart, J. F., Bales, R. C., McConnell, J. R., and Hutterli, M. A.: Influence of North Atlantic Oscillation on anthropogenic transport recorded in northwest Greenland ice cores, J. Geo-phys. Res., 111, D22309, doi:10.1029/2005JD006771, 2006.
30
ACPD
10, 12133–12184, 2010Black carbon and sulphate aerosol in
the Arctic
D. Hirdman et al.
Title Page
Abstract Introduction
Conclusions References
Tables Figures
◭ ◮
◭ ◮
Back Close
Full Screen / Esc
Printer-friendly Version Interactive Discussion
Discussion
P
a
per
|
Dis
cussion
P
a
per
|
Discussion
P
a
per
|
Discussio
n
P
a
per
|
Chatterjee, S. and Hadi. A. S.: Influential Observations, High Leverage Points, and Outliers in Linear Regression, Stat. Sci., 1, 379–416, 1986.
Delene, D. and Ogren, J.: Variability of aerosol optical properties at four North American surface monitoring sites, J. Atmos. Sci., 59, 1135–1150, 2002.
Dickson, R. R., Osborn, T. J., Hurrell, J. W., Meincke, J., Blindheim, J., Adlandsvik, B., et. al.: 5
The Arctic Ocean Response to the North Atlantic Oscillation, J. Climate, 13, 2671–2696, 2000.
Eckhardt, S., Stohl, A., Beirle, S., Spichtinger, N., James, P., Forster, C., Junker, C., Wagner, T., Platt, U., and Jennings, S. G.: The North Atlantic Oscillation controls air pollution transport to the Arctic, Atmos. Chem. Phys., 3, 1769–1778, doi:10.5194/acp-3-1769-2003, 2003. 10
Eleftheriadis K., Vratolis S., and Nyeki S.: Aerosol black carbon in the European Arctic: Mea-surements at Zeppelin station, Ny- ˚Alesund, Svalbard from 1998–2007, Geophys. Res. Lett., 36, L02809, doi:10.1029/2008GL035741, 2009.
Engvall, A.-C., Str ¨om, J., Tunved, P., Krejci, R., Schlager, H., and Minikin, A.: The radiative ef-fect of an aged, internally-mixed Arctic aerosol originating from lower-latitude biomass burn-15
ing, Tellus B, 61, 677–684, 2009.
Flanner, M. G. and Zender, C. S.: Linking snowpack microphysics and albedo evolution, J. Geophys. Res., 111, D12208, doi:10.1029/2005JD006834, 2006.
Flanner, M. G., Zender, C. S., Randerson, J. T., and Rasch, P. J.: Present-day cli-mate forcing and response from black carbon in snow, J. Geophys. Res., 112, D11202, 20
doi:10.1029/2006JD008003, 2007.
Folland C. K., Knight, J., Linderholm, H. W., Fereday, D., Ineson, S., and Hurrell, J. W.: The Summer North Atlantic Oscillation: Past, Present and Future, J. Climate, 22, 1082–1103, 2009.
Forster, C., Stohl, A., and Seibert, P.: Parameterization of convective transport in a lagrangian 25
particle dispersion model and its evaluation, J. Appl. Meteorol. Climatol., 46, 403–422, 2007. Garrett, T. J., Radke, L. F., and Hobbs, P. V.: Aerosol Effects on Cloud Emissivity and Surface
Longwave Heating in the Arctic, J. Atmos. Sci., 59, 769–778, 2002.
Gong, S. L., Zhao, T. L., Sharma, S., Toom-Saunry, D., Lavou ´e, D., Zhang, X. B., et al.: Identifi-cation of trends and interannual variability of sulfate and black carbon in the Canadian High 30