Analysis of snow bidirectional reflectance from ARCTAS spring-2008 campaign
Texto
Imagem


Documentos relacionados
Here, we use airborne radar altimetry data and snow density measurements de- rived from snow/firn cores and neutron-probe observations obtained over the dry snow zone of the GrIS
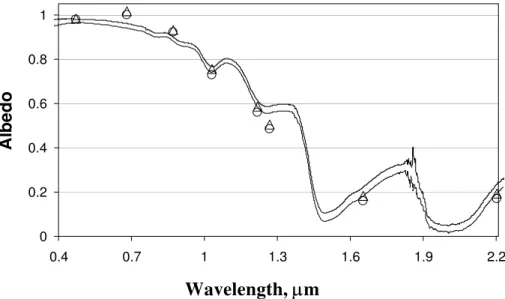
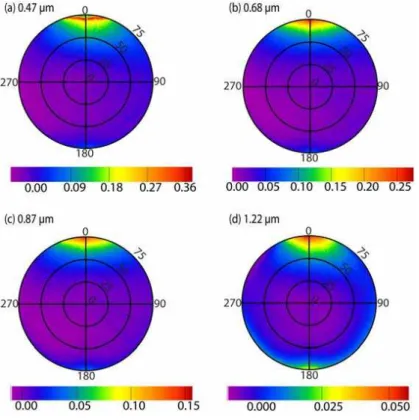
Considering the spectral dependence of albedo with values reaching nearly unity in the ultraviolet (UV; 280–400 nm) and visible (400–780 nm) part of the solar spectrum (Grenfell et
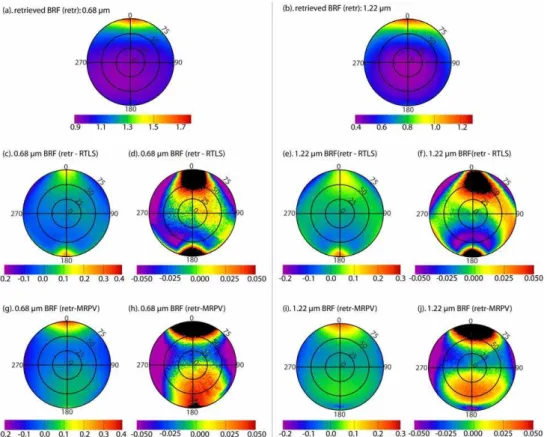
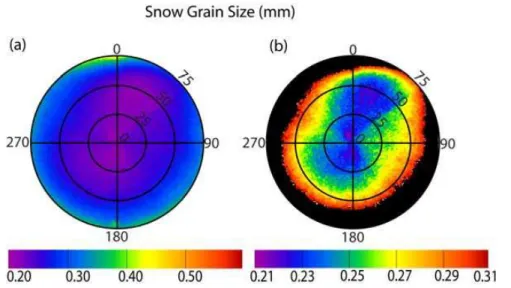
ter of snow for a given scene by matching the measured reflectance with a simulated value assuming an ice crystal model with an asymmetry parameter consistent with the
The present study investigates the possibil- ity of a relationship between the coastal topography with steep slopes and sea-salt snow chemistry, using high reso- lution data from
Hydrologic response data include hourly stream discharge from the catchment outlet weir, continuous snow depths from one location, intermittent snow depths from 5 locations, and
At the first stage of the measurements results analysis, the gear wheel cast surface image was compared with the casting mould 3D-CAD model (fig.. Next, the measurements results
How to fuse all kinds of snow information (snow depth measurements from meteorological stations and derived from passive microwave sensors, and MODIS SCA products) to produce snow
The validation of the MODIS melt pond data set was conducted with aerial photos from the MELTEX campaign 2008 in the Beaufort Sea, data sets from the National Snow and Ice Data
