DOI: 10.1590/0004-282X20160063
ARTICLE
Balance impairment does not necessarily
coexist with gait apraxia in mild and moderate
Alzheimer’s disease
Comprometimento do equilíbrio e apraxia da marcha não necessariamente coexistem na
doença de Alzheimer leve e moderada
Fernando Vieira Pereira, Fabricio Ferreira de Oliveira, Rodrigo Rizek Schultz, Paulo Henrique Ferreira Bertolucci
Earlier studies suggested that frontal and parietal corti-ces, basal nuclei and/or neural pathways among them (white matter lesions) underlie apraxia disorders1,2. he mesial fron
-tal lobes3 and the supplementary motor area4 have already
been linked to gait apraxia (GA), despite the need for more research to include other potential neuroanatomic sites.
In the literature, GA is considered a frontal gait disor-der as well as a high level gait disordisor-der5. Importantly, GA is
commonly described as the most complex and less under-stood gait disorder among the high level gait disorders. For example, Elble6reported that GA relies over controversial
concepts and contributes to make the high level gait
disor-ders even more complex. Zadikof and Lang7 went further
by suggesting that GA is more likely to be a misnomer than a real clinical entity.
Della-Sala et al.8 investigated GA in patients with mild
and moderate Alzheimer’s disease (AD) by elaborating and validating a scale called “Assessment Walking Skills” (AWS).
In their results, the authors not only veriied that 40% of their sample (n = 60) performed below the cut-of of AWS (< 38), but they also reported that both dementia severity (r = 0.53) and upper limb apraxia (r = 0.50) had signiicant correlations
Universidade Federal de São Paulo, Escola Paulista de Medicina, Departamento de Neurologia e Neurocirurgia, São Paulo SP, Brasil.
Correspondence: Fernando Vieira Pereira; Departamento de Neurologia e Neurocirurgia, UNIFESP; Rua Botucatu 740 – térreo; 04023-900 São Paulo SP, Brasil; E-mail: [email protected]
Conflict of interest: There is no conflict of interest to declare.
Support: Coordenação de Aperfeiçoamento de Pessoal de Nível Superior (CAPES).
Received 07 January 2016; Received in final form 22 March 2016; Accepted 01 April 2016.
ABSTRACT
Currently, there are no studies reporting how much balance impairment coexists with gait apraxia in mild and moderate Alzheimer’s disease (AD). Objectives: To assess correlations among gait apraxia, balance impairment and cognitive performance in mild (AD1, n = 30) and moderate (AD2, n = 30) AD. Method: The following evaluations were undertaken: gait apraxia (Assessment Walking Skills); balance performance (Berg Balance Scale); Clinical Dementia Rating and Mini-mental State Examination (MMSE). Results: While disregarding AD subgroups, Berg Balance Scale and the MMSE correlated significantly with Assessment Walking Skills and 23% of all subjects scored below its cut-off. After stratification, Berg Balance Scale correlated significantly with Assessment Walking Skills in both AD subgroups, and with the MMSE only in AD1. Conclusions: Balance impairment does not necessarily coexist with gait apraxia. Gait apraxia is more prevalent in moderate AD when compared with mild AD.
Keywords: Alzheimer disease; gait; apraxias; postural balance.
RESUMO
Apraxia da marcha e desequilíbrio são condições subinvestigadas na doença de Alzheimer (DA) leve e moderada. Objetivo: Verificar a correlação da apraxia da marcha com desequilíbrio e cognição em 30 idosos com DA leve (DA1) e 30 idosos com DA moderada (DA2).
Método: Foram feitas as seguintes avaliações: apraxia da marcha (Assessment Walking Skills); equilíbrio (Berg Balance Scale); Clinical Dementia Rating e Mini-exame do estado mental – MEEM. Resultados: Desconsiderando-se os grupos, Berg Balance Scale e MEEM correlacionaram-se significativamente com a Assessment Walking Skills, enquanto 23% dos participantes pontuaram abaixo da note de corte da mesma. Considerando-se os grupos, Berg Balance Scale correlacionou-se significativamente com a Assessment Walking Skills em ambos os grupos, embora o MEEM o tenha feito apenas em DA1. Conclusões: Desequilíbrio e apraxia da marcha não necessariamente coexistem com apraxia da marcha. Prevalência de apraxia da marcha foi maior na DA moderada do que na DA leve.
with AWS (p < 0.01). To our knowledge, AWS is the only quan -titative gait apraxia test available in the literature.
In addition, it is pretty hard to talk about gait without mentioning balance, which can be summarized as the abil-ity to maintain the body’s center of mass over its base of sup-port, no matter the condition (static or dynamic)9. In
sum-mary, preserved balance performance is a precondition for successful gait performance.
Previous studies suggested that impaired balance performance is more evident in AD individuals when compared with controls10 and declines according to the
dementia stage11. Similar results were reported by
Kato-Narita et al.12when the Berg Balance Scale (BBS) was
em-ployed to measure balance performance in mild and mod-erate AD. In their results, the authors reported that BBS correlated with disease severity but not with history of falls or functional decline.
Taking prior studies into consideration, this investigation aimed to answer the following question: “How much do im -paired balance performance and GA correlate with each oth-er in mild and modoth-erate AD?” Moreovoth-er, two othoth-er objectives
were outlined: to check whether cognitive performance cor -relates with GA; and to compare three independent scales, mini-mental examination (MMSE), BBS and AWS between patients with mild and moderate AD.
Here we emphasize that this investigation did not in -tend to disentangle or validate the GA terminology per se, but rather its presence in mild and moderate AD. For more details about GA and its history we suggest the ref-erence by Elble6.
METHOD
Participants
Subjects with mild (AD1 subgroup) and moderate (AD2 subgroup) AD were recruited from the Behavioral Neurology Section of our university hospital. All the patients with AD who were included in this investigation already had a
diag-nosis of probable AD, which was conirmed by way of the
Consortium to Establish a Registry for Alzheimer’s Disease13,
and all subjects were treated with cholinesterase inhibitors.
his study was approved by the Ethics Committee of our uni -versity hospital. Every participant and/or his legal represen-tative signed an informed consent form.
Inclusion criteria for AD subgroups were: one year or
more of probable AD diagnosis; balance-related complaints
conirmed by both the caregiver and the patient; and pre -served comprehension of verbal commands. Exclusion
crite-ria were: use of gait auxiliary devices; clinical Parkinsonian
signs; and positive report for vestibular symptoms, peripheral neuropathies, severe rheumatic disorders, limited visual acu-ity and orthostatic hypotension-related symptoms.
Subgroup characteristics
Mini-mental State Examination14 and Clinical
Dementia Rating (CDR)15 scales were employed to
allo-cate patients into AD1 or AD2 subgroups. AD1: CDR = 1.0 and MMSE scores between 19 and 25; AD2: CDR = 2.0
and MMSE scores between 12 and 18. It is important to highlight that CDR, and not MMSE, was employed to con-sider each patient as mild or moderate AD. MMSE cut-off scores described above were added only to avoid ceiling and floor effects, since CDR is not affected by education and previous reports have already identified significant correlations between their scores16,17.
GA assessment
Assessment Walking Skills is a binary (one/zero) qualita
-tive scale for gait apraxia divided into two parts: the irst part
evaluates trunk praxis while walking and has 22 items; the second part evaluates lower limbs praxis while walking and
has 20 items. Each item must be scored as zero (incorrect an -swer) or one (correct an-swer). Minimal and maximal scores
range from zero to 42 points. he cut-of score was set at
38 points. Employment of the AWS scale followed the guide-lines published by Della-Sala et al.8.
Balance assessment
The Berg Balance Scale18,19 evaluates both static and
dynamic balance performance while standing and
walk-ing. The BBS has excellent reliability and good correla -tion with other balance assessment instruments such
as the Tinetti scale (r = 0.91) and the Timed Up and Go Test (r = 0.76)20. The BBS has 14 items with scores rang
-ing from 0 to 4 each (best condition = 56). Scores between 53–46 mean low to moderate risk of falls, between 45–20 mean high risk of falls, and scores < 20 mean wheelchair
bound users and/or recurrent fallers21. Since
measure-ment of risk of falls was not the objective of this research, BBS cut-off scores were not employed to verify the level of agreement with the AWS scale.
Data analysis
All the statistical analysis was undertaken with the SPSS
software. Two samples t-test was employed for paired com
-parisons. Pearson correlation coeicients (PCC) and lin -ear regression analysis (R2) were calculated to quantify the
strength and evaluate the level of agreement among AWS, the BBS and the MMSE in both AD subgroups, despite the
fact that diferent AD subgroups were not considered to ver -ify correlations between the MMSE and the BBS with AWS in the overall analysis. Regression analysis modeling was ad-justed for age and gender when necessary. All the compari-son tests were two-tailed and the p-value for statistical
RESULTS
Overall analysis
A total of 30 mild AD (AD1 subgroup) and 30 moderate
AD (AD2 subgroup) subjects were recruited. Regarding AWS,
14 (23.3%) patients with AD (13.3% from AD1 and 33.3% from AD2) scored below the cut-of of AWS (< 38). When pa -tients with AD were considered as a whole (no subgroups),
the BBS reached the most signiicant correlation with AWS (PCC = 0.628, R2 = 0.395, p < 0.001). Once the MMSE was add
-ed to the model (multiple linear regression), the correlation
became less signiicant (p = 0.002), despite the fact that both PCC and regression increased in 0.072 (PCC = 0.700) and 0.095 (R2 = 0.489), respectively. Importantly, age and gender
did not signiicantly inluence this correlation when utilized
as controlling variables. A scatterplot (matrix) with regres-sion values among AWS, the BBS and the MMSE was built for better visualization of the data above (Figure 1).
Subgroup analysis
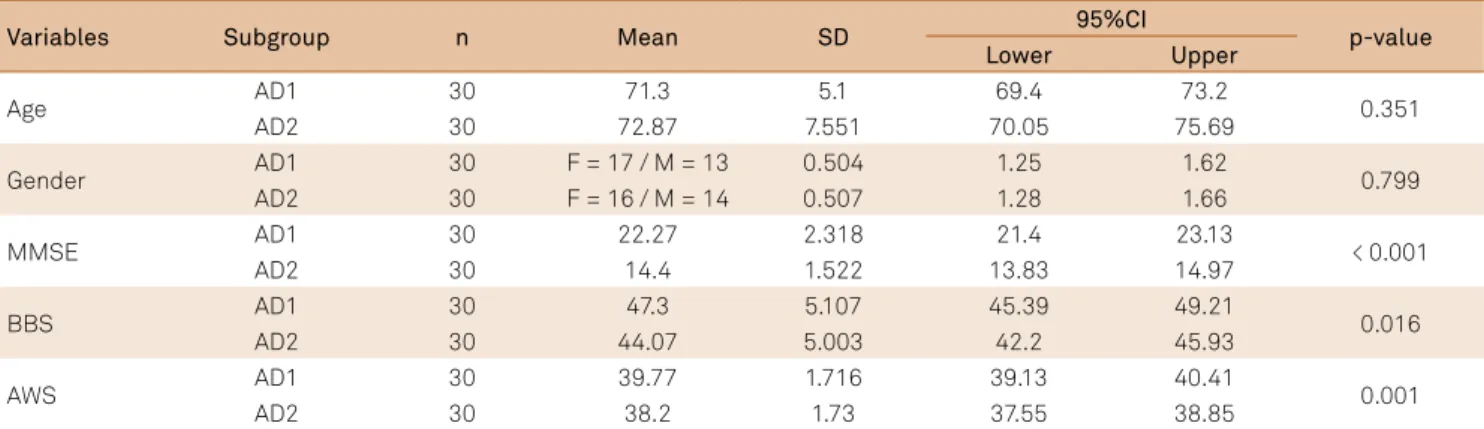
Table 1 shows demographic and score results from both
AD subgroups, as well as the comparative analysis between them. Age and gender were not signiicantly diferent be
-tween the AD subgroups. AWS and the BBS correlated
sig-niicantly in both AD1 (PCC = 0.524, R2 = 0.274, p = 0.003) and
AD2 (PCC = 0.632, R2 = 0.399, p < 0.001) subgroups. Regarding
the MMSE, we observed that it correlated signiicantly with AWS in AD1 (PCC = 0.623, R2 = 0.388, p < 0.001) but not in
AD2 (PCC = 0.217, R2 = 0.047, p = 0.249). Furthermore, both
BBS and MMSE correlations with AWS throughout AD
sub-groups were not inluenced by age or gender when employed
as controlled variables. See Figure 2 for better visualization of the data above.
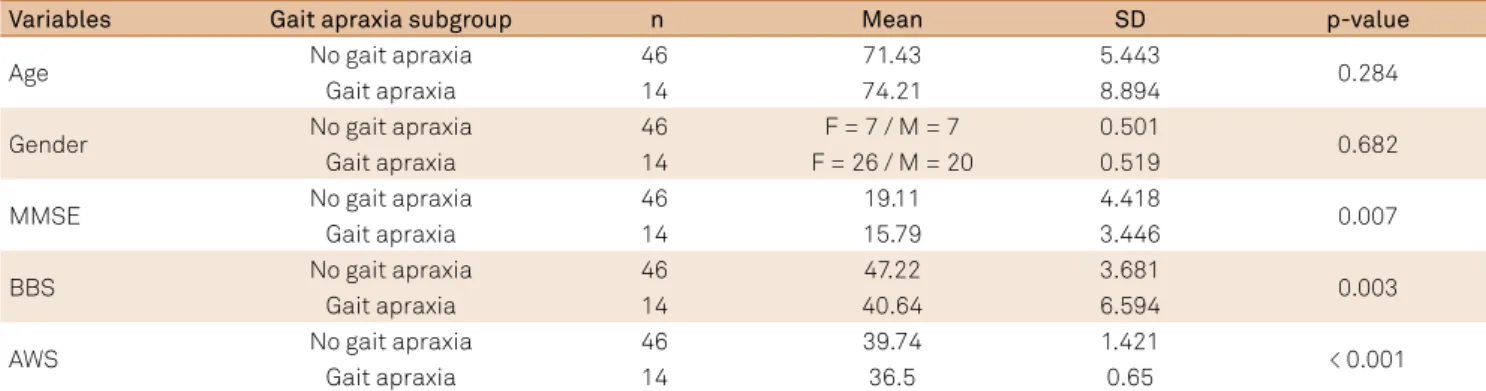
AWS-subgroup analysis
Here we aimed to analyze potential signiicant difer -ences regarding age, gender, MMSE and BBS scores
be-tween patients with AD who scored above (ADabove:
AWS ≥ 38, n = 46) and below the cut-of of AWS (ADbelow: AWS < 38, n = 14). In ADabove, the BBS (PCC = 0.521,
R2 = 0.271, p < 0.001) and the MMSE (PCC = 0.514, R2 = 0.264,
p < 0.001) correlated signiicantly with AWS. In relation to ADbelow, the BBS and the MMSE did not have signiicant
correlations. More details about this comparison are shown
in Table 2 and in Figures 3 and 4.
In addition, we also compared the 14 AD patients (4 from
AD1 and 10 from AD2) who scored below the cut-of of AWS.
Table 1. Demographic and clinical comparisons between mild Alzheimer’s disease (AD1) and moderate Alzheimer’s disease (AD2) subgroups.
Variables Subgroup n Mean SD 95%CI p-value
Lower Upper
Age AD1 30 71.3 5.1 69.4 73.2 0.351
AD2 30 72.87 7.551 70.05 75.69
Gender AD1 30 F = 17 / M = 13 0.504 1.25 1.62 0.799
AD2 30 F = 16 / M = 14 0.507 1.28 1.66
MMSE AD1 30 22.27 2.318 21.4 23.13 < 0.001
AD2 30 14.4 1.522 13.83 14.97
BBS AD1 30 47.3 5.107 45.39 49.21 0.016
AD2 30 44.07 5.003 42.2 45.93
AWS AD1 30 39.77 1.716 39.13 40.41 0.001
AD2 30 38.2 1.73 37.55 38.85
SD: standard deviation; 95%CI: confidence interval of the mean. MMSE: mini-mental state examination; BBS: Berg balance scale; AWS: assessment walking skills; F: female; M: male.
Figure 1. Simple linear regressions regarding assessment walking skills (AWS), Berg balance scale (BBS) and mini-mental state examination (MMSE) for all participants.
BBS;MMSE: R2 Linear = 0.538 AWS;BBS: R2 Linear = 0.538 MMSE;BBS: R2 Linear = 0.538 BBS;AWS: R2 Linear = 0.538 MMSE;AWS: R2 Linear = 0.499 AWS;MMSE: R2 Linear = 0.499
AWS BBS
MMSE
AWS
BBS
More details about these 14 individuals are shown in Table 3.
In this scenario, the correlation between the BBS and the
MMSE was not signiicant for both AD1 and AD2 subgroups (p > 0.05) even after age and gender adjustments.
DISCUSSION
Provided by Della-Sala et al.8 since prevalence of GA
tends to be higher in moderate than in mild AD.
When patients with AD were stratiied into ADabove and ADbelow the cut-of of AWS, it was possible to verify that both the BBS and the MMSE had signiicant correlations in the ADabove subgroup only. Similar results were conirmed
by verifying AWS correlations with the BBS and the MMSE between AD1 AND AD2 individuasl who scored below the
cut-of of AWS. In this scenario, the BBS and the MMSE did
not correlate in both subgroups.One possible explanation
about these conlicting data might be related to the small sample of individuals (4 from AD1 and 10 from AD2) who scored below the cut-of of AWS.
It is hard to evaluate apraxic disorders because they are usually exclusion diagnoses22. In relation to GA, we
conduct-ed a similar approach to earlier studies, since simpler
expla-nations should be considered irst in AD individuals with walking diiculties. In this investigation, the CDR was em -ployed to stratify patients with AD into subgroups of mild and moderate AD. Ranges of MMSE scores were used as a secondary tool to make sure the cognitive performance was
in agreement with the classiication provided by the CDR
scale. It is important to note that this methodology did not limit our statistical analysis, since MMSE correlations with
AWS and the BBS were veriied either by considering two AD subgroups or by putting them together (no subgroups). his
analysis is available in Figures 1, 2 and 3.
Earlier studies had demonstrated signiicant correlations
between gait and cognitive decline in AD23,24. However, con
-irmation of frontal involvement in these patients might de -mand neuroimaging and a more comprehensive cognitive as-sessment to investigate every single domain related to these brain regions. Behavioral symptoms might also be correlated with gait in the same way that they are correlated with cogni-tive and functional decline in AD25, which would be an
inter-esting idea for future studies.
In summary, we can say that 23% of patients with AD (10 from the AD2 subgroup) with balance related complaints
Figure 2. Simple linear regressions regarding assessment walking skills (AWS), Berg balance scale (BBS) and mini-mental state examination (MMSE) for mild Alzheimer’s disease (AD1) and moderate Alzheimer’s disease (AD2) subgroups.
AD2 AD1 AD2 AD1 Group
AD1;BBS;MMSE: R2 Linear = 0.262 AD2;BBS;MMSE: R2 Linear = 0.074 AD1;AWS;BBS: R2 Linear = 0.274 AD2;AWS;BBS: R2 Linear = 0.399 AD1;MMSE;BBS: R2 Linear = 0.262 AD2;MMSE;BBS: R2 Linear = 0.074 AD1;BBS;AWS: R2 Linear = 0.274 AD2;BBS;AWS: R2 Linear = 0.399 AD1;MMSE;AWS: R2 Linear = 0.388 AD2;MMSE;AWS: R2 Linear = 0.047 AD1;AWS;MMSE: R2 Linear = 0.388 AD2;AWS;MMSE: R2 Linear = 0.047
AWS BBS
MMSE
AWS
BBS
MMSE
Table 2. Comparisons between subject subgroups regarding gait apraxia.
Variables Gait apraxia subgroup n Mean SD p-value
Age No gait apraxia 46 71.43 5.443 0.284
Gait apraxia 14 74.21 8.894
Gender No gait apraxia 46 F = 7 / M = 7 0.501 0.682
Gait apraxia 14 F = 26 / M = 20 0.519
MMSE No gait apraxia 46 19.11 4.418 0.007
Gait apraxia 14 15.79 3.446
BBS No gait apraxia 46 47.22 3.681 0.003
Gait apraxia 14 40.64 6.594
AWS No gait apraxia 46 39.74 1.421 < 0.001
Gait apraxia 14 36.5 0.65
scored below the cut-of of AWS. In other words, 77% of pa -tients with AD with balance related complaints did not have
GA according to AWS. hese numbers are nearly half of those
reported by Della-Sala et al.8 when 40% of patients with AD
scored below the cut-of of AWS. In relation to that, it is nec -essary to highlight that whilst they included patients with AD
with gait diiculties, this investigation included patients with AD with balance-related complaints only. Despite those ind -ings, a common thread is that our results match those In this investigation, the main contradictory result was that MMSE
and AWS scores correlated signiicantly in AD1 but not in AD2. In this scenario, there are two possible explanations: the least
reasonable one is that cognitive performance does not cor-relate with GA; and the most reasonable one is that a deeper cognitive evaluation should be considered since the MMSE is a cognitive screening tool and has its own limitations. Despite
this caveat, the MMSE correlated signiicantly with AWS once
patients with AD were separated between those above and
below the cut-of of AWS. A possible interpretation for that is
that the correlation of the MMSE with AWS would be useful
to diferentiate patients with AD under higher risk for GA but useless if employed to estimate GA risk for diferent disease se -verity stages (mild and moderate).Another possible limitation
regards both the BBS and AWS. he BBS is a functional balance
assessment tool and so was not designed to distinguish among
Table 3. Comparisons between mild Alzheimer’s disease (AD1) and moderate Alzheimer’s disease (AD2) subjects who scored below the cut-off of assessment walking skills (AWS).
Variables Subgroup n Mean SD t-test
Age AD1 4 68.75 3.5 0.049
AD2 10 76.4 9.571
Gender AD1 4 F = 2 / M = 2 0.577 0.99
AD2 10 F = 5 / M = 5 0.527
MMSE AD1 4 20.25 2.062 0.003
AD2 10 14 1.826
BBS AD1 4 41.5 10.116 0.834
AD2 10 40.3 5.314
AWS AD1 4 36.75 0.5 0.325
AD2 10 36.4 0.699
SD: standard deviation; MMSE: mini-mental state examination; BBS: Berg balance scale; F: female; M: male.
Figure 3. Simple linear regression between assessment walking skills (AWS) and the Berg balance scale (BBS) for mild Alzheimer’s disease (AD1) and moderate Alzheimer’s disease (AD2) subjects scoring above and below the cut-off of AWS.
AWS
42 40
38 36
BBS
55
50
45
40
35
30
25
Gait apraxia No gait apraxia Gait apraxia No gait apraxia Gait apraxia
No gait apraxia: R2 Linear = 0.271 Gait apraxia: R2 Linear = 0.088
Figure 4. Simple linear regression between assessment walking skills (AWS) and the mini-mental state examination (MMSE) for mild Alzheimer’s disease (AD1) and moderate Alzheimer’s disease (AD2) subjects scoring above and below the cut-off of AWS.
Gait apraxia No gait apraxia Gait apraxia No gait apraxia Gait apraxia
No gait apraxia: R2 Linear = 0.264 Gait apraxia: R2 Linear = 0.184
AWS
42 40
38 36
MMSE
26
24
22
20
18
16
14
diferent types of balance impairments. However, this is not a
limitation of the BBS only since most functional balance assess-ment scales assess risk of falls and/or functional limitations but do not help to elucidate their etiology26. In a certain way, we
have the same for AWS since it does not provide the underlying cause for GA. Finally, the small sample size precludes deeper as-sumptions regarding gait apraxia in these patients.
By intending to avoid comments like “apraxia of gait is an-other term that perhaps is a misnomer7”, we propose a GA
rat-ing scale (e.g. mild, moderate and severe). A similar approach was also proposed by Elble6. Yet, future GA-related studies
should consider running a factorial statistical analysis for AWS, since it has 42 items and its completion is time consuming.
References
1. Leiguarda RC, Marsden CD. Limb apraxias: higher-order disorders of sensorimotor integration. Brain. 2000;123(5):860-79. doi:10.1093/brain/123.5.860
2. Mink JW. The basal ganglia: focused selection and inhibition of competing motor programs. Prog Neurobiol. 2006;50(4):381-425. doi:10.1016/S0301-0082(96)00042-1
3. Rossor MN, Tyrrell PJ, Warrington EK, Thompson PD, Marsden CD, Lantos P. Progressive frontal gait disturbance with atypical Alzheimer’s disease and corticobasal degeneration. J Neurol Neurosurg Psychiatry. 1999;67(3):345-52. doi:10.1136/jnnp.67.3.345
4. Della Sala S, Francescani A, Spinnler H. Gait apraxia after bilateral supplementary motor area lesion. J Neurol Neurosurg Psychiatry. 2002;72(1):77-85. doi:10.1136/jnnp.72.1.77
5. Nutt JG, Marsden CD, Thompson PD. Human walking and higher level gait disorders, particularly in the elderly. Neurology. 1993;43(2):269-79. doi:10.1212/WNL.43.2.268
6. Elble RJ. Gait and dementia: moving beyond the notion of gait apraxia. J Neural Transm (Vienna). 2007;114(10):1253-8. doi:10.1007/s00702-007-0743-3
7. Zadikoff C, Lang AE. Apraxia in movement disorders. Brain. 2005;128(7):1480-97. doi:10.1093/brain/awh560
8. Della Sala S, Spinnler H, Venneri A. Walking difficulties in patientes with Alzheimer’s disease might originate from gait apraxia. J Neurol Neurosurg Psychiatry. 2004;75(2):196-201.
9. Shumway-Cook A, Woollacott MH. Motor control: theory and practical applications. Philadelphia: Lippincott, Williams & Wilkins; 2001.
10. Chong RK, Horak FB, Frank J, Kaye J. Sensory organization for balance: specific deficits in Alzheimer’s disease but not in Parkinson’s diasease. J Gerontol A Biol Sci Med Sci. 1999;54(3):122-8. doi:10.1093/gerona/54.3.M122
11. O’Keeffe ST, Kazeem H, Philpott RM, Playfer JR, Gosney M, Lye M. Gait disturbance in Alzheimer’s disease: a clinical study. Age Ageing. 1996;25(4):313-6. doi:10.1093/ageing/25.4.31
12. Kato-Narita EM, Nitrini R, Radanovic M. Assessment of balance in mild and moderate stages of Alzheimer’s disease: implications on falls and functional capacity. Arq Neuropsiquiatr. 2011;69(2A):202-7. doi:10.1590/S0004-282X2011000200012
13. Morris JC, Heyman A, Mohs RC, Hughes JP, Belle G, Fillenbaum G et al. The consortium to establish a registry for Alzheimer’s disease (CERAD): Part I. Clinical and neuropsychological assessment of Alzheimer’s disease. Neurology. 1989;39(9):1159-65. doi:10.1212/WNL.39.9.1159
14. Folstein F, Folstein S, McHugh PR. Mini-mental state: a practical method for grading the cognitive state of patients for the clinician. J Psychiatr Res. 1975;12(3):189-98. doi:10.1016/0022-3956(75)90026-6
15. Chaves MLF, Camozzato AL, Godinho C, Kochhann R, Schuh A, Almeida VL et al. Validity of the Clinical dementia rating scale for the detection and staging of dementia in Brazilian patients. Alzheimer Dis Assoc Disord. 2007;21(3):210-7. doi:10.1097/WAD.0b013e31811ff2b4
16. Perneczky R, Wagenpfeil S, Komossa K, Grimmer T, Diehl J, Kurz A. Mapping scores onto stages: mini-mental state examination and clinical dementia rating. Am J Geriatr Psychiatry. 2006;14(2):139-44. doi:10.1097/01.JGP.0000192478.82189.a8
17. Maia ALG, Godinho C, Ferreira ED, Almeida V, Schuh A, Kaye J, Chaves MLF. [Application of the Brazilian version of the CDR scale in samples of dementia patients]. Arq Neuropsiquiatr. 2006;64(2B):485-9. Portuguese. doi:10.1590/S0004-282X2006000300025
18. Berg K, Wood-Dauphinee S, Williams JI, et al. Measuring balance in the elderly: preliminary development of an instrument. Physiother Can. 1989;41(6):304-11. doi:10.3138/ptc.41.6.304
19. Berg KO, Wood-Dauphinee SL, Williams JI, Maki B. Measuring balance in the elderly: validation of an instrument. Can J Public Health. 1992;83(Suppl 2):S7-11.
20. Mancini M, Horak FB. The relevance of clinical balance assessment tools to differentiate balance deficits. Eur J Phys Rehabil Med. 2010;46(2):239-48.
21. Shumway-Cook A, Baldwin M, Polissar NL, Gruber W. Predicting the probability for falls in community-dwelling older adults. Phys Ther. 1997;77(8):812-9.
22. Vanbellingen T, Bohlhalter S. Apraxia in neurorehabilitation: classification, assessment and treatment. NeuroRehabilitation. 2011;28(2):91-8. doi:10.3233/NRE-2011-0637
23. Holtzer R, Friedman R, Lipton RB, et al. The relationship between specific cognitive functions and falls in aging. Neuropsychology. 2007;21(5):540-8. doi:10.1037/0894-4105.21.5.540
24. Camicioli R, Howieson D, Lehman S, Kaye J. Talking while walking: the effect of a dual task in aging and Alzheimer’s disease. Neurology. 1997;48(4):955-8. doi:10.1212/WNL.48.4.955
25. Oliveira FF, Wajman JR, Bertolucci PHF, Chen ES, Smith MC. Correlations among cognitive and behavioural assessments in patients with dementia due to Alzheimer’s disease. Clin Neurol Neurosurg. 2015;135:27-33. doi:10.1016/j.clineuro.2015.05.010
26. Decker L, Annweiler C, Yvain F, Leroux P, Lermite P, Berrut G et al. [How to manage gait and balance disorders among older adults aged 65 years and older with mild to moderate dementia in clinical practice?]. Geriatr Psychol Neuropsychiatr Vieil. 2011;9(3):269-76. French. doi:10.1684/pnv.2011.0291
In conclusion, impaired balance performance does not necessarily coexist with GA. Prevalence of GA tends to be higher in moderate AD when compared with mild AD, despite the fact that the MMSE correlated with AWS only
in mild AD. he BBS and the MMSE correlated signiicantly
with AWS when no subgroups were considered.
In the AWS-subgroup (AD1 and AD2 individuals below
the cut-of of AWS), neither the BBS nor the MMSE reached signiicant correlations with AWS. Moreover, an important
limitation of this study resides on the fact that the sample