Federal University of Ceara
Department of Physics
ZHANG NANA
Growth and Vibrational Properties of Oxide
Crystals
ZHANG NANA
Growth and Vibrational Properties of Oxide
Crystals
Advisor: Prof. Dr. Ilde Guedes da Silva
A dissertation submitted to the Department of Physics of the Federal University of Ceara in partial fulfillment of the requirements for the Degree of Doctor of Physics.
ACKNOWLEDGMENTS
► I would like to express my deep and sincere gratitude to my advisor, Dr. Ilde Guedes da
Silva, who provided me all the support for the realization of the Raman scattering
experiments, hiswide knowledge and enthusiastic way of working have been of great value to
me. All these qualities will be good for my future career. It was my honor and it has been
really rewarding to work with him. Here, it was also my great pleasure to know his family.
► I owe my deep gratitude to my advisor Prof. Jiyang Wang (China) whose collaboration
with the Raman Group of the Department of Physics of the Federal University of Ceara, turns
out possible my stay in Brazil. Under his guidance I became more courageous and mature.
► I wish to express my warm and sincere thanks to Prof. Dr. Alejandro Pedro Ayala, who
always helped and encouraged me, and for the enlightening discussions on my work.
► I would like to express my deep thanks to Prof. Dr. Antônio Gomes Souza Filho and Prof.
Dr. Eduardo Bêde Barros, for critical reading this work and participate of my qualifying.
► I would like to express my deep gratitude to the other members of my Examination
Committee for my doctoral dissertation, Prof. Dr. Josué Mendes Filho, Prof. Dr. Paulo Sérgio
Pizani and Prof. Dr. Samuel Leite Oliveira, for the critical readings.
► I would like to show my gratitude to the staffs in the secretary and the others professors of
the Department of Physics of UFC, for their kind help and encouragements.
► I would like to express my deep gratitude to my roommate and great friend Sara. We spent
► I would like express the deep gratitude to my Jiejie Mylene and all her family (my family
in Brazil). When I encountered difficulties, they were always by my side, no words can
describe my grateful for them, and I wish all their life becomes happier and happier.
► I am grateful for my good friend Clenílton, for his selfless help on the professional
knowledge and for his always words of encouragement “don´t worry”.
► I express appreciation to my friend Leandro, who is interested in Chinese culture. We
helped each other in learning the languages; thanks for his encouragements.
► I would like to show my gratitude to my friend Vagner, who gave me great help on my
normal student life whenever I asked for.
► I express my gratitude to all the friends I knew in Brazil, namely: Gadelha, Otavio,
Manuela, Glaydson, Diego, et al. Many thanks for all of their kind help.
► I can not forget to thank Profs. Alice and Glaucya, with their great encouragements, I could
pass the language exams.
► One word, I would like to express my appreciation to any person I knew here, all of them
were so kind to me, it was my great pleasure to spend two years in this beautiful and happy
country--BRAZIL.
► I would like to thank the Department of Physics of the Federal University of Ceara and the
State Key Laboratory of Crystal Materials of Shandong University.
► Finally, financial support from the Brazilian agency CNPq and China Scholarship Council
SPECIAL
ACKNOWLEDGMENTS
To my parents that during so many years have supported, encouraged and taught me. Their selfless love is my greatest power forward.
To my parents in-law, whose understanding and support have increased my confidence to come and study in Brazil.
To my dear brother and his wife. You took good care of our parents, and our beloved family provided me good conditions to finish my learning.
“Do or do not…There is no try.”
ABSTRACT
In this work we used different experimental techniques to study four different series of
inorganic oxide crystals, namely: (i) congruent lithium isotope niobate (C7LN), (ii) rare-earth
doped mixed vanadates ((Nd,Yb):YxGd1-x(VO4)); (iii) alkali metal doped and pure calcium
barium niobates (CaxBa1-xNb2O6); and (iv) potassium tantalite niobate (KTa1-xNbxO3). Below
we describe the studies performed for each class.
(i) For further investigation on the defect structure of lithium niobate crystals (LiNbO3
– hereafter LN) using the neutron scattering technique, a congruent lithium isotope niobate
crystal (C7LN) was grown by the Czochralski method from a 48.4% 7Li melt. The X-ray
powder diffraction (XRPD) results show that the as-grown crystal is a single-phased (R3c)
LN. We observed 4A1(TO)+7E(TO) Raman modes. The crystal composition (Li mol%)
determined from UV absorption edge and Raman measurements is 47.47% and 47.34%,
respectively. The specific heat (Cp), thermal diffusion coefficients (λa , λc), thermal
conductivities (κa , κc) and the average thermal expansion coefficients (
α
a ,α
c) weredetermined. The effect of Li vacancy content is analyzed by comparing the results with those
obtained for near stoichiometric lithium isotope niobate (NS7LN) and congruent natural
lithium niobate (CLN)crystals. The values of all thermal parameters of C7LN are smaller than
those of NS7LN and CLN, which may be related to either the difference of vacancy content or
isotope substitution.
(ii) The room temperature phonon modes of the isostructural (Nd,Yb):YxGd1-x(VO4)
laser crystals were determined using the Raman scattering technique, and the observed
compounds with the tetragonal zircon structure, 19 4h
D . They were assigned according to the
group theory in terms of the internal modes of the VO4tetrahedron and the external modes of
the YxGd1-x(VO4) lattice. No appreciable changes in the phonon wavenumbers were observed
for Yb:GdVO4 (Yb = 0.008, 0.015, 0.020, 0.025, and 0.035), indicating that the force fields in
the GdVO4 lattice are not strongly altered by Yb doping at the Gd site. However, most of the
phonon wavenumbers in the systems (Nd,Yb):YxGd1-x(VO4) shifts upwards (one-phonon-like
behavior) when Y replaces Gd.
(iii) The room temperature phonon modes of both the alkali metal doped and pure
CaxBa1-xNb2O6 (hereafter CBNx) crystals were determined using the Raman scattering
technique. Owing to the intrinsic disorder of the tetragonal lattice we observed few and broad
bands. The wavenumber of the internal modes observed shifts upwards when the volume of
the unit cell increases. This blue shift is likely to be related to the shortening of the Nb-O
band length of the NbO6 octahedrons. The Curie temperatures of the ferroelectric to
paraelectric phase transition for all the CBN-like crystals were obtained from DSC
measurements. The Raman spectra of CBN32 in the temperature range from 300 to 568 K
were recorded in order to investigate and verify the ferroelectric phase transformation. The
lower-temperature (25-260 K) dependent Raman spectra of CBN32 were also recorded, and
the results show that it may exhibit a phase transition at 75-100 K.
(iv) Single crystals of potassium tantalite niobate, KTa1-xNbxO3 (KTNx, x = 0.45, 0.50,
and 0.55), were synthesized by the top-seeded solution growth method. The Raman scattering
technique is used to investigate the sequence of phase transitions undergone by KTNx crystals.
Special attention is given to the changes which characterize the
CONTENTS
ACKNOWLEDGMENTS...i
v ABSTRACT ... ix
CONTENTS ... xi
LIST OF FIGURES ... x
LIST OF TABLES ... xvii
CHAPTER 1 INTRODUCTION ... 1
1.1 Isotope lithium niobate (7LiNbO3) crystals ... 1
1.2 Mixed-vanadate (Nd, Yb:(YxGd1-xVO4)) crystals ... 3
1.3 Calcium barium niobate (CBN) crystals ... 5
1.4 Potassium tantalite niobate (KTN) crystals ... 7
2 ISOTOPE LITHIUM NIOBATE (7LiNbO3) CRYSTALS ... 10
2.1 Introduction ... 10
2.2 Experimental procedure ... 10
2.2.1 Crystal growth ... 10
2.2.2 Characterizations ... 12
2.3 Results and discussion ... 13
2.3.1 The as-grown crystal and structure ... 13
2.3.2 The spectroscopic measurements ... 15
2.3.3 The thermal properties measurements ... 19
2.4 Conclusion ... 24
3 MIXED-VANADATE (Nd, Yb:(YxGd1-xVO4)) CRYSTALS ... 25
3.2 Experimental procedure ... 25
3.2.1 Crystal growth ... 25
3.2.2 Characterizations ... 26
3.3 Results and discussion ... 27
3.3.1 Crystal compositions and structure ... 27
3.3.2 Raman spectrum ... 30
3.3.3 One-phonon model ... 39
3.4 Conclusion ... 41
4 CALCIUM BARIUM NIOBATE (CBN) CRYSTALS ... 42
4.1 Introduction ... 42
4.2 Experimental procedure ... 42
4.2.1 Crystal growth ... 42
4.2.2 Characterizations ... 44
4.3 Results and discussion ... 45
4.3.1 Crystal compositions and structure ... 45
4.3.2 Raman spectrum ... 46
4.4 Conclusion ... 58
5 POTASSIUM TANTALITE NIOBATE (KTN) CRYSTALS ... 59
5.1 Introduction ... 59
5.2 Experimental procedure ... 59
5.2.1 Crystal growth ... 59
5.2.2 Characterizations ... 62
5.3 Results and discussion ... 63
5.3.1 Crystal structure and Raman-active modes ... 63
CONCLUDING REMARKS ... 75
REFERENCES ... 77
LIST OF FIGURES
2.1. The crystal growth apparatus. ... 11
2.2. The morphology of as-grown C7LN and NS7LNcrystals ... 14
2.3. XRPD pattern of as-grown C7LN and NS7LN crystals ... 15
2.4. The absorption edge of (a) C7LN and (b) NS7LN crystals. ... 16
2.5. Room temperature Raman spectra of C7LN and NS7LN crystals, A1(TO) and E(TO) phonons are detected in y(zz)y and x(yz)x configurations, respectively ... 17
2.6. DTA/TG curves of C7LN (solid) and NS7LN (dashed) crystals. . ... 19
2.7. The specific heats of C7LN (solid) and NS7LN (dashed) crystals ... 20
2.8. (a) Thernal expansion and (b) thermal expansion coefficients curves of C7LN (solid) and NS7LN (dashed) crystals. ... 21
2.9. (a) Thernal diffusion coefficients and (b) thermal conductivity of C7LN (solid) and NS7LN (dashed) crystals. ... 23
3.1. The XRPD result of yNd:YxGd1-x(VO4) crystals . ... 28
3.2. The unit cell parameters of yNd:YxGd1-x(VO4) crystals varying on the crytal contents ... 29
3.3. The unit cell structure of REVO4 crystals ... 29
3.4. Room temperature polarized Raman spectra of Nd:YxGd1-xVO4 (x = 0.0, 0.17, 0.53, and 0.81), recorded in different polarizations: (a) (zz), (b) (xx), (c) (zx) and (d) (xy).. ... 31
3.5. Observed wavenumbers for the compounds as a function of doping content . ... 34
3.7. Room temperature polarized Raman spectra of yYb:YxGd1-xVO4 , with (y, x) =
(0.0048, 0.3), (0.0071, 0.41), (0.0092, 0.58), (0.0135, 0.87), (0.008, 1), recorded
in different polarizations: (a) (zz), (b) (xx), (c) (zx) and (d) (xy)... 38
3.8. Plot of
(
ωin-phasex ωin-phaseGd)
2for all the compounds listed in Table 3.1. The straight line is the fit using Eq.(2). . ... 404.1. The morphology of as-grown CBN crystals (a) CBN26 (b) CBN32 (c) NCBN (d) KNCBN. ... 44
4.2. Room temperature Raman spectra for CBN crystals recorded in different polarizations: (a)x(zz)x, (b)x(yy)x, (c)z(xy)z and (d)x(yz) ... 48
4.3. The structure diagram of octahedrons (NbO6) of CBN crystals ... 50
4.4. Specific heat variation of CBN-like crystals.. ... 51
4.5. Temperature (298-568 K)-dependent Raman spectra of CBN32 in the x(zz)x geometry. ... 52
4.6. The temperature (298 – 568 K) dependence behavior of the wavenumbers of (a)
ν
2 mode (∼ 635 cm-1) and (b)ν
5 mode (∼ 260 cm-1) of CBN32 with A1 symmetry. The solid lines represent linear fits of the data points. ... 534.7. Temperature (25-260 K)-dependent Raman spectra of CBN32 in the x(zz)x geometry ... 53
4.8. The temperature (25-260 K) dependence behavior of the (a) wavenumbers and (b) FWHM (cm-1) of higher- and lower-
ν
5 mode with A1 symmetry, respectively .... 564.9. The temperature (25-260 K) dependence of the intensity ratios I2/I4 and I3/I4 of CBN32 with A1 symmetry.. ... 57
5.1. The phase diagram of KTN crystals. ... 60
5.2. The morphology of as-grown KTN crystals.. ... 62
KTN0.45.. ... 65
5.5. The temperature (°C) evolution of the Raman spectra of (a) x = 0.55 (b) x = 0.50 and (c) x = 0.45... ... 67 5.6. The temperature (°C)-dependent Raman spectra of (a) KTN0.55, (b) KTN0.50 and
(c) KTN0.45.. ... 68
5.7. Selected Raman spectra of KTNx and their spectral decomposition with
temperature (°C) (a) KTN0.55, (b) KTN0.50 and (c) KTN0.45 ... 70
5.8. Temperature dependence of the Raman modes in (a) KTN0.55, (b) KTN0.50 and (c)
KTN0.45. The solid lines are guide for eyes and the dashed lines indicate the phase
transition temperatures. ... 71 5.9. Temperature dependence of IA/IB for (a) KTN0.55, (b) KTN0.50 and (c) KTN0.45.
LIST OF TABLES
2.1. Frequency (cm-1) and linewidth, Γ(cm-1), in parenthesis, of the Raman-active modes for C7LN and NS7LN crystals ... 18 2.2. Experimental results of C7LN, NS7LN and CLN crystals. Chemical formula is calculated based on Li vacancy model. ([Li1-5xNbx (VLi)4x]NbO3, where VLi means
vacancy at Li-site). The values of specific heat (Cp), thermal diffusion
coefficients (λ) and thermal conductivity (κ) were determined at 300 K, the
average thermal expansion coeffients (
α
) is obtained between 298-773 K. Data for CLN were obtained from Ref. [79] ... 22 3.1. Chemical formula for y(Nd,Yb):YxGd1-x(VO4) crystals... 273.2. Wavenumbers (cm-1) and symmetry assignment of y(Nd,Yb):YxGd1-xVO4.. ... 33
4.1. The nominal concentration, lattice parameters (a and c), unit cell volume (V) and TC of CBN crystals ... 45
1
INTRODUCTION
Here we present a review of the main results already published for each class of oxide crystals considered and describe the main goals of this work.
1.1
Isotope lithium niobate (
7LiNbO
3
) crystal
Lithium niobate (LiNbO3, hereafter LN) crystal is an important multi-functional
crystal, which posses good piezo-electric, nonlinear-optic, electro-optic and photorefractive
properties, which has been widely used for tailoring optical and piezoelectric devices [1-3].
Congruent lithium niobate (CLN) crystals, which can be readily grown from a melt
composition with 48.4% Li2O and 51.6% Nb2O5 by Czochralski method [4],however, due to
the fact CLN is a non-stoichiometric compound with a compositional range of approximately
47-50 mol% Li2O [5], the intrinsic defects associated with the stoichiometry influence
seriously the properties of this material. Therefore, it is necessary to further investigate the
structure of LN crystals, and try to research some relationship between the
micro-structure and physical properties.
To explain the defect structure, some models based on the cation substitution have
been presented. Peterson et al. [6] based on the nuclear magnetic resonance measurements
(NMR), proposed a Nb vacancy (VNb) model ([Li1-xNbx] [Nb1-4x/5(VNb)4x/5]O3), which was
which was supported by the X-ray and neutron diffraction [9-11], NMR [12] and Raman
scattering results [13]. Although several efforts have been made to understand its intrinsic
lattice characteristics, there still remains a controversy on the defect structure of LN.
The X-ray diffraction technique is a common and important tool to resolve crystal
structure. However, due to the fact that the X-ray scattering technique is mainly related with
the electron clouds, the scattering length is proportional to the atomic number what makes it
unsensitive to light atoms. On the other hand, since the neutron scattering technique is related
to the atomic nucleus, it may be used to determine the specific positions of light atoms. For
LN crystal, consisting of O, Li, and H light elements, the nuclear scattering lengths of Li
(-1.900 fm) and Nb (7.054 fm) are of the same order but have opposite sign, indicating that the
neutron diffraction technique is a powerful tool to reveal the LN crystal structure.
The natural Li element contains two isotopes: 6Li and 7Li. The good quality single
crystal grown with natural Li (7.4% of 6Li) is not suitable for neutron scattering
measurements, because the 6Li isotope has a large neutron absorption cross section (940 barn)
as compared with 7Li (0.0454 barn) isotope, and both isotopes are randomly distributed in the
crystal lattice. To neutron diffraction experiments, the existence of 6Li isotope can absorb part
of neutrons from the neutron source. Therefore, the search for growing single crystal from
separated 7Li isotope is advisable.
To date, we found the following investigations about the isotope LN materials,
Repelin et al. [14] used polarized Raman spectroscopy to investigate the optical phonons of
7
LN and 6LN polycrystalline samples. Martin et al.[15] used the NMR technique to
investigate the lithium diffusion in the 7LN amorphous compound. Chowdhury et al. [16, 17]
reported on the lattice dynamics of the 7LN single crystal using neutron inelastic scattering
technique. However, some of the physical properties as well as the Raman and infrared
Therefore, in Chapter 2 we will report on the detailed growth of C7LN single crystal
and the characterizations of its primary properties.
1.2
Mixed-vanadate ((Nd,Yb):Y
xGd
1-x(VO
4) ) crystal
The laser diode pump solid-state lasers (DPSSL) present high pumping efficiency and
stable output power. DPSSL have found many important applications in different areas such
as: material processing, medicine, optical communications, laser displays and laser nuclear
fusion. Owing to these facts the search for laser materials that can be used as active media for
DPSSL lasers is very important.
Neodymium-doped yttrium vanadate (Nd:YVO4) crystal is likely one of the most
investigated laser crystals so far. It possesses excellent mechanical, physical, chemical, and
lasing properties. In the lamp pump era, researchers did not pay much attention to Nd:YVO4
crystal owing to its low thermal conductivity, and the YAG crystal takes the main role as laser
host medium. However, with the development of high power light emitting diodes (LED) in
the 1980´s the excellent laser properties of Nd:YVO4 crystal have been noticed. Nowadays,
the highest output power at fundamental wavelength is of the order of 35 W [18], and the
output power of intro-cavity doubled green laser is about 20 W [19].
Neodymium-doped gadolinium vanadate Nd:GdVO4 crystal was first reported in 1992
[20]. The laser properties of Nd:GdVO4 crystal may be better than those of Nd:YVO4, since
the former possesses high thermal conductivity [21].
A large number of papers demonstrating laser action in the systems Nd:YVO4 and
Nd:GdVO4 have already been published [22-30]. Since they are isostructural and have similar
Nd3+ ions can broaden. This broadening has attracted an increasing interest because of its
potential application for high pump power pulsed lasers.
Many reports on the laser action of Nd:YxGd1-xVO4 crystals in either continuous-wave
(cw) or pulsed mode have been demonstrated. In 2010, Liu et al. [31] reported on the actively
Q-switched laser performance of the Nd:YxGd1-xVO4 crystals. Liu et al. [32] also reported on
the cw laser performance of the Yb0.009 :Y0.575Gd0.416VO4 crystal. Ng et al. [33] demonstrated
a passively Q-switched Nd:Gd0.64Y0.36VO4 laser with a Cr4+:YAG saturable absorber. He et
al. [34] demonstrated a passively mode-locked Nd:Gd0.5Y0.5VO4 laser with a semiconductor
saturable absorber mirror. Liu et al. [35] discussed the improvement of passive Q-switching
performance of Nd:Gd0.64Y0.36VO4 as compared to that of Nd:YVO4 and Nd:GdVO4. Zhang et
al. [27] demonstrated laser performance at 1.34 µm for Nd:Gd0.8La0.2VO4. Yu et al. [36]
demonstrated cw laser performance at 1.06 µm for Nd:LuxGd1-xVO4 pumped bya diode laser.
However, the vibrational properties of these materials have not been done.
The REVO4 series of compositions (RE = Pr to Lu including Sc and Y) exhibit the
tetragonal (zircon-type) 19 4h
D structure with four molecules per unit cell (Z = 4). Because of
the tightly bound VO4 tetrahedral in REVO4, a simplified structure can be considered as being
composed of two sublattices of RE and VO4 “molecules”, with both RE and VO4 occupying
the crystallographic sites D2d. For a REVO4 crystal with zircon-type structure, the first-order
Raman phonon spectrum consists of narrow lines that correspond to Raman-allowed
zone-center modes, which obey definite polarization selection rules.
Room-temperature Raman phonons of some of the REVO4 compounds have been
reported previously. Polarized results can be found for PrVO4 [37], NdVO4 [37], GdVO4 [38],
TbVO4 [38], DyVO4 [38], and ErVO4 [39], while unpolarized results can be found for
and LuVO4 [44]. Recently, Santos et al. [45] provided a more accurate description of the
room-temperature phonons for SmVO4, HoVO4, YbVO4, and LuVO4 single crystals. Of the
12 zone-center Raman phonons expected, they observed 10 phonons for SmVO4 and HoVO4
and 9 for YbVO4 and LuVO4. The phonon symmetry assignment was given based on
correlations with previous results for other REVO4 compounds. Also, they analyzed the
correlation among the observed Raman wavenumbers and the rare earth atomic number (Z) in
order to determine the extent of the variation as RE increases in Z along the lanthanide series.
For a mixed RE RE′x 1 x′′− (VO )4 crystal the following features may be observed from the
phonon spectrum: (i) a broadening of the first-order Raman lines; (ii) activation of forbidden
Raman phonons; (iii) appearance of broad Raman bands reflecting the phonon density of
states; (iv) wavenumber shifting of some peaks proportional to the concentration of the dopant
element (i.e., one-phonon-like behavior), and (v) splitting of some peaks involving different
elements that share the same lattice site (i.e., two-phonon-like behavior).
Therefore, in Chapter 3, we will use the Raman spectroscopy to investigate the extent
of the modification of the GdVO4 phonons due to the doping of the Gd site by Y, Yb, and Nd.
1.3
Calcium barium niobate (CBN) crystals
Many niobate crystals with the tetragonal tungsten bronze (TTB) structure exhibit
excellent piezoelectric, electro-optical and nonlinear optical properties. Among these crystals,
SrxBa1-xNb2O6 (SBN) has been widely investigated. But their applications at high temperature
have been limited because of the relatively low phase transition temperature (in the range of
25 to 120 °C, depending on the composition).
crystal (Ca0.28Ba0.62Nb2O6, CBN28) by the Czochralski method. It is found that the Curie
temperature (TC) of CBN28 is 260 °C, much higher than SBN crystal (close to 200 °C), which
implies that CBN crystal may be applied more potentially over the high temperature range
than SBN crystals.
The TTB structure belongs to the P4bm(C4v2) space group with five molecules per unit
cell (Z = 5) [47]. The lattice cell formula is (A1)2(A2)4(B1)2(B2)8O30, where different cations
occupy both the A1 and A2 symmetry sites, forming a partially filled TTB structure. For SBN
[48] and Pb0.6Ba0.4Nb2O6 (PBN) [49] crystals, the Sr2+ cations occupy partially the A1
symmetry sites, while the Sr2+ and Ba2+ cations fulfill the A2 symmetry sites. However, for
CBN crystals [47, 50, 51], the Ca2+ cations occupy the A1(C4) sites, while the Ba2+ cations
occupy the A2(Cs) sites. The B1(C2v) and B2(C1) symmetry sites are completely filled by Nb
atoms, then the theoretically predicted reduced existence region for CBN is 0.2 ≤ x ≤ 0.4.
Since there are only five Ba2+ and Ca2+ cations available for six A sites in the unit cell, there
is a vacancy distributed among the A sites. Thus, the crystal quality and other proprieties can
be improved by means of ions dopant or further molecular design. Therefore, in our group we
grew series of CBN crystals included the pure CBN26 and CBN32 crystals as well as the
alkali metal doped KNCBN (K0.12Na0.08Ca0.28Ba0.62Nb2O6) and NCBN
(Na0.048Ca0.26Ba0.716Nb2O6).
To date, there are several studies performed in the CBN crystals. The optical
properties of CBN28 were reported by Esser et al. [47] in 2003. The thermal and electric
properties of CBN28 were reported by Song et al. in 2006 [52]. In 2007, Burianek et al. [53]
reported on the growth of five different CBN compositions in the range 0.22 ≤ x ≤0.35 and
observed that the lattice parameter c0 changes with varying the Ca content. In 2008,
Muehlberg et al. [54] investigated how TC changes in the system CaxSryBa1-x-yNb2O6.
properties of Nd:CBN, and the electromechanical and electro-optical properties of CSBN [56].
In Ref. [57], Gao et al. used Raman spectroscopy to determine the negative thermal expansion
(NTE) changes in the system ((Ca0.28Ba0.75)x(Sr0.6Ba0.4)1-x)Nb2O6 (x = 0.25, 0.5, and 0.75).
The Raman scattering technique has also been used to investigate phase transitions in
the CBN and SBN compounds. For instance, Faria et al. [58] investigated the
low-temperature phase transition in the Sr0.66Ba0.34Nb2O6 single crystal fibers. Speghini et al. [59]
studied the temperature evolution of the vibration at 630 cm-1 to observe the ferroelectric to
paraelectric phase transition in the SrxBa1-xNb2O6 (x = 0.33, 0.5 and 0.61) single crystals.
Kasprowicz et al. [60, 61] investigated the ferroelectric to paraelectric phase transition in
single crystals and nanopowders of Sr0.5Ba0.5Nb2O6 (SBN50) and (Eu,Er):SBN50.
However, the detailed analysis of the phonon spectra of CBN-like crystal at room
temperature, the ferroelectric phase transition at higher-temperature as well as the crystal
stability at lower-temperature have not been reported yet. Therefore, in Chapter 4 we will
perform the above investigations.
1.4
Potassium tantalite niobate (KTN) crystals
Potassium tantalite niobate (KTa1-xNbxO3, hereafter KTN) crystal is an outstanding
quality multi-functional crystal which presents large electro-optic and photorefractive
effects. KTN crystal is usually grown from the melt and exhibits perfect thermal, chemical
and mechanical properties, which is widely used in nonlinear-optic, optic storage, optical
communication and photoelectric-based devices.
KTN crystal is an infinite solid solution of KTaO3 (KT) and KNbO3 (KN) crystals.
tetragonal (P4mm(C4v1)) → cubic (Pm3m(Oh1)) [65]) as pure KNbO3 crystal. Therefore, the
KTN crystal can exist in both paraelectric and ferroelectric phases depending on the
crystal composition at room temperature. The Curie point (Tc) and the physical properties
of the crystal can be adjusted by the ratio between Ta and Nb. A KTN crystal with Tc near
room temperature can be grown by appropriately adjusting the composition of the raw
materials.
Although the first KTN crystal was fabricated in 1950´s, it was very difficult to
obtain large and good quality single crystals, which limited its technological applications.
Recently, due to the crystal growth technology improvement, large and relatively good
quality KTN single crystal have been successfully fabricated.
The Raman spectroscopy technique has been employed in order to study the phase
transitions in KTNx materials. For instance, in 1999 Xia et al. [66] studied the paraelectric
(cubic) to ferroelectric (tetragonal) structural phase transition of KTN0.48 single crystal, by
analyzing the condensed soft mode ν5, which is related to the symmetric bending vibration of
O2-O3 bonds. Similar behavior of the ν5 mode was also observed in Fe:KTN0.48 by Xia et al.
[67].
In 2003, Svitelskiy and Toulouse [68] investigated the coupling of translational modes
to the reorientational motion of KTNx. They showed that the coupling is responsible not only
for the depolarized component of the second-order Raman spectra but also for the frequency
decreasing of the transverse acoustic mode down to the third of three transitions, where
reorientational motion is no longer allowed.
In 2005, Bouziane, Fontane and Ayadi [69] measured the Raman spectrum of KTN0.012
single crystal for temperatures down to -263 oC. The unexpected Raman lines observed for T >
by the motion of Nb ions. The dependence of these lines on both temperature and electric
field reveals the formation of polar clusters as a precursor effect of the polar (ferroelectric)
phase.
In 2010, Bartasyte et al. [70] studied the sequence of phase transitions (rhombohedral
to orthorhombic (R-O), orthorhombic to tetragonal (O-T), and tetragonal to cubic (T-C)) in
thin films of KTNx (x = 0.35 and 0.5) deposited on MgO and LaAlO3 substrates. They
observed that the phase transition temperatures were different from those reported for bulk
samples. The enhancement of ferroelectricity is likely to be due to the biaxial strain in the
films. They established some criteria for the identification of the phase transitions, and
determined two out of three phase transitions (C-T and T-O). The O-R transition was difficult
to be identified since the expected changes in the 560 cm-1 region are subtle and the bands
could not be resolved due to band overlap.
To understand the full sequence of phase transitions undergone by highly-diluted
KTNx single crystals, we grew the KTNx (x = 0.45, 0.50 and 0.55) crystals, and in Chapter 5
2
ISOTOPE LITHIUM NIOBATE (
7
LiNbO
3
)
CRYSTALS
2.1
Introduction
Here we report on the detailed growth of C7LN single crystal and the characterizations
of its primary properties. The X-ray, Raman, absorption and thermal techniques were used to
characterize the C7LN single crystal. The effect of Li vacancy content is analyzed by
comparing the results with those obtained for near-stoichiometric lithium isotope niobate
(NS7LN) and congruent natural lithium niobate (CLN)crystals.
2.2
Experimental procedure
2.2.1 Crystal growth
The crystals were grown by Nana Zhang, Jiyang Wang, Huaijin Zhang, et al. in the
State Key Laboratory of Crystal Materials of Shandong University (China).
(1) The crystal growth apparatus
The C7LN single crystal was grown by the Czochraski method in a TDL
Figure 2.1. The crystal growth apparatus
(2) The synthesis of polycrystalline material
The starting materials for synthesis of C7LN polycrystalline material were 7LiOH
(99.9%) and Nb2O5 (99.99%), which were mixed in 48.4/51.6 molar proportion of 7
Li2O/Nb2O5 according to the following reaction:
LiOH +NbO = LiNbO3+H2O↑ 7
5 2 7
2 2
(1)
7
LiOH has a strong chemical activity and can easily absorb H2O and CO2 from air to
form 7LiOH· H2O and 7Li2CO3. First, it must be baked at about 100 °C for at least 24 h to
remove water, and then the pressed mixture was put into a platinum crucible, heated up to 450
°C , 850 °C, 1000 °C for 4 h, 4 h, 5 h, respectively, to form polycrystalline material. 7LiOH is
also a strong alkali and can corrode the platinum crucible, mainly at high temperatures.
Therefore, we put a pure Nb2O5 pellet in the bottom of the mixture to prevent the contact
between 7LiOH and the crucible during sintering procedure.
A c-axis natural LN crystal rod (Φ 3 mm × 20 mm) was used as seed. During the
growing, the pulling rate ranged from 0.3 to 0.5 mm/h and the rotation rate was kept at 5 rpm.
The crystal was cooled down to room temperature in air at a rate of 30 °C/h.
For the sake of comparison, we also grew NS7LN crystal with the similar growth
procedure but the following molar proportion of raw materials (7Li2O/Nb2O5 = 58.5/41.5).
2.2.2 Characterizations
(1) X-ray powder diffraction (XRPD)
The phase identification of the as-grown crystal was verified using X-ray powder
diffractometer (Bruker, model: Smart PPEX II) with Cu Kα1 line (λ = 1.5406 ×10⁻¹⁰ m). The
unit cell parameters were calculated using LeBail method and TOPASS program.
(2) Density
The crystal density was measured using the buoyancy method at room temperature.
(3) The absorption spectrum
The absorption measurements were performed using a U-3500 Hitachi
spectrophotometer in the 190-3200 nm wavelength range at room temperature.
(4) Raman spectrum
The room temperature backscattered polarized Raman spectra were recorded on a
Jobin-Yvon Model T64000 triple spectrometer with a spectral resolution of 2 cm−1. The
instrument was equipped with a liquid-N2-cooled charge-coupled device system. For spectral
excitation, green 514.5 nm radiation from a Coherent Model Innova 70 Ar+-ion laser
operating at 30 mW was employed.
The Differential thermal analysis and thermalgravimetric (DTA/TG) melting were
performed on heating at a rate of 15 K/min over the room temperature to 1300 oC.
(6) Specific heat
The specific heat (Cp) measurements were performed on heating at a rate of 10 K/min
using a differential scanning calorimeter (DSC822e) in the 288-573 K range.
(7) The thermal expansion and diffusion measurements
The thermal expansion and diffusion coefficients were obtained using a thermal
mechanical analyzer (TMA) between 298 K and 773 K with a rate of 5 K min-1. The laser
pulsed method was used to measure the thermal diffusion coefficients on a Nanoflash LFA
447 along the a- and c-axis.
Polished samples of good quality with dimensions 5(X) × 6(Y) × 7(Z) mm3 were
provided for Raman and thermal expansion measurements, while samples with dimensions
6×6×2 (a, b, c) mm3 were provided for absorption and thermal diffusion experiments.
2.3
Results and discussion
2.3.1 The as-grown crystal and structure
(1) The as-grown crystal
Figure 2.2 shows the morphology of as-grown C7LN and NS7LN single crystals. They
Figure 2.2. The morphology of as-grown C7LN and NS7LN crystals
(2) XRPD
The XRPD pattern is shown in Figure 2.3, which indicates that the as-grown crystals
are single-phased (R3c) LN. The unit cell parameters and volume calculated of C7LN and
NS7LN single crystals are a = b = 5.1496 Å, c = 13.8662 Å, V = 319.72 Å3, and a = b =
5.1540 Å, c = 13.8713 Å, V = 319.11 Å3, respectively.
(3) Density
The density of C7LN and NS7LN single crystals determined by buoyancy method at
room temperature is 4.626 g/cm3and 4.614 g/cm3, respectively. The crystal density can be
calculated by using the formula of ρ = MZ/(NAV), where, M is the crystal molar mass, Z is the
number of molecular per unit-cell, NA is the Avogadro constant and V is the unit-cell volume.
The calculated density of C7LN and NS7LN single crystals is 4.588 g/cm3 and 4.634 g/cm3,
25 30 35 40 45 50 55 60 65 70 75
25 30 35 40 45 50 55 60 65 70 75 25 30 35 40 45 50 55 60 65 70 75
C7LN
2 Theta (deg.)
LN JCPDS 98-1111
In
te
n
s
it
y
(C
P
S
)
NS7LN
Figure 2.3.XRPD pattern of as-grown C7LN and NS7LN crystals
2.3.2 The spectroscopy measurements
(1) UV absorption spectrum
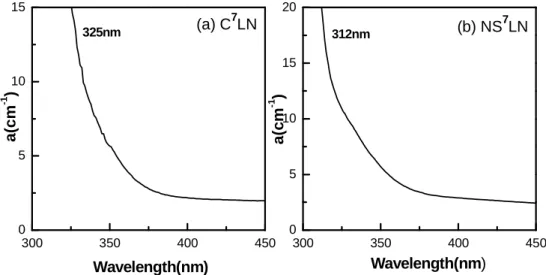
The LN crystal content can be obtained by the method of UV absorption edge
measurements. In general, the absorption edge is defined as the wavelength corresponding to
the absorption coefficients at 15 cm-1 and 20 cm-1. The relation between the absorption edge
λ15 = 321.9 − 1.579x − 5.745x2 [71], (2)
λ20 = 320.4 − 1.829x − 5.485x2 [71], (3)
where λ15 and λ20 are the wavelength corresponding to the absorption coefficients at 15 cm-1
and 20 cm-1, respectively. The x value stands for the deviation of Li concentration from the
congruent composition, i.e., x% = [Li]% − 48.38%. The absorption edge measured of C7LN
and NS7LN is shown in Figs 2.4 (a) and (b), respectively, we can see that the absorption edge
of C7LN is about 325 nm (λ15) while the absorption edge and of NS7LN is 312 nm (λ20), with
these values we find cLi (C7LN) = 47.47% and cLi (NS7LN) = 49.46%.
300 350 400 450
0 5 10 15 20
300 350 400 450
0 5 10 15
a
(c
m
-1 )
Wavelength(nm)
312nm (b) NS
7 LN
a
(c
m
-1 )
Wavelength(nm)
325nm (a) C
7 LN
Figure 2.4. The absorption edge of (a) C7LN and (b) NS7LN crystals
(2) Raman spectrum
At room temperature, LN crystal exhibits R3c space group structure with two
molecules per unit cell (Z = 2). Its Raman-active modes can be expressed as Γ = 4A1+9E.
Figure 2.5 displays the Raman spectra of C7LN and NS7LN crystals. According to the group
theory analysis, 4A1(TO) and 9E(TO) Raman-active modes are expected in the y(zz)y and
100 200 300 400 500 600 700 800 900 A1(TO)
Raman shift (cm-1)
C7LN NS7LN
* *
I
n
te
n
s
it
y
(
a
rb
.u
n
it
s
)
C7LN
E(TO)
NS7LN
* *
Figure 2.5. Room temperature Raman spectrum of C7LN and NS7LN crystals. A1(TO) and E(TO) phonons are
detected in y(zz)y and x(yz)x configurations, respectively
Schaufele and Weber [72] observed 3A1(TO)+7E(TO) modes for LN. Repelin et al. [14]
observed 4A1(TO) modes and 9E(TO) modes for 7LN, and 4A1(TO)+8E(TO) modes for 6LN.
Lengyel et al. [73] observed 3A1(TO)+7E(TO) for Mg-doped LN (Mg:LN) crystals with
stoichiometric, intermediate and congruent compositions. Ridah et al. [74] observed
4A1(TO)+9E(TO) modes for LN with different compositions. Zhang et al. [75] observed
4A1(TO)+8E(TO) for Er:LN, and 4A1(TO)+9E(TO) for Er:Ti:LN. Zhang et al. [76] observed
4A1(TO)+9E(TO) for Zn:LN.
We observed 4A1(TO)+7E(TO) modes for both C7LN and NS7LN, as listed in Table
2.1 along with those of the aforementioned references, and all the peaks observed were
decomposed using Gaussian-Lorentzian functions and a homemade pc-based program. The
C7LN are broader than those of NS7LN, reflecting the effect of Li vacancy content. Recently,
Shi et al. [77] used the Raman spectroscopy technique to investigate lithium tantalite
(LiTaO3) crystals with different compositions. By comparing the data obtained for the
congruent and near-stoichiometric crystals, they observed differences in the shape and the
number of Raman peaks. They also observed that the mode linewidth (Γ) continually
decreases with increasing Li content. There exist many defects due to the Li vacancy and
anti-site Ta ion for congruent LiTaO3 crystal. When the ratio Li/Ta increases, the number of
intrinsic defect decreases.
To obtain the number of Li vacancy (VLi) we employ the model proposed by Iyi et al.
[9], where the formula for LN is given by [Li1-5xNbx (VLi)4x] NbO3. According to Ref.[71], Γ
can be used to estimate the crystal composition. By considering the unambiguously identified
E(TO) mode at around 156 cm-1, the Li concentration (cLi) can be obtained from the following
equation [71]
cLi = 53.03-0.4739Γ (4)
Table 2.1. Frequency (cm-1) and linewidth, Γ(cm-1), in parenthesis, of the Raman-active modes for C7LN and NS7LN crystals.
E(TO) A1(TO)
C7LN 156 … 240 268 326 373 436 581 … 255 279 335 635 Present work
(12) … (13) (27) (16) (26) (14) (26) … (33) (13) (10) (33)
NS7LN 157 … 242 267 325 372 436 583 … 258 280 337 637 Present work
(7) … (7) (18) (10) (16) (10) (17) … (17) (11) (8) (20)
LN 152 … 239 266 321 369 430 580 … … … Ref.[72]
7
LN 155 180 238 265 325 371 431 582 610 255 276 334 633 Ref.[14]
6
LN 155 180 238 … 333 388 431 581 610 257 294 364 630 Ref.[14]
LN 153 177 238 264 322 370 432 580 610 … … … … Ref.[74]
Er:LN 151 … 237 262 322 366 431 579 630 250 272 328 631 Ref.[75]
Er:Ti:LN 152 182 238 263 322 369 431 580 629 253 275 333 633 Ref.[75]
From the data listed in Table 2.1, we have cLi (C7LN) = 47.34% and cLi (NS7LN) =
49.72%, which are in good agreement with the results determined by UV absorption edge
method. Using the results for cLi (C7LN) and cLi (NS7LN), the chemical formula for C7LN
and NS7LN reads: [Li0.91Nb0.02(VLi)0.07]NbO3 and [Li0.99Nb0.002(VLi)0.008]NbO3, respectively.
We observe that VLi(C7LN) is greater than VLi(NS7LN), accounting for the broader modes
observed in the Raman spectra of C7LN.
2.3.3 The thermal properties measurements
(1) DTA/TG curves
The DTA/TG curves of C7LN and NS7LN single crystals are shown in Figs. 2.6 (a)
and (b), respectively. The sharp peak appearing in the DTA curve indicates that the melting
point of as-grown C7LN and NS7LN crystal is 1218 oC and 1223 oC, respectively. The TG
curves indicate that the as-grown crystals are stable over the room temperature to 1300 oC
with no mass variation.
200 400 600 800 1000 1200
-30 -25 -20 -15 -10 -5 0 5 0 2 4 6 8 10
12230C
H e a tf lo w ( m W )
Temperature (0C)
DTA
TG
12180C
(2) The specific heat measurements
The specific heat (Cp) is an important thermal parameter, which reflects the thermal
stability and affects the crystal damage threshold [78]. The specific heat value of as-grown
C7LN as well as NS7LN is plotted in Figs 2.7, and the measurements reveal that Cp varies
slightly in the temperature range 300-550 K, at 300 K, we have Cp(C7LN)= 0.5995 Jg-1K-1
and Cp(NS7LN)= 0.7280 Jg-1K-1.
300 350 400 450 500 550
0.3 0.4 0.5 0.6 0.7 0.8 0.9 1.0 1.1
C7LN
Sp
e
c
if
ic
H
e
a
t
(J
/g
k
)
Temperature(k)
NS7LN
Figure 2.7. The specific heats of C7LN (solid) and NS7LN (dashed) crystals
(3) The thermal expansion measurements
The thermal expansion coefficient is also an important thermal parameters that
influences the fracture of crystal material. Figures 2.8 (a) and (b) show the temperature
dependent behavior of the thermal expansion and thermal expansion coefficients (
α
a andα
c)for C7LN (solid line) and NS7LN (dashed line) crystals, respectively. The average thermal
expansion coefficients are
α
a =13.2 ×10⁻⁶ K-1 andα
c =1.8 ×10⁻⁶ K-1 for C7LN andα
a = 13.50 2 4 6 8
300 400 500 600 700
0 4 8 12 16 a c T h e rm a l E x p a n s io n C o e f (1 0
-6 K -1 ) (a) c a (b) T h e rm a l E x p a n s io n (1 0 -2 ) Temperature (K)
Figure 2.8.(a) Thermal expansion and (b) thermal expansion coefficients of C7LN (solid) and NS7LN (dashed) crystals
(4) The thermal diffusion and thermal conductivity
Figure 2.9 (a) shows the behavior of the thermal diffusion coefficients (λa and λc),
which is anisotropic and decreases with increasing temperature. At 300 K, λa = 0.84 mm2s-1
and λc = 1.1 mm2s-1 for C7LN and λa = 1.37 mm2s-1 and λc = 1.62 mm2s-1 for NS7LN.
The thermal conductivity, κ, can be calculated according to the equation
κ = λρCp (5)
where λ, ρ, Cp are the thermal diffusion coefficient, density, and specific heat, respectively.
are κa = 2.55 Wm-1K-1 and κc = 3.1 Wm-1K-1 for C7LN, and κa = 4.25 Wm-1K-1 and κc = 5.25
Wm-1K-1 for NS7LN, respectively.
All the thermal parameters of C7LN and NS7LN are listed in Table 2.2, where we also
list the data of natural CLN obtained from Ref. [79].
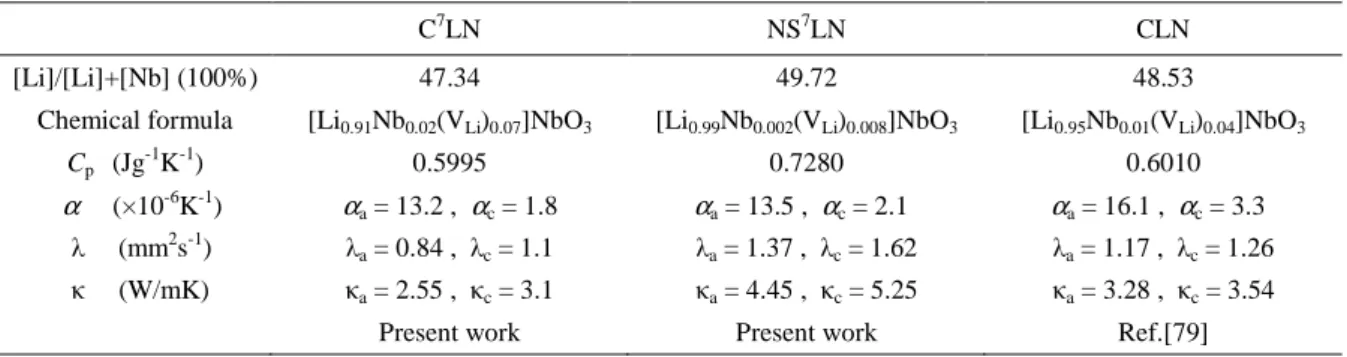
Table 2.2.Experimental results of C7LN, NS7LN and CLN crystals. Chemical formula is calculated based on Li vacancy model. ([Li1-5xNbx (VLi)4x]NbO3, where VLi means vacancy at Li-site). The values of specific heat (Cp),
thermal diffusion coefficients (λ) and thermal conductivity (κ) were determined at 300 K, the average thermal
expansion coeffients (α) are obtained between 298-773 K. Data for CLN were obtained from Ref.[79].
C7LN NS7LN CLN
[Li]/[Li]+[Nb] (100%) 47.34 49.72 48.53
Chemical formula [Li0.91Nb0.02(VLi)0.07]NbO3 [Li0.99Nb0.002(VLi)0.008]NbO3 [Li0.95Nb0.01(VLi)0.04]NbO3
Cp (Jg -1
K-1) 0.5995 0.7280 0.6010
α (×10-6K-1) αa = 13.2 , αc = 1.8 αa = 13.5 , αc = 2.1 αa = 16.1 , αc = 3.3
λ (mm2
s-1) λa = 0.84 , λc = 1.1 λa = 1.37 , λc = 1.62 λa = 1.17 , λc = 1.26
κ (W/mK) κa = 2.55 , κc = 3.1 κa = 4.45 , κc = 5.25 κa = 3.28 , κc = 3.54
0.6 0.8 1.0 1.2 1.4
300 350 400 450 500 550
2 3 4 5 6 c a a T h e rm a l D if fu s io n C o e f ( m m 2 s -1 ) c (a) (b) a a c c T h e rm a l C o n d u c ti v it y (W m -1 K -1 ) Temperature (K)
Figure 2.9.(a) Thermal diffusion coefficients and (b) thermal conductivity curves of C7LN (solid) and NS7LN (dashed) crystals
According to Ref.[80], κ can also be written as
κ = ρCpυL/3, (6)
where υ is the constant sound velocity, and L is phonon mean free path (MFP). Phonon
scattering in a solid consists of four processes involving collisions between phonons and (a)
phonons, (b) defects, (c) free electrons, and (d) boundaries of the system [80]. Since L (and κ)
decreases with increasing the number of defects, the collisions between phonons and defects
2.4
Conclusion
For future investigations on the defect structure of LN using neutron scattering
technique, we successfully grew C7LN and NS7LN crystal and carried out series of primary
measurements. The XRPD result showed the as-grown crystals of R3c LN phase structure, the
crystal theory and experimental densities were determined, the UV absorption edge method
and Raman mode method were used to determine the crystal contents, the DTA results gave
the crystal melting points and the TG results indicated that the crystal is stable over the room
temperature to the melting points, the crystals specific heats, thermal expansion, thermal
diffusion and thermal conductivity values were determined and calculated.
The Raman modes of C7LN are broader than those of NS7LN, reflecting the disorder
induced by the larger amount of Li vacancies on the R3c phase of C7LN. This disorder also
accounts for the lower values of the thermal parameters λ and κ of C7LN as compared to those
3
MIXED-VANADATE ((Nd,Yb):Y
x
Gd
1-x
(VO
4
) )
CRYSTALS
3.1
Introduction
Here we used Raman spectroscopy to investigate the extent of the modification of the
GdVO4 phonons due to the doping of the Gd site by Y, Yb, and Nd. We observed that the
wavenumber of most of the vibrations increases when Y replaces for Gd in the
(Nd,Yb):YxGd1-x(VO4) crystals, while it remains approximately constant when Yb replaces
for Gd in the Yb:Gd(VO4) crystal. Besides providing information about the disorder on the
zircon structure as x increases, the Raman spectroscopy yields information about the
maximum phonon energy, used in the analysis of loss mechanism of a given electronic
transition (lifetime). Finally, we tried to build up the one-phonon model to describe the
dependence of the wavenumbers on x.
3.2
Experimental procedure
3.2.1 Crystal growth
The crystals were grown by Jiyang Wang, Huaijin Zhang, et al. in the State Key
Laboratory of Crystal Materials of Shandong University (China).
Single crystals of (Nd,Yb):YxGd1-x(VO4) were prepared following the procedure as
described in Refs [81-83]. The crystals were grown by the Czochraski method in the DJL-400
pulling apparatus, the temperature control apparatus was a EUROTHERM2604
controller/programmer with a precision of ± 0.1 °C. The iridium crucible was heated using a 2
kHz intermediate frequency heater. The craw distance of the pulling apparatus was less than 1
µm.
(2) The synthesis of polycrystalline material
The starting materials for synthesis polycrystalline material were V2O5, Gd2O3, Y2O3,
Yb2O3 and Nd2O3 with 99.99% purity, which were grind, weighted according to the
appropriate molar proportion, and then the mixture were placed into a Pt crucible and heated
at 850 °C for 7 h. The obtained materials were grind and mixed again, and then pressed into
pellets, and heated at 1150 °C for 7-10 h, finally formed the mixed vanadate polycrystalline.
(3) Crystal growth
An a-axis Nd:GdVO4 crystal rod (3 mm × 3 mm × 20 mm) was used as seed. The
crystals were finally grown in an atmosphere N2+O2 (O2 2% by volume). During the growing,
the pulling rate ranged from 0.5 to 1 mm/h and the rotation rate varied at 10-30 rpm. After the
crystal reached the ideal diameter, it was cooled down to room temperature at a rate of 60-80
°C/h.
3.2.2 Characterizations
(1) X-ray fluorescence (XRF)
The concentrations of Nd3+, Gd3+, Y3+, and Yb3+ ions were measured by the X-ray
fluorescence (XRF) analysis method using a X-ray Fluorescence Spectrometer (Japan, model:
S/max3080E2).
The crystal structures were measured using a X-ray powder diffractometer (XRPD)
(Bruker, model: Smart PPEX II) with Cu Kα1 line (λ = 1.5406 ×10⁻¹⁰ m). The unit cell
parameters were calculated using LeBail method and TOPASS program.
(3) Raman spectra
We used the same setup described in Chapter 2. Scattering geometries for the spectra
listed in the text, tables and figures follow the usual Porto’s notation [80]. The typical crystal
selected for the Raman study consisted of a parallelepiped, whose average dimensions were 6
x 6 x 2 mm3.
3.3
Results and discussion
3.3.1Crystal compositions and structure
(1) The crystal contents
The three families of rare-earth vanadates investigated, namely: (i) yNd:YxGd1-x(VO4),
(ii) yYb:Gd(VO4) and (iii) yYb:YxGd1-x(VO4) are listed in Table 3.1.
Table 3.1.Chemical formula for y(Nd,Yb):YxGd1-x(VO4) crystals
yNd:YxGd1-xVO4 yNd:GdVO4 yYb:YxGd1-xVO4
Nd(0.5 at.%):Y0.17Gd0.83VO4 Yb(0.8 at.%):GdVO4 Yb(0.48 at.%):Y0.30Gd0.70VO4
Nd(0.5 at.%):Y0.37Gd0.63VO4 Yb(1.5 at.%):GdVO4 Yb(0.71 at.%):Y0.41Gd0.59VO4
Nd(0.5 at.%):Y0.53Gd0.47VO4 Yb(2.0 at.%):GdVO4 Yb(0.92 at.%):Y0.58Gd0.42VO4
Nd(0.5 at.%):Y0.63Gd0.37VO4 Yb(2.5 at.%):GdVO4 Yb(1.18 at.%):Y0.74Gd0.26VO4
Nd(0.5 at.%):Y0.70Gd0.30VO4 Yb(3.5 at.%):GdVO4 Yb(1.35 at.%):Y0.87Gd0.13VO4
Nd(0.5 at.%):Y0.81Gd0.19VO4
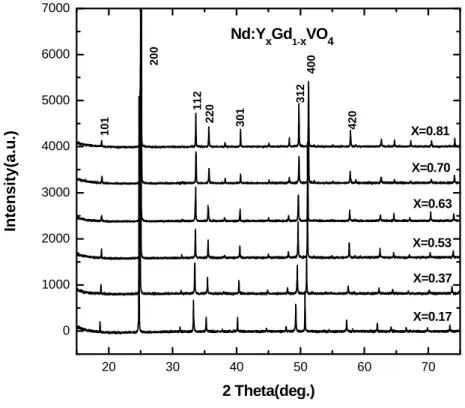
(2) XRPD
results, we observed that all as-grown (Nd,Yb):YxGd1-x(VO4) crystals possess the tetragonal
(zircon-type) structure belonging to the D space group. 194h
20 30 40 50 60 70
0 1000 2000 3000 4000 5000 6000 7000 4 2 0 4 0 0 3 1 2 3 0 1 2 2 0 1 1 2 X=0.81 X=0.70 X=0.63 X=0.53 X=0.37 In te n s it y (a .u .) 2 Theta(deg.) Nd:Y
xGd1-xVO4
X=0.17 1 0 1 2 0 0
Figure 3.1. The XRPD result of yNd:YxGd1-x(VO4) crystals
(3) Crystal structure
Kolitsch and Holstam [85], showed that the REVO4 (RE = Nd, Yb, Y, and Gd) are
isostructural, exhibiting a tetragonal (zircon-type) structure belonging to D space group 194h
with four molecules per unit cell (Z = 4), where RE and VO4 occupy D2d crystallographic
sites. In Ref. [86], Isasi et al. showed that in the mixed YxGd1-x(VO4), the rare-earths Y and
Gd share the same D2d crystallographic site, and the unit cell structure of REVO4 family
0.1 0.2 0.3 0.4 0.5 0.6 0.7 0.8 0.9 0.320 0.322 0.324 0.326 0.328 0.330 x U n it -c e ll v o lu m e ( n m 3 ) (b) 0.628 0.630 0.632 0.634 0.712 0.716 0.720 0.724 a-axis length c-axis length L a tt ic e p a ra m e te rs ( n m ) (a)
Figure 3.2. The unit cell parameters of yNd:YxGd1-x(VO4) crystals varying on the crytal contents
3.3.2 Raman spectrum
By considering that the zircon structure is composed of two sublattices of RE3+ (or
RE’/RE”) ions and VO43- ‘‘molecules’’, and using the group theory analysis the Raman-active
modes can be decomposed in terms of the irreducible representations of the D4h point group as
Γ = A1g(
ν
1 ,ν
2)+B1g(2T,ν
3 ,ν
4)+B2g(ν
2)+Eg(2T,R,ν
3 ,ν
4), whereν
i (i = 1,…,4) correspond to theinternal modes of the VO4 tetrahedron, and T/R corresponds, respectively, to the translational
(T) or rotational (R) motion involving both the RE and VO4 ions.
(1) Nd:YxGd1-x(VO4) crystals
Figures 3.4 (a)-(d) show the room temperature Raman spectra of Nd:YxGd1-x(VO4) for
(zz), (xx), (zx) and (xy) polarizations, respectively. These polarizations yield the Raman
modes of A1g, A1g+B1g, Eg, and B2g symmetry, respectively. All the peaks observed were
decomposed using Gaussian-Lorentzian functions and a homemade pc-based program.
For x = 0.0, Fig. 3.4 (a) shows the two A1g modes predicted by the group theory
analysis. They correspond to the symmetric bending (
ν
2) at 379 cm-1 and the symmetricstretching (
ν
1) at 885 cm-1.It should be noted that the A1g(
ν
2) vibration mode exhibits an inhomogeneous splitting(∆∼11 cm-1) similar to those observed in Ref. [87] for Nd:GdVO4. This splitting has been
observed even for pure GdVO4 [88]. Let A and B be the low- and high-frequency components
of the A1g (
ν
2) doublet with integrated intensities IA and IB, respectively. As x increases, ∆ andIB/IA decrease. In Ref. [88] the splitting of the A1g(
ν
2) mode over a wide temperature range14-800 K was investigated. The splitting observed was associated with the thermally activated
νννν2
Nd:Y
xGd1-xVO4
(a) A 1g(ZZ) νννν1 x=0 x=0.17 x=0.53 x=0.81 T T νννν4 νννν2 (b) A
1g+B1g(XX)
νννν3 νννν1
x=0 x=0.17 x=0.53 x=0.81 E g(ZX) νννν4 T/R T/R * * * * In te n s it y ( a rb .u n it s ) (c) νννν3
* x=0 *
x=0.17 x=0.53 x=0.81
100 200 300 400 500 600 700
νννν2
* * *
Raman shift (cm-1)
(d)
800 850 900
B 2g(XY) * * * x=0 x=0.17 x=0.53 x=0.81
Figure 3.4.Room temperature polarized Raman spectra of Nd:YxGd1-xVO4 (x = 0.0, 0.17, 0.53, and 0.81),
recorded in different polarizations: (a) (zz), (b) (xx), (c) (zx) and (d) (xy)
Similar splitting was observed for TbVO4 when P replaces for V [89]. For pure
TbVO4 the structure has an exact translational symmetry and no splitting of the A1g(
ν
2) isobserved, indicating that the VO4 tetrahedral are well oriented. However, for mixed Tb(V
1-xPx)O4 crystals the local structure could a priori differ from the average tetragonal structure
due to the random distribution of VO4 and PO4 groups in the D2d sites. So, while the Tb
sublattice retains to a good approximation, its translational symmetry, the (V, P)O4 sublattice
does not. In either case, the disorder in the distribution of VO4 tetrahedral leads to the
appearance of the A1g(
ν
2) doublet observed for some rare-earth orthovanadates.Figure 3.4 (b) shows, in addition to the A1g modes, the four B1g modes expected. We
assign the asymmetric stretching (
ν
3) mode at 810 cm-1 and the asymmetric bending (ν
4) at485 cm-1. The modes at 125 and 263 cm−1 are related to T-like vibrations. Of the five expected
Eg modes, we observe (Fig. 3.4 (c)) four modes at 156, 247, 443, and 826 cm−1. The modes at
443 and 826 cm−1 are assigned as
ν
4 andν
3 vibrations, respectively. The remaining twomodes at 156 and 247 cm−1 are likely to involve R- and/or T-like motions of the atoms. In Fig.
3.4 (d) we observe an intense vibration at 263 cm−1 corresponding to the
ν
2 mode with B2gsymmetry. We recall that, according to Ref. [90], the modes R(Eg), T(B1g), and
ν
2(B2g) havesimilar wavenumbers. The calculated ratio between the wavenumbers corresponding to the
ν
2(B2g) and T(B1g) modes is 1.03, while from our measurements we have 1.0. The asterisksindicate leakage from other polarizations, since the REVO4 compounds are known to exhibit a
relatively large birefringence (> 0.2).
The wavenumbers observed for x = 0.0 agree with those reported in Refs. [38] and
[88] for GdVO4. The Raman results indicate that the phonon spectra of Nd:GdVO4 exhibits a
relatively small alteration, suggesting that the GdVO4 lattice is largely insensitive to Nd
wavenumbers of the internal VO4 modes increases by 1.7% on average [45], while the
observed shift for Nd0.005:GdVO4 is 0.15%.
The wavenumbers observed are listed in Table 3.2, where we also list the
wavenumbers of Nd:YVO4 [87], which are similar to those of YVO4 [88, 91].
Table 3.2.Wavenumbers (cm-1) and symmetry assignment of y(Nd,Yb):YxGd1-xVO4
Internal modes External modes
Crystal Content A1g Eg B1g B1g Eg A1g B2g B1g Eg Eg B1g (ν1) (ν3) (ν3) (ν4) (ν4) (ν2) (ν2)
N
d
:Y
x
G
d1-x
V
O4
x = 0.00 885 826 810 485 ... 379 263 263 247 156 125
x = 0.17 888 830 813 487 ... 382 265 263 251 160 131
x = 0.37 890 833 815 489 ... 383 265 264 254 162 138
x = 0.53 892 836 816 490 ... 383 265 265 256 164 145
x = 0.63 892 837 817 491 ... 383 265 265 258 165 148 x = 0.70 893 838 817 492 ... 382 265 265 259 165 150
x = 0.81 894 840 818 492 ... 383 265 266 262 166 154
x = 1.00 894 842 819 493 ... 383 264 264 264 167 161
yY b :G d V O4
y = 0.8 at.% 885 826 810 485 443 379 263 263 247 156 125
y = 1.5 at.% 886 826 811 485 443 379 263 263 247 157 125
y = 2.0 at.% 886 826 811 485 444 380 263 263 247 157 124
y = 2.5 at.% 886 827 811 485 444 380 263 263 247 157 124
y = 3.5 at.% 886 827 811 485 444 380 263 263 248 157 124
yY
b
:Y
x
G
d1-x
V
O4
y = 0.48 at.%
x = 0.30 889 832 814 488 ... 382 264 264 253 160 135
y = 0.71at.%
x = 0.41 890 834 814 489 ... 382 264 264 254 161 140
y = 0.92 at.%
x = 0.58 891 836 816 490 ... 383 264 264 257 163 146
y = 1.18 at.%
x = 0.74 892 838 816 491 ... 382 264 264 259 165 151
y = 1.35 at.%
x = 0.87 892 839 817 491 ... 382 263 263 261 166 155
The observed wavenumbers for the compounds as a function of doping content are
plotted in Figs 3.5 (a), when x goes from 0 to 1, most of these modes shift towards higher
wavenumbers. The wavenumber of the internal
ν
1(A1g),ν
3(Eg),ν
3(B1g),ν
4(B1g), andν
2(A1g)modes, and external Eg (156 and 247 cm-1) and B1g (125 cm-1) modes increase, while that of
the external B1g (263 cm-1) mode remains practically constant.
0.0 0.2 0.4 0.6 0.8 1.0 0.0 0.2 0.4 0.6 0.8 1.0
100 150 200 250 300 350 400 450 500 800 850 900
0.5 1.0 1.5 2.0 2.5 3.0 3.5
(c) Yb:YxGd1-xVO4
(a) Nd:YxGd1-xVO4
R a m a n f re q u e n c y ( c m -1 ) B1g Eg Eg
B2g(νννν2)/B1g
A1g(νννν2)
Eg(νννν4)
B1g(νννν4)
B1g(νννν3)
Eg(νννν3)
(b) yYb:GdVO4
A1g(νννν1)
Figure 3.5.Observed wavenumbers for the compounds as a function of doping content
The hardening of the internal mode wavenumbers was first explained as resulting from
the RE contraction, which would lead to a closer packing of the (PO4)3- units as one proceeds
from monazite-type LaPO4 to zircon-type LuPO4 and a shortening of the P-O distances to
yield higher wavenumbers [92]. However, crystallographic studies of the REPO4 series
performed by Beall et al. [93], Mullica et al. [94-96], and Ni et al. [97] have shown that the