The Impact of the Social Class on the Development
of Money Knowledge
Rita Isabel Pomar Piçarra #779
A Project carried out on the Field Lab in Marketing, under the supervision of:
Professor Luísa Agante
2 Abstract
Purpose – The present study aims to understand if young consumers’ knowledge about money, covering price evaluations, opinions towards savings, allowances attribution and price-quantity judgments, is influenced by the social class, age and gender of the child.
Methodology– 249 children and parents from the 3rd and 6th grades from public and private schools participated in this study. Questionnaires were used as the main research tool.
Findings – We concluded that children from higher social classes experience fewer co-shopping activities with their parents. Concerning money knowledge, age has an impact on the accuracy of price evaluations, with older children being more precise. Moreover, it was found that as children grow, the attribution of allowances becomes more frequent, and in terms of savings, girls were shown to be more concerned. Regarding price-quantity evaluations, and as expected, older children took more time to make a purchase decision.
Research Limitations – The main limitation of this research was the narrow range of ages, and the geographic concentration of the sample in Portugal, namely Lisbon and surrounding areas.
Practical Implications –As children represent an easy target to many companies, they are constantly being blitzed through advertisements and appealing product packages. This study aims to explore what factors are responsible for the development of children’s ability to evaluate the value of goods and to make price/quantity judgments.
Value– This research deepens the knowledge about young consumers, their buying skills, and what influences their development. It is essential to enable educators and parents to support children in the development of their choice-making and buying abilities.
3
Table of Contents
1. Introduction ...4
2. Literature Review and Hypothesis Formulation ...4
2.1. Consumer Socialization of Children ...4
2.2. Gender ...5
2.1. Social Class ...5
2.2. The Role of Parents ...6
2.3. Money and Price Knowledge ...7
2.4. Price-Quantity Evaluation ...10
3. Methodology ...10
3.1. Legal and Ethical Issues ...10
3.2. Sample ...11
3.3. Measures and Procedures ...11
3.4. Pre-test ...16
4. Results ...17
4.1. Sample Composition ...17
4.2. Hypothesis Testing ...17
5. Discussion and Conclusions ...23
6. Limitations and Future Research ...26
7. References ...28
4
1.
Introduction
Children represent the future consumers, a vital market segment that is crucial to consider since they have become increasingly important in terms of absolute size, spending power, and purchase influence(McNeal, 1987).
Social class is an important factor in consumer socialization that might affect decision patterns. Making effective decisions requires having the necessary skills to make judgments about different aspects of consumerism (Gunter and Furnham, 1998). The term shopping skills refers to a wide collection of aptitudes used for comparing product value prior to purchase (John, 1999), that can start from the perception that prices are present in the marketplace to the ability of making price-quantity and price-quality evaluations. Thus, the purpose of this study is to analyze the impact of the social class on children’s development of money knowledge, comprising Portuguese children from 8 to 13 years old.
2.
Literature Review and Hypothesis Formulation
2.1.
Consumer Socialization of Children
5 becoming familiar with concepts such as advertising, price, product categories and brands, while from the social perspective, they are able to consider new perspectives that go beyond their own feelings and motives.
2.2.
Gender
According to Meyers-Levy and Sternthal (1991), gender is frequently used to implement segmentation strategies, due to the fact that gender segments are easily identifiable, accessible and large enough to be profitable. There are gender specific characteristics that children express at an early age, such as aggression for boys and nurturance for girls, (McNeal, 2007). Holdbrook (1986) suggests that gender may be a key variable in moderating consumer’s evaluative judgments, and according to Acuff (1999), considering
what each child asks for and prefers, there are strong gender differences in the favorite play activities, character identification, settings, and contexts. Thus, we consider gender as a key variable for this research.
2.1.
Social Class
In accordance with Gunter and Furnham (1998), social class is an important factor in consumer socialization and may affect decision-making patterns. Children from different social classes have different amounts of consumption experience (Belk et al., 1984) that could influence the development of their consumer skills.
6 Riesman, Glazer and Denney (1953) speculated that in the more wealthy families, children acquire some understanding of the purchasing processes at a relatively early age. Other research outcomes aligned with this, indicating that young people from upper socio-economic backgrounds have greater awareness of, and preference for, commercial stimuli in their consumer environment (Moschis and Churchill, 1978; Moore and Moschis, 1978; Ward, 1974).
Contrarily, according to Gunter and Furnham (1998), notwithstanding that upper-social class parents have higher disposable incomes than medium-low class parents, the latter usually give their children greater and earlier exposure to consumption experiences. Consequently, this research aims to analyze the impact of the social class on the development of certain consumer skills that could allow the improvement of money knowledge.
2.2.
The Role of Parents
The development of consumer skills is a process formed by a number of sociocultural forces including parents, peers, school, shopping experiences and the mass media (Carlson and Grossbart, 1988; Peracchio, 1992).
Parents could be seen as children’s primary socialization agents who present and instruct them into the consumer role (McNeal, 1992). Much literature has suggested that children’s learning or acquisition of important social behaviours can be simplified by providing them with repeated opportunities to exhibit such behaviors, along with instruction and feedback about their performance (Becker, 1971; Patterson, 1968).
7 in the development of children’s consumer behavior patterns: (1) Accompanying Parents and Observing, (2) Accompanying Parents and Requesting, (3) Accompanying Parents and Selecting with Permission, (4) Accompanying Parents and Making Independent Purchases and finally (5) Going to the Store Alone and Making Independent Purchases.
Taking in consideration the socioeconomic background of the parents, it is expected that children from lower social classes are exposed earlier to the marketplace and that parents from lower social classes have more co-shopping experiences with their children. Moreover, it is also expected that parents from lower social classes are highly involved on their children shopping experiences.
H1: Children from lower social classes are exposed earlier to the marketplace than
children from upper social classes.
H2: Parents from lower social classes have more co-shopping experiences with their
children than parents from higher social classes.
H3: Parents from lower social classes are more involved in their children’s shopping
experiences than parents from higher social classes.
2.3.
Money and Price Knowledge
According to McNeal (2007), children’s first contact with money often occurs around age three. Near age five, when children start to understand the purpose of money, they usually have a substantial amount accumulated. However, although children may use money themselves, that does not mean that they fully understand its meaning and significance, (Furnham, 1998).
8 look for price information and know that there are price variations among products and stores (McNeal and McDaniel 1981). Only later do children start to associate prices to the value that a product represents (John, 1999).
Between ages 7 to 11, children present relatively undeveloped notions concerning valuation of goods and services (Ward et al., 1977). According to Piaget (1966), it is only around 7 to 11 years old that children develop the notion of seriation that consists in the arrangement of elements according to increasing or decreasing size and is needed to make price and product comparisons. With the notion of seriation, children are able to compare pairs of elements and establish a gradual order between them, with consideration to more than one attribute.
According to Solomon (2006), observational learning occurs when people watch the actions of others and note the reinforcements they receive for their behaviours. People store these observations in memory as they accumulate knowledge, and this information at a later point could guide their own behaviours. Hence, taking into account that children from lower social classes usually observe the financial restrictions of their parents and the price-quality and price-quantity judgments they make in shopping situations, it is expected that those children will have a better awareness of the value of goods than children from higher social classes.
H4: Children from lower social classes evaluate more precisely the value of goods than
children from higher social classes.
H4a: Girls evaluate more precisely the value of goods than boys.
H4b: Older children evaluate more precisely the value of goods, than younger children.
Marshall and Magruder (1960) suggested that children’s knowledge of money was directly
9 study developed by Abramovitch, Freedman and Pliner (1991), children from 6 to 10 years old who were given allowances seemed more sophisticated about money than those who were not.
Consequently, with parents being such an important agent in children’s development of consumer skills, we expect that children will have more knowledge of money if their parents give them an allowance. Additionally, it is expected that there are more children from higher social classes receiving allowances than children from lower social classes.
H5: Children who are given an allowance have more knowledge of money use.
H6. There are more children from higher social classes receiving allowances than children
from lower social classes.
H6a: There are more girls receiving allowances than boys.
H6b: There are more older children receiving allowances than younger children.
Parents are often very eager to encourage their children to save. According to Sonuga-Barke and Webley (1993), children’s behaviour and understanding of savings, along with all economic behaviour, are constructed within the social group and are shaped by particular individuals with the support of the socio-economic background where they are inserted. Thus, as families from lower social classes have to manage fewer resources, we expect that children from lower social classes have a more positive opinion towards savings.
H7: Children from lower social classes have more positive opinions towards savings than
children from upper social classes.
H7a: Girls have more positive opinions towards savings than boys.
10
2.4.
Price-Quantity Evaluation
As children grow, they become more informed consumers using the information they have gathered to evaluate and compare product offerings (John, 1999). Furthermore, with increasing age, kids are more successful in comparing brands on dimensions such as price and quality (Turner and Brandt, 1978).
Ward and Wackman (1972) showed that one of the parents’ general consumer goals
consisted of teaching their kids about price-quality and price-quantity relationships. These findings suggest that parents may encourage their children to use price, quality, and quantity as criteria in evaluating products (Gunter & Furnham, 1998). As children from lower social classes have fewer opportunities for consumption and fewer resources, it is expected that they will take more time to make price-quantity decisions than children from upper social classes.
H8: Children from low-income families take more time to make price/quantity comparisons
than children from high-income families.
H8a Girls take more time to make price/quantity comparisons than boys.
H8b: Older children take more time to make price/quantity comparisons than younger
children.
3.
Methodology
3.1.
Legal and Ethical Issues
11 to Portuguese Education Ministry, to the schools, and to children’s parents. Children were informed that despite their parents’ authorization they were free to decide if they want to participate in the study or not (MacNaughton et al., 2001). It was mentioned that there were no right or wrong answers to encourage all the respondents to be as honest as possible.
3.2.
Sample
The population under study comprised Portuguese children from 8 to 13 years old. This age group was selected since it represents the phase where most important changes occur in the process of consumer socialization, as supported by John’s analytical stage (John, 1999). Children in this stage are capable of recognizing concepts such as price, products, brands, and to make decisions based on more than one attribute (John, 1999).
In order to test the development of money knowledge, we considered the socio demographic variables gender, social class and age (we assessed both extremes of the age group and used 3rd and 6th graders), which are seen as crucial for the consumer socialization process, according to the model developed by Moschis and Churchil (1978). Therefore, the minimum requirements for our sample, considering 30 students per each sub-group, were to have a total sample of 240 children and respective 240 parents.
3.3.
Measures and Procedures
12 Parents Questionnaire
The parents’ questionnaire gathered information on social class, children’s income and on child’s frequency of co-shopping experiences.
In order to determine the social class of the parents, it was used the table1 developed by Marktest2 (2006) that combines the professional occupation with the education level of the parents. We considered high social class levels A and B, and medium-low social class levels C1, C2 and D.
Education level of parents was assessed using the 10 levels from Marktest (2006), which are Without Studies; Completed Graded School; Some High School; 9th Grade; 10th/11th or 12th Grade; Professional/ Artistic Degree; Some College; Bachelor’s Degree; Masters or Post graduate Degree; PhD.
Professional occupation3 of the parents was measured through open questions that were codified afterwards according to the Marktest (2006) guidelines, which requires asking respondents to include a clear description of the job. We also asked through a multiple choice question the professional situation of each parent, using the Marktest scale: Employer; Self-employed; Employee; Working with family/No remuneration; other situation.
A final question asked which family member contributed most to the household income through a dichotomous question with the options “Mother” and “Father”.
Concerning children’s income four questions were presented. The three first questions comprised the same scales used in the study developed by Agante (2010). The first aimed to
1
http://www.marktest.com/wap/a/glossary/key~ClasseSoc/define~1.aspx
2
Marktest is a member of Marktest Group and is one of the leading market research companies in Portugal operating since 1980.
3
13 understand if children receive money from their parents and its periodicity; it was a multiple choice with the alternatives: “No”, “Yes, but not regularly”,“Yes, monthly”, “Yes, weekly” and “Yes, daily”. The second question was directed to obtain the children’s monthly income
through a multiple choice with the options: “Less than 5€ per month”, “Between 5 and 9,9€”, “Between 10 and 14,9€”, Between 15 and 19,9€” and “more than 20€”. The third question meant to explore for how long children were receiving allowances/pocket money through a multiple choice question with the following possible answers: “Less than 1 year”, “1 year ago”, “2 years ago”, “3 years ago” and “For over 3 years”. The fourth question, was a 5 point Likert-scale from “Completely Disagree” to “Completely Agree”, and meant to explore the parent’s opinion towards savings and allowances. The expressions were adapted from a study developed by Furnham (1999), and were the subsequent: “I believe that children should be encouraged to save part of the received money”, “Monetary prizes
should incentive children’s scholar success”, “Weekly allowances are the more effective method for children under 13 years old”; “Monthly allowances are the more effective method for children over 13 years old”, “The allowances should be given always on the same day”.
Regarding the frequency of shopping experiences we presented a question with a 5 point Likert-scale developed by Grossbart, Carlson and Walsh (1991), the expressions presented were: “When I go shopping for household goods such as grocery stores, cleaners, etc, I take
my child with me”, “When I go shopping for other family products, I take my child with me” and “When I go shopping for products for my son I take him with me”. Finally a multiple choice question was presented with a scale from “0” to “more than 6” in order to explore the age that the child had when visited the marketplace for the first time.
14 The children’s questionnaire gathered information concerning their money knowledge and
shopping experiences.
About shopping experiences three questions were presented. The first one was a dichotomous question adapted from the Furnham (1999) study to determine if children had spent money in determined items during the last month, the presented items comprised: sweets, magazines, books, clothing or shoes, movie tickets, gifts for someone, breakfasts at school, and gaming machines. The second question had the intent to explore children’s training as a consumer; It was used an Agante (2010) scale that was an adaptation from a question developed and studied by McNeal (1965), the expressions presented were: “My parents incentive me to shopping alone”, “My parents ask me to do some shopping for home alone”, “When I go shopping with my parents they ask my opinion”, “When I go shopping with my parents I like to give my opinion”, “Even when I don’t go shopping with my parents they ask my opinion” and “When my parents do not buy what I ask, normally
they give me an explanation”. All items were measured on a 4 point Likert-scale from “Never happens” to “Always happens” without the allocation of a central point in order to
capture positive or negative opinions (Derbaix and Pecheaux, 1997). The third question aimed to understand children’s attitudes towards the buying process, and it was also used an adaptation of Agante (2010) scale, measured on a 4 point Likert-scale from “Totally Disagree” to “Totally Agree”. The items where: “I like to do shopping”, “I like clean stores”; “I like crowded stores”, “I like big stores”, “Shopping is a women activity” with the addition of the item “Shopping is an activity for adults”.
15 allowances, work, gifts from parents and gifts from others. Thirdly it was presented a dichotomous question asking if children were used to saving money. Afterwards to realize why children save money, we applied a multiple choice question adapted from the Furnham (1999) study with the options: “My parents tell me to save money”, “My friends save money”, “To buy something special”, “For my holidays”, “For emergencies” and “Simply to have more money”. The fifth question intended to express children’s opinion towards savings. We developed a question with items adapted from the Furnham (1999) study comprising a 4 point Likert-scale from “Totally Disagree” to “Totally Agree”. The expressions were: “It is important to save money”, “Normally I spend the money as soon as I receive it”,“Money is for spend not for hold”,“I always try to save money”,“I don’t like to hold money” and “If I save money now, I will have more money when I get older”.
The last part of the questionnaire included two questions and was reserved to explore children’s ability to name and evaluate prices. A projective technique, specifically a
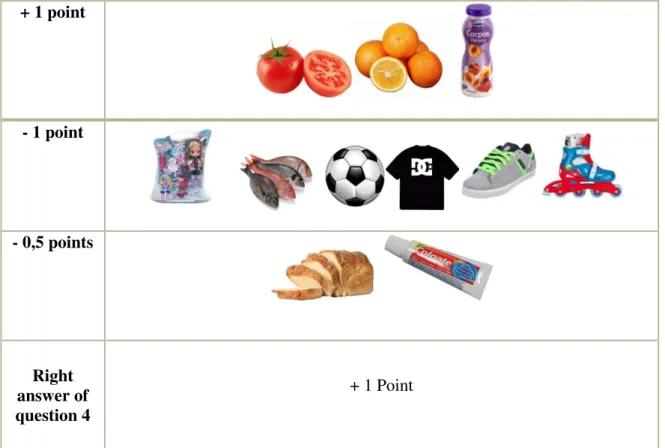
comparison technique, was applied through questions with images, as an adaptation of the study developed by Marshall and Magruder (1960). According to McNeal (2003), visual stimuli are more effective with children than verbal stimuli, therefore they provide significant information (Greig et al., 2007), since human thought is more image-based than word-based (Zaltman, 1997). The pictures represented food and non-food products, comprising some of the products with more references in the studies from McNeal (1989) and Agante (2008). The first question aimed to test if children were capable to identify, among a bundle of 12 products4, the ones that cost less than 1€, whereas the second question was directed to test children’s ability to name the price of 6 products. Pictures were presented along with a product description, and children were asked to select the correct price with 5 alternatives from 0€ to more than 11€.
4
16 Timed Task
After children completed the questionnaire, the researcher did an individual interview with each child. The interview aimed to measure the time children spend to make a purchase decision, in terms of price-quality evaluations, and was adapted from an experimental test conducted by Turner and Brandt (1978). Three cards5 with different packages of Ice Tea6 were shown to children. The packages had the respective price and quantity highlighted, and children were requested to identify and justify which product represented a better choice if they have to buy one. The task was timed by the researcher and children did not know that the task was being timed.
3.4.
Pre-test
A pre-test was conducted with 4 children from 8 and 11 years to understand if the questionnaire used appropriate language and if children were able to understand it. A clear conclusion was that children were confused if they were allowed to select more than one option on the question -“Why do you save?”. Thus, we added a description - “You can select more than one option.” Furthermore, in the question directed to test children’s ability to evaluate which products cost less than 1€, there was some confusion regarding the
picture of the fish. Thus, we changed the legend of the picture from “1 Fish” to “1 Kg of Fish”. These were the main changes made in order to obtain the final questionnaire.
5
See Appendix C.
6
17
4.
Results
4.1.
Sample Composition
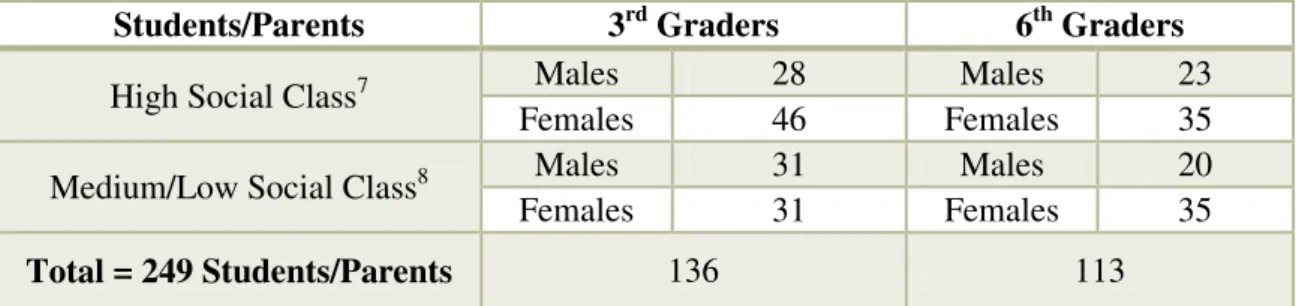
In total, 378 authorizations were delivered to 2 private schools in Lisbon, 2 public schools in Barreiro, and 1 public school in Odivelas, with a response rate of 65,9%. The composition of the final sample is described in table I. The sample in study was composed of 41% males and 59% females, of 54,6% 3rd graders and 45,4% 6th graders, and of 47% respondents from medium-low social classes vs. 53% from high social classes.
Students/Parents 3rd Graders 6th Graders
High Social Class7 Males 28 Males 23
Females 46 Females 35
Medium/Low Social Class8 Males 31 Males 20
Females 31 Females 35
Total = 249 Students/Parents 136 113
Table I: Sample composition
4.2.
Hypothesis Testing
The results for each hypothesis are presented and a summary of the correlation and association tests is presented on Appendix E. All tests were conducted for a significance level of 5% and using non-parametric tests considering the nature of the variables. For the association tests, we used the Pearson’s Chi-square test whenever possible, and analysed the Likelihood Ratio on all other cases.
Hypothesis 1: The first hypothesis meant to evaluate if there was a relationship between the social class and the age of the child at the first shopping experience. It was argued that children from lower social classes are exposed earlier to the marketplace than children from upper social classes. Descriptive statistics show that the average age that lower social
7
High Social Class: Marktest subclasses A and B
8
18 class children are exposed to the market place is 1,1 which is not significantly different from the higher social class children who are exposed at an average age of 1,12 (association test with a p-value of 0,505), meaning that there is no association between the social class of the parents and the age of the child when visiting for the first time the marketplace. Thus, H1 is rejected.
Hypothesis 2: The objective of the second hypothesis was to analyze if the variables social class and frequency of co-shopping experiences were related. It was argued that parents from lower social classes have more co-shopping experiences with their children than
parents from higher social classes. The used co-shopping scale was reliable (Cronbach’s
alpha = 0,856) but to test this hypothesis we created a new variable “frequency of co-shopping experiences”, ranging from 3 to 15, which joined the three situations of co-shopping experiences (groceries, family products, and child products)9. Descriptive statistics show that lower social class parents co-shop more frequently on average (mean = 12), than higher social class parents (mean = 10,17), being this difference statistically significant since the association test between “social class” and “frequency of co-shopping experiences” indicated that the Likelihood Ratio (χ2
=34,491, 11df) was higher than the critical value (χ2
=19,675, 11 df) meaning that there is an association between the two variables (p-value of 0,000). The correlation test using the Spearman Coefficient confirmed it to be significant (p<0,000) and with a negative and weak correlation (rs=-0,312), meaning that the lower the social class of the parent, the higher the frequency of co-shopping experiences. Therefore, H2 is not rejected.
Hypothesis 3: This hypothesis meant to evaluate if there was an association between the parents’ involvement in children’s shopping experiences and the social class. It was tested if
parents from lower social classes are more involved in their children’s shopping
9
19
experiences than parents from higher social classes. The scale presented a low level of
reliability (Cronbach’s alpha of 0,592), and therefore we created a new variable gathering the 5 quotes10 designed to measure parent’s involvement. Descriptive statistics show that lower social class children ranked parents involvement with 12,0311 on average, while higher social class children ranked it with 11,78. The chi-square test (p-value of 0,411) indicates that there is no association between the social class of the parents and their involvement on children’s shopping experiences. Subsequently, H3 is rejected.
Hypothesis 4: This hypothesis stated that children from lower social classes evaluate more precisely the value of goods than children from higher social classes. Descriptive statistics show that the average number of accurate answers of lower social class children was 4,23, while higher social class children was 4,45.We conducted an association test between the variables social class and number of accurate answers about products valuation12. The Pearson Chi-Square (χ2=7,445, 3 df) was lower than the critical value (χ2=7,815, 3 df), meaning that there is no association (p-value of 0,064) between the social class of the parents and the precision with which children predict the value of goods. Thus, H4 is rejected.
Hypothesis 4a: To test if girls evaluate more precisely the value of goods than boys, we analyzed the same variable regarding gender and descriptive statistics show that the average number of accurate answers of girls was 4,33, while of boys was 4,36. The association test between both variables confirmed this difference to be non-significant (p-value of 0,692). Consequently, H4a is rejected.
10
See question 1.2 of children questionnaire (excluding the 4th quote) on Appendix A.
11
The maximum value was 20.
12
20 Hypothesis 4b: In order to assess if older children evaluate more precisely the value of goods than younger children, we analyzed the same variable regarding age and descriptive
statistics show that younger children (8/9) scored 3,68 while older children (10-13) scored 5,13. We performed an association test between both variables. The Likelihood Ratio (χ2
=56,271, 15 df) was higher than the critical value (χ2=24,996, 15 df) which means that there is an association between the two variables (p-value of 0,000). The Pearson’s correlation Coefficient was significant (p<0,000) and showed a positive but weak correlation (rs=0,368), meaning that as children’s age increase, the number of correct answers also increases, resulting on the non-rejection of the H4b.
Hypothesis 5: In order to test if children who are given an allowance have more knowledge of money use, we conducted an association test between the variables “Do you give money to your child for their expenses?” and total points. Descriptive statistics show that children who received allowances scored 4,43 on average, while children who do not, scored 4,17. The Pearson Chi-Square (χ2=4,446, 3 df) was lower than the critical value (χ2
=7,815, 3 df), which means that there is no association between the two variables (p-value of 0,217). Thus, H5 is rejected.
21 Hypothesis 6a: To test if there are more girls receiving allowances than boys, we analyzed the same variable regarding gender and descriptive statistics show that there are 102 girls receiving allowances while only 66 boys. However, Pearson Chi-Square (χ2
=0,601, 1 df) was lower than the critical value (χ2=3,841, 1 df), meaning that there is no association between these two variables (p-value of 0,438). Hence, H6a is rejected.
Hypothesis 6b: In order to analyze if there are more older children receiving allowances than younger children, we analyzed the same variable regarding age and descriptive statistics show that there are 72 children from 3rd grade receiving allowances vs. 96 children from the 6th grade. The Likelihood Ratio (χ2=32,653, 5 df) was higher than the critical value (χ2
=11,070, 5 df), which means that there is an association between the two variables (p-value of 0,000). The Spearman Coefficient demonstrated that it was significant (p<0,000) and with a positive and weak correlation (rs=0,3), meaning that as children’s age increase,
the tendency for them to receive allowance also increases, resulting on the non-rejection of the H6b.
Hypothesis 7: This hypothesis stated that children from lower social classes have more positive opinions towards savings than children from upper social classes. We conducted
an association test between the variables social class and “opinion towards savings”. In the question 2.5 of the children’s questionnaire13
there were three positive quotes towards savings and three negative respectively. The scale of the three negative quotes was reversed. The scale presented a low level of reliability (Cronbach’s alpha of 0,563), and therefore we created a new variable that joined the 6 quotes - “opinion towards savings. The descriptive statistics show that children from lower social classes ranked their opinions with 21,73 on average, while children from higher social classes ranked it with 21,7614. A p-value of
13
See Appendix A.
14
22 0,469 indicates that there is no association between the two variables. Therefore, H7 is rejected.
Hypothesis 7a: In order to analyze if girls have more positive opinions towards savings than boys, we analyzed the same variable regarding gender and descriptive statistics show
that on average girls scored their opinion 22,1, while boys scored 21,2. The Likelihood Ratio (χ2=22,165, 11 df) was higher than the critical value (χ2
=19,675, 11 df), meaning that there is an association between the two variables. The Spearman Coefficient demonstrated that it was significant (p<0,046) and with a positive and weak correlation (rs=0,127), meaning that girls have more positive opinions towards savings, resulting in the non-rejection of the H7a.
Hypothesis 7b: In order to analyze if older children have more positive opinions towards savings than younger children, we analyzed the same variable regarding age, and
descriptive statistics show that on average younger children scored 22,2, while older children scored 21,2. The Likelihood Ratio (χ2=61,348, 55 df) was lower than the critical value (χ2
=73,311, 55 df), meaning that there is no association between the two variables. Therefore, H7b is rejected.
23 Hypothesis 8a: To test if girls take more time to make price/quantity comparisons, we analyzed the same variable regarding gender, and descriptive statistics show that girls took on average 16,87 seconds, while boys took 16,44 seconds. The Spearman correlation coefficient was not significant (p<0,842) meaning that there is no correlation between the two variables. Therefore, H8a is rejected.
Hypothesis 8b: With the objective to test if older children take more time to make price/quantity comparisons, we analyzed the same variable regarding age, and descriptive
statistics show that 3rd graders took on average 15,22 seconds, while 6th graders took 18,46seconds. The Pearson’s correlation Coefficient was significant (p<0,004) and showed a positive and weak correlation (rs=0,18), meaning that older children take more time making the price-quantity comparisons, and resulting on the non-rejection of H8a.
5.
Discussion and Conclusions
The research insights can be divided in three main sections: role of parents, money and price knowledge, and price-quantity evaluation.
Role of Parents:
24 can take care of their children in those moments, and therefore do not have to take their children with them to the marketplace.
Contrary to our expectations, there was not a relationship between the social class and the age of child on the first visit to the marketplace. One possible reason could be the low dispersion of the sample concerning the variable “age of the child first visit to the marketplace”, there was a concentration around the age 0 and 1.
Furthermore, we were expecting that the parents from lower social classes would have a stronger involvement in their children’s shopping experiences; however it was not possible to confirm that, as well. Perchance the parents do not see the marketplace experience as an educational environment but only as causality. Furthermore the scale was designed to measure the “involvement” and presented a low reliability that could have possibly distorted the results. It would be more appropriate to use a question designed to measure “intention to educate the child”, using a more reliable scale It has been more appropriate to use a scale designed to measure the “intention to educate the child”, and using a more reliable scale.
Money and Price Knowledge
25 Aligned with our expectations, age is related with the accuracy of price evaluation. As children grow, they start to be able to recognize how much a certain product costs. According to Piaget (1967), it is only around age 7 that children start developing the notions of seriation, a cognitive process which increases with age and experience.
In contrast to what we were expecting, experience with money did not have a noteworthy impact on the accuracy of price evaluation. This research shows that the fact that children receive allowances does not have an impact on the number of correct answers about price estimates. One possible reason is the narrow gap between ages (8/9 – 11/13) and the fact that a great part of the 8 year-old children started receiving allowances recently.
Concerning allowances, the results illustrate that its attribution was not related with social class or with the gender of the child. Once more, the only variable with significant impact was age. As children advance in age, the tendency for them to receive allowances increases. One possible reason for that is the education that parents want to give to their children. Parents want to increase children’s responsibility gradually and to promote the development of their management skills.
26 appearing to be more concerned about saving issues. Despite the weak correlation coefficient, this can be easily understood since girls are more mature than boys at that stage of socialization process.
Price-Quantity Evaluation
This section of the research provided us the insight that the time children took to make a price-quantity decision, when they hypothetically had to purchase one of the alternatives, was not significantly correlated with the social class or with gender. Age has shown to be positively correlated with time; older children took more time to make the price-quantity evaluation. It could be explained by the fact that older children have more mathematical knowledge, additionally the ratios were part of the subject they were learning when the study was applied, and children were driven to think and answer correctly, spending more time on the decision. Furthermore, we believe that it has been more appropriate to measure this variable with a real observation on the marketplace, at least with the surrounding stimuli that the market offers.
6.
Limitations and Future Research
There are some limitations in this study that should be taken in consideration to guide further research. The first limitation found is related with the sample. Although the sample was significant, it comprised only the 3 locations - Lisbon, Odivelas and Barreiro - that are in the same geographical area. Future research should include a higher number of participants and locations across the country. Moreover, the study only includes Portuguese children and could be more interesting if applied in other countries to compare conclusions.
28
7.
References
Acuff, D. (1997), “What Kids Buy and Why”, The Free Press
Bahn (1986), “When do Brand Perceptions and Preferences First Form? A cognitive Developmental Investigation”, Journal of Consumer Research, Vol. 13, No.3, pp. 382-393.
Barnard, J.D; Christophersen, E.R, and Wolf, M.M. (1977),“Teaching Children Appropriate Shopping Behaviour Through Parent Training In The Supermarket Setting”, Journal of Applied Behaviour Analysis, Vol. 10, No. 1, pp. 49 – 59.
Bettman, James R.; Sujan, Mita (1987) “Effects of Framing on Evaluation of Comparable and Non comparable Alternatives by Expert and Novice Consumers”, Journal of Consumer Research, Vol. 14, No. 2, pp. 141 – 154.
Darley, W. and R. & Smith (1995), “Gender differences in information processing strategies: An empirical test of the selectivity model in advertising response.” Journal of Advertising, Vol. 24 No.1, pp. 41–56.
Del Vecchio, G. (1997), “Creating Ever-Cool: A Markter’s Guide to a Kid’s Heart”, Pelican Publishing
Feldman, R. S.(2007), “Development Across the Life Span”, 5th ed., Prentice Hall
Furnham, A. (2008), “The Economic Socialisation of Young People”, Social Affairs Unit. Furnham, A. (1999), “The saving and spending habits of young people”, Journal of
Economic Psychology 20, 677-697
Furnham, A. (2001), “Parental Attitudes to Pocket money/Allowances for Children”, Journal of Economic Psychology 22, 397-422
Greig, A., J. Taylor and T. McKay (2007), “Doing Research With Children”, 2nd edition, Sage Publications
29 John, D.R. and Sujan, M.(1987), “Ages Differences in Product Categorization”, Journal
of Consumer Research, Vol. 16, No. 4, pp. 452 – 460.
John, D.R., Achenreiner, G.B. (2003), “The Meaning of Brand Names to Children: A Developmental Investigation”, Journal of Consumer Psychology, 13(3), pp.205 – 219.
John, D. R. (1999), “Consumer Socialization of Children: A Retrospective Look at Twenty-Five Years of Research” Journal of Consumer Research.
Lindstrom, M. and P. Seybold(2004), “Brand Child”, Kogan Page
Greig, A., J. Taylor and T. MacKay (2007), “Doing Research With Children”, 2nd edition, Sage Publications
MacKay, T. (1987), “Planning Research in Child Guidance”, SALGEP Quarterly, Vol.6, No. 1, pp. 3 – 11.
Malhotra, N. K., (2007) “Marketing Research – An applied approach”, 3rd European Edition, Prentice Hall.
Marshal, H. R. and Magruder, L. (1960), “Relations between Parent Money Education Practices and Children’s Knowledge and Use of Money”, Child Development, 253-284.
McNeal, J. U.(1992), “Kids as Customers: a Handbook of Marketing to Children”, New York – Lexington Books.
McNeal, J. U. (1999), The Kids Market: Myths and Realities, New York: Paramount Market Publishing, Inc.
McNeal, J. U. (2007), “On Becoming a Consumer: The Development of Consumer Behaviour Patterns in Childhood”, New York: Elsevier.
Monteiro, M.M., and Pereira, N., “Psicologia 12ºano – Acesso ao Ensino Superior”, Porto Editora
Piaget, J. and B. Inhelder (1972), “The Psychology of the Child”, Basic Books
Settersten, R. and Owens, T. J. (2002) “New Frontiers in Socialization”, 1st Edition, Elsevier Science.
30 Turner, J. and Brandt, J. (1978) “Development and Validation of a Simulated Market to Test Children for Selected Consumer Skills”, The Journal of Consumer Affairs, Vol. 12, No.2, pp. 266-276.
Valkenburg and Cantor (2001), “The development of a child into a consumer”, Journal of Applied Developmental Psychology, Vol. 22, No. 1, pp. 61 – 72.
31
8.
Appendixes
35
39
8.3.
Appendix C
–
Cards
Figure 1– Cards for the price-quantity evaluation
8.4.
Appendix D
–
Points Attribution
Table 2– Points Attribution
+ 1 point
- 1 point
- 0,5 points
Right answer of question 4
40
8.5.
Appendix E
–
Hypotheses Testing
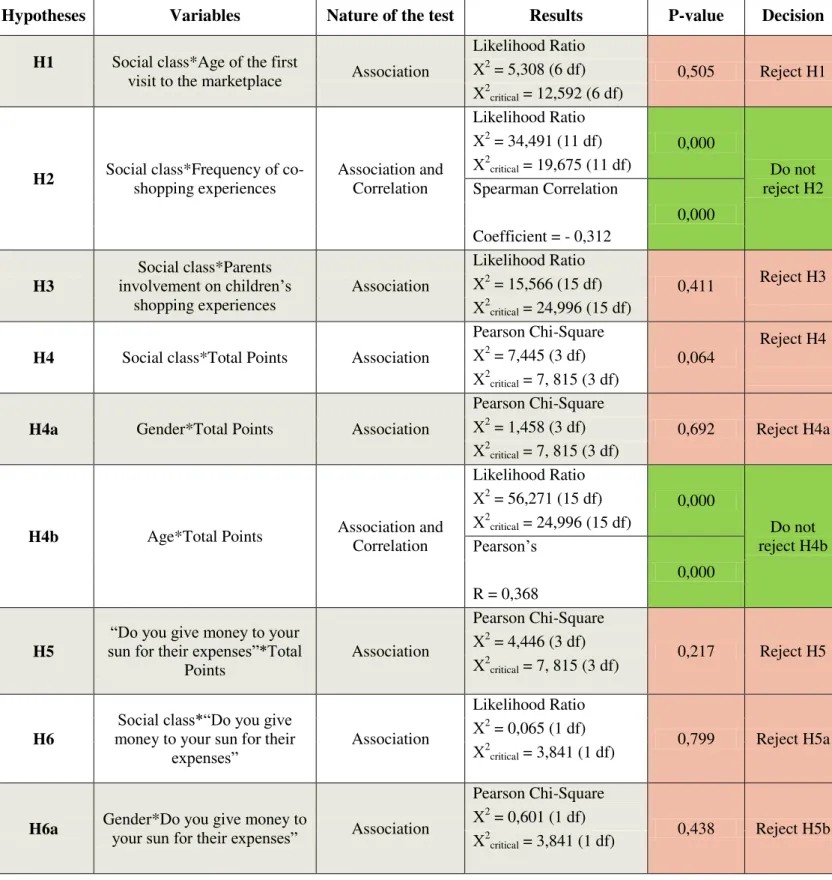
Table 3– Summary of the Results
Hypotheses Variables Nature of the test Results P-value Decision
H1 Social class*Age of the first
visit to the marketplace Association
Likelihood Ratio
0,505 Reject H1 Χ2
= 5,308 (6 df) Χ2
critical = 12,592 (6 df)
H2 Social class*Frequency of
co-shopping experiences Association and Correlation Likelihood Ratio 0,000 Do not reject H2 Χ2
= 34,491 (11 df) Χ2
critical = 19,675 (11 df)
Spearman Correlation
0,000 Coefficient = - 0,312
H3
Social class*Parents involvement on children’s
shopping experiences
Association
Likelihood Ratio
0,411 Reject H3 Χ2
= 15,566 (15 df) Χ2
critical = 24,996 (15 df)
H4 Social class*Total Points Association
Pearson Chi-Square
0,064
Reject H4 Χ2
= 7,445 (3 df) Χ2
critical = 7, 815 (3 df)
H4a Gender*Total Points Association
Pearson Chi-Square
0,692 Reject H4a Χ2
= 1,458 (3 df) Χ2
critical = 7, 815 (3 df)
H4b Age*Total Points Association and
Correlation Likelihood Ratio 0,000 Do not reject H4b Χ2
= 56,271 (15 df) Χ2
critical = 24,996 (15 df)
Pearson’s
0,000 R = 0,368
H5
“Do you give money to your sun for their expenses”*Total
Points
Association
Pearson Chi-Square
0,217 Reject H5 Χ2
= 4,446 (3 df) Χ2
critical = 7, 815 (3 df)
H6
Social class*“Do you give money to your sun for their
expenses” Association
Likelihood Ratio
0,799 Reject H5a Χ2
= 0,065 (1 df) Χ2
critical = 3,841 (1 df)
H6a Gender*Do you give money to your sun for their expenses” Association
Pearson Chi-Square
0,438 Reject H5b Χ2
= 0,601 (1 df) Χ2
41
H6b your sun for their expenses”Age*Do you give money to Association and
Correlation Likelihood Ratio 0,000 Do not reject H5c Χ2
= 32,653 (5 df) Χ2
critical = 11,070 (5 df)
Spearman Correlation
0,000 p-value < 0,000
Coefficient = 0,3
H7 Social Class*Opinion towards
savings Association
Likelihood Ratio
0,469 Reject H6 Χ2
= 10,694 (11 df) Χ2
critical = 19,675 (11 df)
H7a Gender*Opinion towards
savings Association and Correlation Likelihood Ratio 0,023 Do not reject H6a Χ2
= 22,165 (11 df) Χ2
critical = 19,675 (11 df)
Spearman Correlation
0,046 Coefficient = 0,127
H7b Age*Opinion towards savings Association
Likelihood Ratio
0,259 Reject H6b Χ2
= 61,348 (55 df) Χ2
critical = 73,311 (55 df)
H8 Social Class*Time Correlation - 0,936 Reject H7
H8a Gender*Time Correlation 0,842
Reject H7a -
H8b Age*Time Correlation
Pearson’s