*e-mail: [email protected] Recebido: 06/11/2011 / Aceito: 28/03/2012
Application of Kohonen maps to kinetic analysis of human gait
Silvia Elizabeth Rodrigo*, Claudia Noemí Lescano, Rodolfo Horacio Rodrigo
Abstract In recent years the use of artiicial neural networks for classiication and analysis of kinematic and kinetic characteristics of human locomotion has greatly increased. This happens in an attempt to overcome the limitations of traditional dynamic analysis and to ind new clinical indicators for interpreting quick and objectively the large amount of information obtained in a gait lab. One of the most widely used neural networks for human gait analysis is the self-organizing or Kohonen map, based on unsupervised learning without prior deinition of the formed natural groups. Among the advantages of using this type of neural network is the data dimensionality reduction, with minimal loss of information content, and the grouping of them in function of their similarities. Taking into account this, in this work an application case of a Kohonen map for clustering of locomotion kinetic characteristics in normal and Parkinson’s disease individuals is presented. The results indicate that the groups identiied by the map are consistent with the classiication carried out by experts in function of traditional gait dynamic analysis, showing the potential of this technique for distinguishing between a population of individuals with normal gait and with gait disorders of different etiology. Keywords Human gait, Parkinson´s disease, Artiicial neural network, Clustering.
Aplicação de mapas de Kohonen à análise cinética da marcha humana
Resumo Nos últimos anos, tem aumentado signiicativamente o uso de redes neurais artiiciais para a classiicação
e análise cinemática e cinética da marcha humana, em uma tentativa de superar as limitações da análise dinâmica tradicional e de encontrar novos indicadores clínicos para interpretar, de forma rápida e objetiva, a grande quantidade de informação obtida em laboratórios de marcha humana. Uma das redes neurais mais utilizadas para análise de marcha é o mapa de Kohonen ou mapa auto-organizado, baseado em aprendizado não supervisionado, sem uma deinição prévia de grupos naturais que se formam. O uso deste tipo de rede neural tem mostrado benefícios signiicativos associados com a redução da dimensionalidade dos dados com mínima perda de conteúdo de informação e com o agrupamento de dados de acordo com suas semelhanças. Neste contexto, este trabalho apresenta um caso de aplicação de um mapa de Kohonen como classiicador das características cinéticas da locomoção em indivíduos normais e com doença de Parkinson. Os resultados indicam que os grupos identiicados no mapa são consistentes com a classiicação feita por especialistas com base em análise dinâmica tradicional, que mostra o potencial desta técnica para diferenciar populações de indivíduos com marcha normal e de indivíduos com distúrbios da marcha de etiologia diferente.
Introduction
Human gait is a complex spatiotemporal process
involving structures and functions of the
neuromusculoskeletal system of human body (Sánchez
Lacuesta et al., 1999; Winter, 2005). Although this process is of individual character, the similarities
between individuals are such that a typical pattern
of normal human gait can be found. In addition, this
pattern experiences modiications due to the inluence
of diverse factors and particularly under certain
pathological conditions, where the gait eficiency diminishes with the consequent increase of energy expenditure that this implies (Lehmann and De Lateur,
1999).
Among these pathological conditions, those from
neuromuscular etiology such as Parkinson disease (PD),
a neurodegenerative disorder of the basal ganglia,
are included. Parkinsonian gait is characterized by small shufling steps, muscle rigidity at limbs and neck, variability in stride length and walking speed during free ambulation and postural instability, with the risk of falls and loss of functional independence in the most severe cases (Davie, 2008; Lehmann and De Lateur, 1999).
Through computer analysis realized in gait
laboratories it is possible to obtain kinematic, kinetic
and electromyographic variables that characterize
normal and pathological gait patterns (Medved, 2001). Proper processing and analysis of such locomotor information is a key factor to obtain an accurate
diagnosis of the considered gait pathology and to plan
its treatment (Battistella et al., 2009; Rodrigo, 2008; Rodrigo et al., 2008). However, these requirements imply spending many hours analyzing the collected
raw data by trained personnel. Moreover, the dificulty to ind new ways of linking information in complex locomotion disorders such as PD through traditionally used algorithms hinders the task of deining more
precisely the underlying cause of this disorder and its
effect on locomotor activity (Simon, 2004).
A possible solution to this problematic is to
apply clustering techniques based on artiicial neural network (ANN), which helps to quickly discriminate between normal and pathological gaits. In this regard, numerous studies show the high probability of success in achieving this classiication from different types of supervised and unsupervised ANN (Barton and Lees, 1997; Barton et al., 2006; Chau, 2001; Köhle and
Merkl, 1996). Speciically, the aim of this paper is to show the feasibility of using an unsupervised ANN,
as is the case of self-organizing maps or Kohonen
maps, SOM (Kohonen, 2001), for distinction between normal and parkinsonian gait patterns.
For this purpose in the next section irst, the ANN
input variables or descriptors used to differentiate
normal and Parkinson’s disease inter-subject gait patterns are deined. Second, the structure of SOM map and the procedure used to achieve the classiication is described. Then, the results obtained are shown and inally, a brief discussion precedes the conclusions of the work.
Materials and Methods
Human gait database
To demonstrate the suitability of the unsupervised ANN, a database corresponding to 60 normal individuals
(mean 63.3 years, range 37 to 86 years, 47% men) and 60 patients with idiopathic Parkinson’s disease (mean 68.8, range 45 to 84 years, 62% of men) was used as classiier of inter-subject gait variability. Among
other variables, this database contains demographic
information such as the weight of the analyzed subject
and a commonly used system, such as the Hoehn
& Yahr scale, for describing how the symptoms of Parkinson’s disease progress (Hoehn and Yahr,
1967). According to the original scale, the natural
progression of PD is developed through 5 stages of
ever increasing severity. Since then, stage 0 has been
added (corresponding to individuals with normal
gait), and stages 1.5 and 2.5 have been proposed,
resulting in a modiied scale as is indicated in Table 1.
In contrast to normal cases, pathological cases here
considered correspond respectively to 40 and 20 cases of stages 2 and 2.5 based on the modiied Hoehn and
Yahr scale. These stages are related to patients that
show an altered gait with bilateral symptoms but without loss of body balance (Hoehn and Yahr, 1967; PhysioBank, 2009).
As well, the database includes kinetic data for both feet that were acquired during a gait test of about
Table 1. Classiication of severity level of PD according to modiied
Hoehn and Yahr scale (Hoehn and Yarh, 1967).
Stage Signs y symptoms
0 No signs of disease.
1 Unilateral symptoms only.
1.5 Unilateral and axial involvement.
2 Bilateral symptoms. No impairment of balance. 2.5 Mild bilateral disease with recovery on pull test.
3 Balance impairment. Mild to moderate disease. Physically independent.
4 Severe disability, but still able to walk or stand unassisted.
2 minutes on level ground at normal self-selected
cadence for each test participant, which has been
digitalized and recorded at 100 samples per second
(PhysioBank, 2009). Underneath each foot there are 8 sensors that measure force (in Newtons) as a
function of time and together represent the plantar pressures distribution for every foot. The database
also contain two signals that relect the sum of the
8 sensor outputs for each foot, corresponding to the
vertical component of the ground reaction force (GRF) for both feet (Infotronic, 2005). Besides, to minimize
the effects of start-up and to match the length of the
vector data for all samples the irst 5 seconds of data were discarded, opting inally for a vector length of 5600. Figure 1 displays the vertical component of GRF during a gait cycle (GC) for both feet, obtained for a subject with normal gait and a Parkinson’s patient
from the mentioned database.
Deinition of variables
The choice of ANN input variables is based on typical inter-subject differences observed in the size and shape of the curve representing the temporal variation of
the vertical component of GRF, depending on the
condition of analyzed subject. Indeed, as displayed on Figure 1a for a case of normal gait, such curve has
two peaks. The irst one occurs during heel strike with the ground at the beginning of stance phase, while the second peak is caused by the upward force exerted
by ground during toe off at the end of the same phase
(Sánchez Lacuesta et al., 1999). Besides, the stance and swing phases pass between 0 - 60 and 60 - 100% GC, respectively.
In contrast, the curve shown in Figure 1b for the case of Parkinson’s disease patient exhibits some times, a reduction in the peaks height of GRF), in similar form to what occur in elderly individuals. Also of note is the variation of taken time for stance
and swing phases for PD patients with respect to normal individuals (in this case 70 and 30% of GC,
respectively), so as to ensure as far as possible, the body stability during locomotion. Later stages of this
disease are described by a gait with small shufling steps and a single narrow peak of vertical component of GRF, thus reducing signiicantly the time required for swing phase (Koozekanani, 1987).
The observed differences in Figure 1 between kinetic patterns for normal and parkinsonian gaits are consistent with the general conclusion stated by Crowther (2008, p. 357)
[...] a stable movement pattern is a behavioral state that is reproducible and independent of others and equates to low variability.
Higher gait variability can be caused by injury, disease, or aging, indicating that the related
neuromuscular system is less stable. Particularly in PD patients, different researches have shown increased gait variability, both intra- or within-subject and inter- or between-subject, which have been linked to an increased risk of falls in such patients (Hausdorff etal., 1998).
According to these observations and in order to select the most appropriate input variables for fast
differentiation of normal and parkinsonian gait patterns by ANN, distinct parameters were employed. Such
parameters characterize the inter-subject gait variability throughout the considered temporal signal. Among
them, were utilized: the mean standard deviation of GRF signal during consecutive stance phases, its maximum value (which deines the mean peak GRF
intensity for successive stance periods), the mean
coeficient of variation (CV) of GRF, and the mean sum of GRF over successive stance phases (as an approximation of the mean value of the area under
the curve through these consecutive phases).
Figure 1. Vertical component of ground reaction force (GRF) for both feet during a gait cycle (GC). a) normal gait; b) parkinsonian gait. For
normal gait stance phase (0-60% GC) begins at left heel strike (HS) and ends with toe off (TO). Swing phase takes between 60 and 100% GC. Notice how these percentages vary for parkinsonian gait.
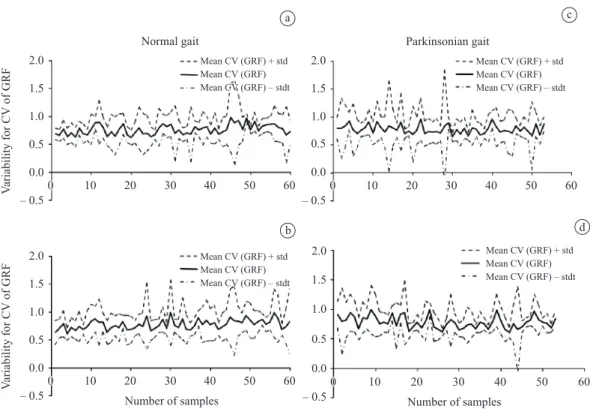
As an example of inter-subject variability for GRF
signal during successive stance phases, the variability
exhibited by the mean coeficient of variation of GRF
for the right and left legs is depicted in Figure 2. These curves correspond respectively to the 60 normal
(on the left) and the 60 pathological (on the right)
considered cases.
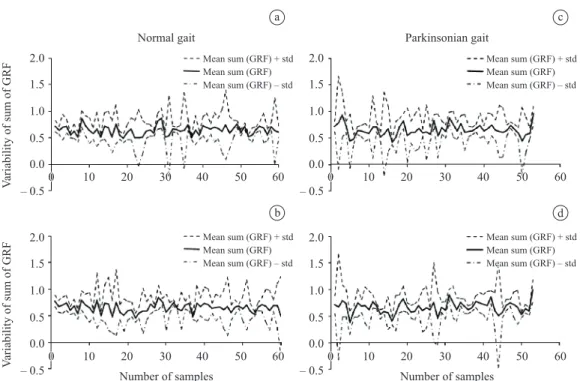
As well, in Figure 3 the inter-subject variability of mean sum of GRF through consecutive stance
phases for the right and left legs is represented for
the same normal (on the left) and pathological (on the
right) cases.
As can be visualized both in Figures 2 and 3 on the left, the inter-subject variability values for normal
gait exhibit not only a lower magnitude but also a minor temporal variability with respect to parkinsonian gait (Figures 2 and 3 on the right). This shows the feasibility of utilizing these indexes as descriptors of
inter-subject gait patterns through ANN.
Taking into account these antecedents and after several trials, the following descriptors of the vertical component of GRF characteristics for both feet were inally selected:
• Mean coeficient of variation (CV) of GRF
during consecutive stance phases to describe
the inter-subject variability in GRF magnitude and waveform throughout analyzed gait cycles.
It is determined in each sample and for left
and right feet, as the ratio between the mean standard deviation and the mean value of GRF
for each trial. After that, the average value of
CV of GRF is determined for all successive
stance phases of the analyzed gait cycles.
• Mean sum of GRF during successive stance phases, as an approximation of area under the GRF curve over these consecutive phases
of analyzed gait cycles. It is calculated in each sample and for left and right feet, as
the mean value of the sum of GRF for each
trial, then averaging the achieved values for all consecutive stance phases of the temporal signal considered.
As well, such variables were normalized by their respective maximum values, so that they have the same rank, in this case between 0 and 1, and the same variance, equal to 1. Finally, the ANN input
a
b
c
d
Figure 2. Inter-subject variability evaluated by the mean coeficient of variation (CV) of GRF during consecutive stance phases of gait
data are composed by normal and pathological cases randomly chosen.
Type and structure of the artiicial neural network
The ANN chosen to classify the gait data between
normal and pathological is the type called
self-organizing map (SOM) or Kohonen map, a type of ANN algorithm whose aim is to discover and
display the underlying structure of the data entered
in it, usually of high dimensionality. A SOM map is deined by an array of neurons (connected by a neighborhood relationship that deines the structure of the network) of a single layer, which represents ilters or processors selectively tuned by input data simultaneously presented to all network nodes. Consequently, the neurons transform the input signals
in a probability distribution encoded by positions on
a map structured according to its topology (Haykin, 2005; Kohonen, 2001; Merelo, 2004).
From a training process based on unsupervised
competitive learning, the SOM group the input data (of n dimension) in network nodes (each of which also
has dimension n) in terms of their similarity, projecting
them on a smaller map output in where the input data
characteristics are distributed in a gradual and order
form (Kohonen, 2001). Thus, SOMs allow for two
tasks on the input data: to reduce their dimensionality
and to visualize similarities. In this case and bearing
in mind that the objective of this work only aims to
assess the usefulness of ANN as differentiating normal
and parkinsonian gaits, a 2 × 2 structure was chosen.
Generation, training and visualization of the artiicial neural network
For SOM implementation a Matlab® Toolbox was
utilized through newsom function, which generates
an ANN deined in the following form (Vesanto et al., 1999):
[
]
(
)
=
net newsom P, d1, d2 , tfcn, dfcn, steps, in (1)
being: P: matrix R × Q, with R equal to input
variable number and Q, sample number; [d1,d2]: neural
network size (2 × 2); tfcn: neural network topology function, arranged in hexagonal, grid or randomly form (hextop, gridtop, or randtop respectively;
‘hextop’was chosen); dfcn: distance function from a particular neuron to its neighbors, Euclidian, by
steps, Manhattan or box types (dist, linkdist, mandist y boxdist, respectively, ‘linkdist’was chosen); steps: steps from the neighborhood to reduce its size to 1
(default = 100); in: neighborhood initial size (=3).
a
b
c
d
Figure 3. Inter-subject variability evaluated by the mean sum of GRF during consecutive stance phases of gait cycle, corresponding to 60
After defining the ANN (with the values speciied for the topology and distance function), the arrangements for the input data (an array of 120 samples of 4 elements each) were established.
The number of samples for training, validation and
testing was distributed in 90, 15 and 15, equivalent to 75, 12.5 and 12.5% of samples, respectively.
For training the Matlab®train function based on
the function NET.trainFcnand training parameters
NET.trainParamwas used, whose syntax is as follows:
[
net, tr]
= train NET, X, T(
)
(2)where: NET: generated SOM map; X: input vector
(in this case, 90 samples of 4 elements each), T: target
vectors (in this case, do not apply), net: new ANN
generated from training, tr: training register (number
of epochs or iterations (=500) and ANN performance (quantization error of 0.01).
According to this function, the training algorithm
move the SOM weight vectors (initially selected through Matlab®rands function, which generates
random values between –1 and 1) to extend then
through the cloud of input data, so the map is organized
in such a way that neighboring neurons in the ANN gain similar weight vectors. For this the Matlab® iterative
training algorithm (by default batch) was used in two
stages. In this process the total data set is presented to
the network and the new weight vector is a weighted average of the input data vectors. In the irst stage, which aims to organize the map, a high learning rate equal to 0.09 and a radius 3 neighborhood were employed, while in the second one, of ine tuning, these values were set respectively at 0.02 and 1, inishing the training (after 800 iterations in 12 seconds) with
a stable arrangement of the input patterns. For a more detailed description about this issue the references
cited can be consulted (Haykin, 2005; Kohonen, 2001; Merelo, 2004; Vesanto et al., 1999).
Finally, after the training phase, the network
produces an output suitable to all input samples through
sim Matlab® function, whose syntax is:
(
)
= ,
Y sim NET P (3)
where: NET: represents the trained ANN, P: set
of input samples; Y: ANN output.
Results
Figure 4 displays the clusters obtained for both types of gait data the SOM with the set of selected input variables, that is, the mean coeficient of variation and mean sum of GRF during consecutive stance phases of the analyzed gait signal. In this igure, the small
hexagons represent the neurons, while the lines within the large hexagons connect neighboring neurons.
In addition, the colors of the regions containing
these lines indicate the distances between neurons, representing the dark and light colors, large and small distances respectively. As well, the dark segments dividing the two-dimensional map show that the Kohonen map grouped the input data into two distinct regions, corresponding to individuals with normal and parkinsonian gaits.
Furthermore, in Figure 5 the distribution of
samples between normal and pathological cases is shown. From the analysis of these results it can be inferred that the SOM map operates as an appropriate classiicatory taking into account that was able to recognize respectively, 72.09% (corresponding to 31 of 43 normal cases) and 70.21% (in this case, 33 of 47 parkinsonian cases) of normal and pathological gait patterns. Other evaluators of SOM performance
Figure 4. Results of SOM neural network corresponding to
neighborhood deined by input vector samples.
Figure 5. Classiication of normal and parkinsonian gait pattern
are the sensibility and speciicity indexes, being their values equal to 0.721 and 0.702, respectively. These indexes were calculated from a number of 31
true negatives and 12 false positive from a total of
43 normal samples, and 33 true positives and 14 false negative from 47 pathological samples.
In contrast with the selected variables for this SOM application, using as input variables the mean of maximum value and the mean standard deviation of GRF during consecutive stance phases, the results shown in Figure 6 are generated. In this case, the sensibility and speciicity indexes were equal to 0.6744 and 0.6809, respectively, obtained from a
number of 29 true negatives and 9 false positive from
a total number of 43 normal samples, and 32 true positives and 20 false negative from 47 parkinsonian
samples.
On the other hand, Figure 7 indicates the weight adjustment of input variables made by the SOM map
in function of the spatial distribution of the samples
presented during training (lighter small dots). In addition, the dark spots represent the neurons in the SOM map. Also, there exists a correlation between dark and light areas shown in Figure 4 and the distances between neurons in 7.
Finally, Figure 8 shows the weight map for each element of the input vector (in this case, two elements for each leg) that characterizes the inluence degree of each input on each network neuron. Dark colors are indicative of greater weight and thus, greater inluence in deining the clusters. Furthermore, if the connection patterns of two inputs are very similar, it
can be assumed that the inputs are highly correlated.
Such is the case of weights for inputs 1 and 2 and for the inputs 3 and 4, representing respectively, the mean CV of GRF and the mean sum of GRF for left
and right feet.
Discussion
In the literature there are previous works oriented to classiication of kinematic and kinetic gait patterns through ANN. About this, the work by Chau (2001) provides an excellent review on the subject. As application examples, an automatic classiication of patients into groups with a SOM map was obtained using the vertical component of GRF under both feet, with results agreeing with the clinical classiication of the patients (Köhle and Merkl, 1996). Other research
group utilized a supervised ANN to differentiate
gait patterns from hip and knee joint angles in the sagittal plane (Barton and Lee, 1997). The same group used then a SOM map to reduce the complexity of three-dimensional joint kinematic and kinetic
data, projecting them in a two-dimensional map (Barton et al., 2006). Also, in a previous work a classiication of normal and parkinsonian gait based on a multilayer perceptron ANN was achieved from the power spectral density of GRF for the left leg as input variables (Battistella et al., 2009). These examples
Figure 6. Classiication of normal and parkinsonian gait pattern
samples for the mean maximum value of GRF and the mean standard deviation of GRF as input variables to SOM.
Figure 7. Results of SOM neural network corresponding to weight
show the applicability of ANN as an objective tool that may enhance decision making.
In the present work, a series of test were performed with different input variables for the SOM. In contrast with the results obtained in Figure 6 for the mean maximum value of GRF and the mean standard deviation of GRF, the use of the mean CV of GRF and the mean sum of GRF over successive stance phases were the best option to obtain a relative good classiication between normal and parkinsonian gaits (Figure 5). In the irst case, the sensibility and speciicity indexes were respectively equal to 0.6744 and 0.6809, meanwhile in the second one (that is, for the combination of SOM input variables used in this work), the values of sensibility and speciicity indexes were 0.721 and 0.702, respectively. Such
results demostrate for this application, the generality of the obtained solution.
If the classiication of gait patterns using a multilayer perceptron and a SOM ANNs are compared, better results are achieved in the irst case. However, it is noteworthy that the use of a multilayer perceptron is based on supervised learning, unlike SOM, where
no target is included to contribute to the differentiation of input patterns.
From the point of view of the causative
factors of gait variability, different hypothesis have been postulated. One of them proposes that
it is due to structural complexity of the human neuromusculoskeletal system, what determines an even more complex functional system that is inherently variable, both within and among individuals (Bates et al., 2004).
In addition, according to Bernstein’s theory,
effective organization of the multiple degrees of
freedom of the neuromusculoskeletal system is a requisite for healthy functional and steady locomotion patterns (Bernstein, 1967), manifested by small luctuations of gait parameters during free ambulation.
Nevertheless, in certain neuromuscular pathologies
such as PD, such luctuations are increased due to variability in stride length and walking speed during
ambulation at self-selected cadence, determining an
inability to maintain a steady walk with small stride-to-stride luctuations (Hausdorff et al., 2000, 2003;
Hausdorff, 2005). Other research works also show the
Figure 8. Inluence of the input variables weights (mean coeficient of variation (CV) of GRF and the mean sum of GRF) on neural network
importance of the integrity of cerebellum and basal
ganglia structures, typically affected in PD patients, in adequately regulating force and timing control in motor activities such as locomotion (Davie, 2008; James, 2004; Lehmann and De Lateur, 1999).
Such considerations could explain the greater
inter-subject variability observed in Figures 2 and 3
o the right for PD patients with respect to normal gait, on the left. Besides, consistent with the results of Figure 5, this differential gait attribute is relected in the speciicity index of 0.702, equivalent to a 70.21% of well classiied pathological samples.
With respect to the clinical relevance of these issues, such changes in variability of gait parameters
for PD patients could be a predictor of the level of
deterioration of brain structures that regulates force
and timing control for an eficient gait. In this sense,
it is proposed here to estimate a reference range of normal gait that can be used then to compare the degree of gait impairment in the considered pathological
condition. In this way, it can be quickly viewed in a irst approximation, how the pathological condition
deviates from normality.
Furthermore, greater inter-subject variability in PD patients would indicate an increased level of postural instability. As it is visualized in Table 1, the modiied Hoehn and Yahr scale is based on the two-fold concept that the severity of overall parkinsonian dysfunction
relates to bilateral motor involvement and the degree of gait balance.
In relation to the differential motor characteristics
of these two categories of PD patients here considered (40 and 20 cases with Hoehn and Yahr index equal to 2 and 2.5, respectively) and according to Table 1, while the irst has bilateral symptoms without impairment of balance, the second one exhibits mild bilateral disease with recovery on pull test. This last test evaluates postural instability, which is the relative ability or
inability to recover from falling. In the pull test, the
individual being tested is asked to maintain his balance while an examiner pulls him backward. As it is indicated in Table 1, PD patients with a Hoehn and Yahr index
value of 2.5 are not affected by postural instability and for this reason, the observed differences can not be
attributed to an increased risk of falls in such patients. Summing up and according to these examples and
observations, the results here obtained reveal the high probability of success in achieving differentiation
between normal and parkinsonian gait patterns. In this sense, the speciicity of the utilized descriptors played a key role not only in reducing the dimensionality of the input data, but also in inding similarities between
both types of analyzed populations.
Conclusion
In this work a SOM map was used for clustering of normal and parkinsonian gait patterns. In the context of kinetic data analysis, the SOM can be regarded as a software tool that reduces the amount of data with
minimal loss of information content. After the learning
phase, input values can be classiied as belonging to speciic clusters, and in general hidden structures of
the input data set can be detected.
From the biomedical point of view, the current application of SOM map indicates that the vertical component of GRF contains relevant information for differentiating quickly and objectively normal and pathological gait patterns. This shows that the
utilized combination of input variables and the type of ANN is feasible for clustering of gait patterns. An additional advantage of using ANN is to obtain
the classiication automatically, without deining a
biomechanical model of the human body to process the
data. As well, the clinical relevance of this application of ANN is related with the fact that changes in gait variability with respect to normal gait, could be a
predictor of the degree of ambulation impairment in the considered pathological condition.
Based on the obtained results, in future work it is expected to generate new descriptors to identify
more accurately the mechanical and neurological
behaviors of human body during parkinsonian gait,
both intra- and inter-subject. Such descriptors could
be parameters to identify the marked body imbalance or the increased variability between steps, typically seen in patients with Parkinson’s disease.
References
Barton JG, Lees A. An application of neural networks for distinguishing gait patterns on the basis of hip-knee joint angle diagrams. Gait & Posture. 1997; 5(1):28-33. http:// dx.doi.org/10.1016/S0966-6362(96)01070-3
Barton JG, Lees A, Lisboa G, Attield S. Visualisation of gait data with Kohonen self-organising neural maps. Gait & Posture. 2006; 24(1):46-53. http://dx.doi.org/10.1016/j. gaitpost.2005.07.005
Bates BT, James CR, Dufek JS. Single-Subject Analysis. In: Stergiou N, editor. Innovative tools for human movement research. Human Kinetics; 2004. p. 3-28.
Battistella ME, Lescano CN, Rodrigo RH, Rodrigo SE. Registrador de presiones plantares en condiciones dinámicas. Memorias del XVII Congreso Argentino de Bioingeniería y las VI Jornadas de Ingeniería Clínica; 2009 Oct 14-16; Rosario, Argentina. 2009. p. 150-3.
Chau T. A review of analytical techniques for gait data. Part 2: neural network and wavelet methods. Gait & Posture. 2001; 13(2):102-20. http://dx.doi.org/10.1016/S0966-6362(00)00095-3
Crowther RG, Spinks WL, Leicht AS, Quigley F, Golledge J. Intralimb coordination variability in peripheral arterial disease. Clinical Biomechanics. 2008; 23(3):357-64. PMid:18061322. http://dx.doi.org/10.1016/j.clinbiomech.2007.10.009 Davie CA. A review of Parkinson’s disease. British Medical Bulletin. 2008; 86(1):109-127. PMid:18398010. http:// dx.doi.org/10.1093/bmb/ldn013
Hausdorff JM. Gait variability: methods, modeling and meaning. Journal of NeuroEngineering and Rehabilitation. 2005; 2:1-9. PMid:16033650 PMCid:1185560. http://dx.doi. org/10.1186/1743-0003-2-19.
Hausdorff JM, Cudkowicz ME, Firtion R, Wei JY, Goldberger AL. Gait variability and basal ganglia disorders: stride-to-stride variations in gait cycle timing in Parkinson’s disease and Huntington’s disease. Movement Disorders. 1998; 13(3):428-37. PMid:9613733.
Hausdorff JM, Lertratanakul A, Cudkowicz ME, Peterson AM, Kaliton D, Goldberger AL. Dynamic markers of altered gait rhythm in amyotrophic lateral sclerosis. Journal of Applied Physiology. 2000; 88:2045-2053. PMid:10846017. Hausdorff JM, Schaafsma JD, Balash Y, Bartels AL, Gurevich T, Giladi N. Impaired regulation of stride variability in Parkinson’s disease subjects with freezing of gait. Experimental Brain Research. 2003; 149(2): 187-94. PMid:12610686.
Haykin S. Self-organizing Maps. In: Haykin S, editor. Neural Networks. A Comprehensive Foundation. Delhi: Pearson Education; 2005. p. 465-505.
Hoehn MM, Yahr MD. Parkinsonism: onset, progression, and mortality. Neurology. 1967; 17(5):427-42. PMid:6067254. Infotronic. CDG 16 channel foot pressure measurement. [Internet]. 2005 May [cited 2005 May]. Available from: http://www.infotronic.nl/industrial-medical/products/cdg.html James CR. Considerations of Movement Variability in Biomechanics Research. In: Stergiou N, editor. Innovative Tools for Human Movement Research. United States of America: Human Kinetics; 2004. p. 29-62.
Köhle M, Merkl D. Identiication of gait patterns with self-organizing maps based on ground reaction force. In: ESANN’96: Proceedings of the European Symposium on
Artiicial Neural Networks; 1996 Apr 24-26; Bruges, Belgium. Bruges; 1996. p. 73-8.
Kohonen T. Self-organizing maps. Berlin: Springer; 2001. http://dx.doi.org/10.1007/978-3-642-56927-2
Koozekanani SH, Balmaseda MT, Fatehi MT, Lowney ED. Ground reaction forces during ambulation in Parkinsonism: pilot study. Archives of Physical Medicine and Rehabilitation. 1987; 68(1): 28-30. PMid:3800620.
Lehmann JF, De Lateur BJ. Análisis de la marcha: diagnóstico y manejo. In: Kottke FJ, Lehmann JF, editors. Krusen: Medicina física y rehabilitación. Madri: Editorial Médica Panamericana; 1999. p. 108-26.
Medved V. Measurement of human locomotion. United States of America: CRC Press LLC; 2001.
Merelo JJ. Mapa autoorganizativo de Kohonen. [Internet]. 2004 Apr [cited 2004 Apr 21]. Available from: http://geneura.ugr.es/~jmerelo/tutoriales/ bioinfo/Kohonen. html
Physiobank. Physiological signal archives for biomedical research. [Internet]. PhysioNet:MIT; Cambridge; 2009. [cited 2011 Mar 20]. Available from: http://www.physionet. org/physiobank/database/gaitdb/
Rodrigo SE, Ambrosio JAC, Tavares Da Silva MP, Penisi OH. Analysis of human gait based on multibody formulations and optimization tools. International Journal Mechanics based Design of Structures and Machines. 2008; 36(4):446-77. http://dx.doi.org/10.1080/15397730802425497
Rodrigo SE. Modelación y simulación de la marcha humana [thesis]. San Juan: Universidad Nacional de San Juan; 2008. Sánchez Lacuesta JJ, Prat Pastor JM, Hoyos Fuentes JV, Viosca Herrero E, Soler Gracia C, Comín Clavijo M, Lafuente Jorge R, Fabregat A, Vera PP. Biomecánica de la marcha humana normal y patológica. Valencia: Instituto de Biomecánica de Valencia; 1999.
Simon SR. Quantification of human motion: gait analysis - beneits and limitations to its application to clinical problems. Journal of Biomechanics. 2004; 37(12):1869-80. Pmid:15519595. http://dx.doi.org/10.1016/j. jbiomech.2004.02.047
Vesanto J, Himberg J, Alhoniemi E, Parhankangas J. Self-organizing map in Matlab: the SOM Toolbox. In: Proceedings of the Matlab DSP Conference; 1999 Nov 16-17; Espoo, Finland. Espoo; 1999. p. 35-40.
Winter DA. The biomechanics and motor control of human movement. John Wiley & Sons Inc.; 2005.
Authors
Silvia Elizabeth Rodrigo, Claudia Noemí Lescano, Rodolfo Horacio Rodrigo Facultad de Ingeniería, Universidad Nacional de San Juan – UNSJ,