Full Terms & Conditions of access and use can be found at
http://www.tandfonline.com/action/journalInformation?journalCode=tbsm21
International Journal of Biodiversity Science, Ecosystem
Services & Management
ISSN: 2151-3732 (Print) 2151-3740 (Online) Journal homepage: http://www.tandfonline.com/loi/tbsm21
Ecosystem functions at the island scale: a
contribution to the design of ecological structure
Marta Vergílio, Peter V August, Helena Calado & Catarina Fonseca
To cite this article: Marta Vergílio, Peter V August, Helena Calado & Catarina Fonseca (2017) Ecosystem functions at the island scale: a contribution to the design of ecological structure, International Journal of Biodiversity Science, Ecosystem Services & Management, 13:1, 355-379, DOI: 10.1080/21513732.2017.1388290
To link to this article: https://doi.org/10.1080/21513732.2017.1388290
© 2017 The Author(s). Published by Informa UK Limited, trading as Taylor & Francis Group.
View supplementary material
Published online: 27 Oct 2017.
Submit your article to this journal
Article views: 371
Ecosystem functions at the island scale: a contribution to the design of
ecological structure
Marta Vergílio a, Peter V Augustb, Helena Caladocand Catarina Fonsecaa,d
aCIBIO
–Research Center in Biodiversity and Genetic Resources/InBIO–Associate Laboratory, University of the Azores, Ponta Delgada, Portugal;bDepartment of Natural Resources Science, University of Rhode Island, Kingston, RI, USA;cMARE- Marine and Environmental Sciences Centre, Faculdade de Ciências da Universidade de Lisboa, Lisboa, Portugal;dFaculty of Social Sciences and Humanities (FCSH/ NOVA), CICS.NOVA, Interdisciplinary Center of Social Sciences (CICS.NOVA), Lisboa, Portugal
ABSTRACT
The concept of ecological structure (ESt), as implemented through spatial planning, has been recently used to protect ecosystem functions (EFs) and services and their contribution to human well-being. This study intends to provide an exploratory analysis to operationalize the inclusion of EFs in the design of ESt in territories lacking detailed individual studies on EFs. The objective is to advance this concept in small island ecosystems and use Pico Island (Portugal) as case study. The proposed methodology identifies EFs contributing to the objectives of ESt. It uses (i) geographic data available from studies on individual EFs and (ii) definition of territorial units (TUs), based on biophysical features, used as cartographic units to assign and map remaining EFs. A total of 15 EFs were selected among three main categories: natural regulation (10), support (3) and cultural (2) functions. Geographic data are available for carbon storage and groundwater recharge. To assign the remaining EFs, a total of 86 TUs were defined. The performed analysis suggested that the use of EFs, along with multi-criteria decision-making techniques, could successfully contribute to define ESt and integrate it into spatial planning on Pico Island and other small islands systems.
ARTICLE HISTORY
Received 12 September 2016 Accepted 26 September 2017
KEYWORDS
Ecosystem service; spatial planning; environmental management; small Island; Azores
1. Introduction
The concept of conservation has been gradually chan-ging in recent decades; from the protection of species to the protection of whole ecosystems, their conco-mitant functions and contributions to human well-being through the provision of ecosystem services ([MEA] Millennium Ecosystem Assessment 2005). This approach has been encouraged in application of spatial planning and management, with a con-scious integration of the protection and enhancement of natural processes and functions through ecological structure (ESt) (COM2013). For example, European Union (EU) leaders, recognizing that the loss of bio-diversity could not be reversed by the target date of 2010 (COM2011a), adopted a new target‘to halt the loss of biodiversity and the degradation of ecosystem services by 2020’by defining a long-term target and vision and a new biodiversity strategy: to protect, value and appropriately restore biodiversity and the ecosystem services it provides (its natural capital) by 2050 (COM 2011b). This last approach to nature conservation brings new challenges to spatial plan-ning and land management and requires novel ratio-nales and methodologies. Defining the ESt can aid local decision-making (e.g., in municipalities), as it integrates information and spatial data on ecosystem
functions (EFs) that can provide insight into manage-ment of local resources. Small island systems are especially amendable to this approach since they must consider ecological and economic goals in rela-tively small, complex landscapes.
Small-sized and well-defined territorial boundaries of small islands and their particular vulnerability to natural hazards and land-use disturbances (Mimura et al. 2007; Rietbergen et al. 2007) pose additional challenges in the search for alternative economic activities and allocation of development sites. Spatial planning is extremely complex when land area for development or conservation is limited. For this rea-son, integration of natural processes and functions into spatial planning and land management instru-ments should favor the provision of crucial ecosystem services.
Methodologies to assess and design ESt and inte-grate ecosystem services in spatial planning are emer-ging. Liquete et al. (2015) proposed a methodology to identify and map elements of green infrastructure at a landscape level based on the concepts of ecological connectivity, multi-functionality of ecosystems and maximization of benefits both for humans and for natural conservation. First, they quantified and mapped the natural capacity to deliver ecosystem
CONTACT Marta Vergílio marta.hs.vergilio@uac.pt CIBIO – Research Center in Biodiversity and Genetic Resources/InBIO – Associate Laboratory, University of the Azores, Ponta Delgada, Portugal
Supplemental data for this article can be accessedhere.
–
https://doi.org/10.1080/21513732.2017.1388290
© 2017 The Author(s). Published by Informa UK Limited, trading as Taylor & Francis Group.
This is an Open Access article distributed under the terms of the Creative Commons Attribution License (http://creativecommons.org/licenses/by/4.0/), which permits unrestricted use, distribution, and reproduction in any medium, provided the original work is properly cited.
services and, second, they identified core habitats and wildlife corridors for biota. They applied the method at a continental scale, considering eight ecosystem services and the habitat requirements of large mam-mal populations. Arcidiacono et al. (2016) proposed a methodology for the spatial identification of the regional green infrastructure in the Lombardy Region of northern Italy. They selected two models from the InVEST software as a proxy of natural and recreational values and used the Kernel density (a geospatial analysis procedure) to develop visual ele-ments as a proxy of landscape values. Snäll et al. (2016) outlined a toolbox of methods useful for green infrastructure design that explicitly accounts for biodiversity and ecosystem services, namely using spatial conservation prioritization and model-ing of biodiversity features and ecosystem services.
Snäll et al. (2016) concluded that spatial conserva-tion prioritizaconserva-tion methods are effective tools for green infrastructure design. They also determined that sufficiently accurate spatial data at relevant reso-lutions are needed, especially for spatial data on eco-system services and on the occurrence of multiple biodiversity features, such as species and habitat types. Small islands typically have limited human and economic resources (Mimura et al. 2007) to appropriately manage their resources and associated problems. The technical knowledge and geospatial data to successfully implement and develop spatial planning models are frequently unavailable. This is the case for municipalities in the Azores, a Portuguese archipelago in the North Atlantic Ocean. Spatial planning in Portugal is a public policy expressed by the spatial organization of human activ-ities and interests and the protection of natural resources (Calado et al.2015). The Azores, an archi-pelago composed of nine small islands, is an autono-mous region of Portugal and is one of the outermost regions of the EU. The Azorean Regional Government has political and administrative auton-omy to create or adapt national legislation to region-specific interests, but they must also comply with or adapt to both European and Portuguese legislations.
The legal framework for territorial management in the Azores is currently established by the Regional Legislative Decree No. 35/2012/A of 2012 and is organized into two levels: regional and municipal. At the municipal level, Municipal Master Plans (MMPs) are tools for the socio-economic develop-ment of the municipalities and define a model of territorial organization, establishing parameters for occupation and land use. Each MMP must identify and map the systems for protecting the values of natural, cultural, agricultural and forest resources, thereby providing the delineation of municipal ESt (Regional Legislative Decree No. 35/2012/A of 2012). The mapping of ESt is, therefore, already required in
the Azores for spatial planning, but no specific guide-lines or standard methodologies have been provided to support municipalities in implementing the con-cept. This means that on islands with several munici-palities, each municipality may choose a method to implement, regardless what neighboring municipali-ties choose. This can lead to discrepancies at the island level. Moreover, MMPs in Portugal should be revised every 10 years and some plans in the Azores are about to be revised. Municipalities will need to adopt a methodology, adapted to their unique data and technical resources, to design their ESt conform-ing, at the same time, with European and national guidelines and directives.
The ESt intends to maintain natural processes and the balance of healthy ecosystems, ensuring the pre-servation of their functions and services that ulti-mately enhance the quality of life for communities and people (e.g., Naumann et al. 2011; Regional Legislative Decree No. 35/2012/A of 2012; COM
2013). The European Commission (COM 2013) advocates that ‘green infrastructure’ (designated as an ESt in accordance with Portuguese legislation) requires a holistic view of ecosystem services. This provides an opportunity to improve decision-making by integrating ecological and sustainable goals into spatial planning, which will ultimately contribute to maintaining healthy ecosystems and their capacity to provide ecosystem services. Several EFs, which are the basis for the provision of ecosystem services, and resources are potentially more limited on confined territories than continental territories. Hansen and Pauleit (2014) demonstrated that ESt and ecosystem services‘are closely related and may strengthen each other in the development of a common framework for research as well as for implementation.’Thus, the incorporation of ESt into local and regional policies and its design based on EFs should be especially advantageous on small islands systems, such as the Azores.
defining the‘priority ESt’and ensuring that ESt com-plies with the island’s environmental legal framework and (ii) identifying the several EFs that contribute to the goals of ESt for the remaining territory that will define the ‘secondary ESt.’Secondary ESt is less sen-sitive than the ‘priority ESt.’ but requires careful analysis to determine whether to promote conserva-tion or development and articulating the limits of each option. A final phase combines this information with a multi-criteria decision-making model to inte-grate public and/or stakeholders participation. The end result is an informed trade-off analysis between EFs and allowing the ESt for the entire island to be mapped.
It is assumed in this study that good provision of ecosystem services depends on healthy EFs (De Groot
1992), despite that the distinction between‘function,’ ‘service,’and‘benefit’is still being debated (De Groot et al.2010). This study intends to operationalize the methodology proposed by Vergílio and Calado (2016) to identify and map EFs so they can be integrated in the design of the ESt to be used by small municipa-lities or territories lacking detailed data on biodiver-sity and individual studies on ecosystem functions and services. This approach presents an exploratory strategy to identify and map a higher number of EFs. Several studies, however, use very few ecosystem ser-vices (Egoh et al.2008; Liquete et al.2015; Maes et al.
2015; Arcidiacono et al. 2016) for integration into island spatial planning. This study develops a meth-odology to map EFs that will, along with the multi-criteria decision-making, map secondary ESt, follow-ing the theoretical framework proposed by Vergílio and Calado (2016). Using Pico Island (in the Azores) as a case study and focusing on 15 EFs that will contribute to meet the objectives of ESt referred in the Azorean legislation, the study develops a practical methodology to aggregate and map EFs, using speci-fic available studies on individual EFs or based on TUs’ features. The extent to which Pico Island-pro-tected areas (PAs) (Regional Legislative Decree No. 20/2008/A of 2008) and alternative or complementary areas relevant for the conservation of species on Pico Island (Vergílio, Fonseca, et al.2016) overlap EFs is also assessed.
2. Conceptual framework
Natural capital has been widely used in the literature as a useful analogy for environmental resources and can be understood as‘any stock of natural resources or environmental assets, such as oceans, forests or agricultural land, that yield a flow of useful goods and services now and into the future’(MacDonald et al.
1999). Natural capital also often includes the capacity to assimilate waste (such as the capacity of the atmo-sphere to absorb pollution), life-support functions
provided by the environment (such as the ozone layer) and the amenities of environmental resources (such as the aesthetic quality of landscapes) (Costanza et al.1997; MacDonald et al.1999).
The concepts of ‘ecosystem function’and ‘ ecosys-tem services’ have been defined, but there is some confusion over their distinction. The terms are some-times used to describe the combination of processes and structures and the internal functioning of an ecosystem. They are also associated with human ben-efits that societies derive from the properties and processes of ecosystems, reflecting human demand and economic evaluation (De Groot et al. 2003,
2010). Definitions and classifications are still debated, which is not surprising given the myriad ways in which ecosystems support human life and contribute to its well-being ([TEEB] The Economics of Ecosystems and Biodiversity2010).
In this study, the main difference between EFs and ecosystem services is articulated by De Groot et al. (2010): ‘ecosystem services are generated by EFs which in turn are underpinned by biophysical structures and processes’. EFs are the biological, geochemical and physical processes and compo-nents of an ecosystem ([SEQ] Ecosystem Services Project 2016). Functions result from the natural processes of the ecological subsystem to which they belong, and they represent the potential to constitute direct and indirect sources of goods (e.g., provision of food; fuel and construction mate-rials) and services (e.g., purification of air and water and generation and renewal of soil fertility) for human societies (De Groot et al. 2003; Song et al.
2016). Therefore, protecting EFs is fundamental to maintaining the supply of these services.
Using EFs in spatial planning and in the design of the ESt should allow spatial-planning tools (such as MMPs) to be as up to date as possible, avoiding the dependence of evaluations of ecosystem services on market prices or political will (Vergílio and Calado
2016).
Some EFs provided by natural capital are essential for maintaining their own balance, and others are essential for the persistence of goods and services that natural capital offers ([MEA] Millennium Ecosystem Assessment2003). Ekins et al. (2003) sug-gest a distinction between ‘functions of’ the natural capital and ‘functions for’humans provided by nat-ural capital (Figure 1).‘Functions of’are defined from an ecological perspective, such as the basic processes and cycles of the internal functioning of natural sys-tems that regulate the conditions of life and are responsible for sustaining and maintaining the stabi-lity and resilience of ecosystems resulting from the continuous interactions between biotic and abiotic components and their co-evolution (Holling et al.
‘functions for’are defined from a human perspective, in which the flow of natural or processed goods and services and the absorption of wastes from human activities directly or indirectly contribute to human well-being. In general,‘functions of’are the basis for the ‘functions for’, which could not be sustainable without natural capital (De Groot et al. 2003; Ekins et al.2003).
The above categorization comprises one of the most common classifications of EFs (Costanza et al.
1997; De Groot 1992, 2006; De Groot et al. 2000,
2002; Oikonomou et al. 2011). It is sometimes also used as a classification for ecosystem services, such as De Groot et al. (2010), De Groot et al. (2012), [TEEB] The Economics of Ecosystems and Biodiversity (2010), MEA (2003), Kovács et al. (2015), Eastwood et al. (2016) and in the Portuguese legislation (Decree-Law No. 142/). ‘Functions of’ includes nat-ural regulation and support functions, and‘functions for’ includes production and cultural functions (De Groot et al. 2003; Ekins et al. 2003).
The natural regulation functions refer to the ability of natural and semi-natural ecosystems to regulate ecological processes that play a key role in maintain-ing the balance of the systems that support life, through biogeochemical cycles and other biospheric processes, and provide direct and indirect services to society (De Groot et al. 2002; [MEA] Millennium Ecosystem Assessment2003). Support functions cor-respond to local landscapes, providing habitats (sui-table living space), refugia and breeding and nursery grounds for wild plants and animals and contributing to the in situ conservation of biological and genetic diversity and evolutionary processes (De Groot et al.
2002; [SEQ] Ecosystem Services Project 2016).
Production functions are associated with processes that allow the provision of natural resources, goods and services for human consumption (De Groot et al.
2002; [SEQ] Ecosystem Services Project 2016). Cultural functions are those providing intangible benefits by the exposure to life processes and natural systems (De Groot et al. 2002; [MEA] Millennium Ecosystem Assessment 2003; [SEQ] Ecosystem Services Project2016).
EFs, and not ecosystem services, are used in this study as the basis of a strategic approach to integrate the design of the ESt, assuming that ensuring well-functioning ecosystems produces good conditions for providing ecosystem services in the future.
3. Methodology
3.1. Study area
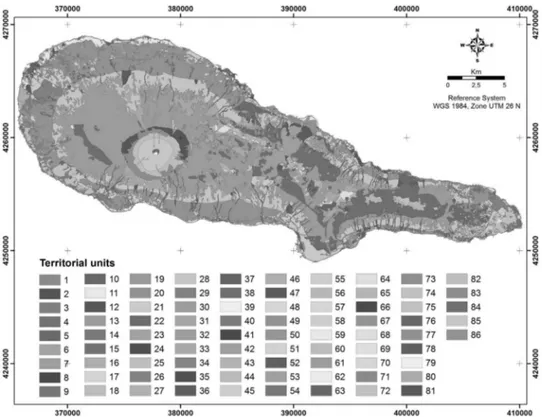
The study was carried out in the Azores archipelago, located in the North Atlantic between 37 and 40°N and 25 and 31°W, approximately 1500 km from the Portuguese mainland and 3900 km from the east coast of North America (Figure 2). The islands are geographically divided into three groups: Western Group (Flores and Corvo), Central Group (Graciosa, São Jorge, Faial, Pico and Terceira) and Eastern Group (São Miguel and Santa Maria).
The Azores have a temperate oceanic climate with a mean annual temperature of 17°C at sea level, low thermal amplitude, high mean relative humidity, per-sistent wind and rainfall ranging from 800 to 3000 mm/m2which increases with altitude (Azevedo
1996). The Azores are characterized by low and rocky coastlines and coastal cliffs (Borges2003), prominent
river valleys in eroded volcanic rocks, vast lava flows and active volcanoes (Condé and Richard2002). The association between the physiographic and climatic regime contributes to the low diversity of water resources (ephemeral and torrential streams, lagoons, small ponds, coastal waters and groundwater) and small watersheds (usually <30 km2) ([DROTRH/IA] Direcção Regional do Ordenamento do Território e dos Recursos Hídricos/Secretaria Regional do Ambiente 2001). Located near the triple junction of the American, Eurasian and African plates (Cruz
2003), the Azores are highly vulnerable to tsunamis, seismic or volcanic events and landslides (Andrade et al. 2006). The archipelago is part of the Macaronesia Biogeographic Region, along with the Madeira archipelago (Portugal), Canary Islands (Spain) and Cape Verde, and is one of Europe’s unique areas of biodiversity (Condé and Richard2002).
This study focused on Pico Island (Figure 2), the youngest and second largest Azorean island, covering an area of 447 km2, with 152 km of coastline and reaching an elevation of 2351 m at the top of its volcano, Mount Pico, in the western part of the island. Pico Island is divided into three municipali-ties: Madalena, São Roque do Pico and Lajes do Pico, with a population density of approximately 31.8 inha-bitants/km2in 2011 (PORDATA2015). The economy is currently dependent mainly on crops, cattle pro-duction, fisheries and tourism (Calado et al. 2014). Settlements, transportation infrastructure and
economic activities are concentrated along the coast, mainly due to their dependence on the sea as the most important route of commerce and to the geolo-gical, geomorphologic and climatic constraints of the island (Porteiro et al.2005). Forests include stands of
Cryptomeria japonica and Eucalyptus globulus.
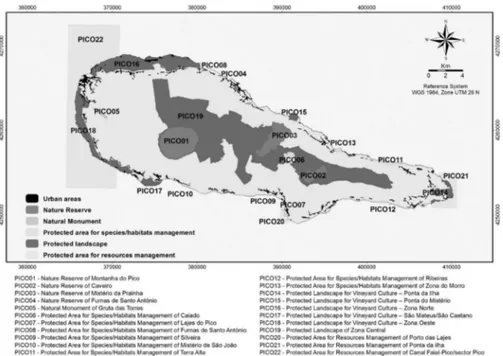
Agricultural areas include a traditional viticulture with a strong sociocultural identity classified as a UNESCO world heritage site – Landscape of the Pico Island Vineyard Culture – and grasslands. The center of the island is dominated by large grasslands and natural areas, such as wetlands, peat bogs and several types of native forest and shrubland (Costa et al. 2013), containing the majority of the PAs (Figure A1 in Appendix A). The development of monocultural landscapes for pastures and forests increased the fragmentation of the natural ecosystems and changed the biodiversity in Pico and many areas of the archipelago, giving rise to the expansion of non-indigenous and invasive species (Silva and Smith2006) and greater homogenization of ecologi-cal communities (Florencio et al.2013).
Pico’s Island Natural Park (INP) contains 22 PAs (Figure A1, Appendix A) (19 terrestrial and 3 mar-ine): four nature reserves, one natural monument, eight PAs for habitat/species management, six pro-tected landscapes and three PAs for resource manage-ment (all three are coastal and marine areas).
Pico Island was chosen as a case study because it has the largest proportion of PAs (approximately 35%
of the island territory), several activities occur across the island and the three MMPs will be soon under revision. ESt is an element of the MMPs, so develop-ing a methodology for Pico Island may be useful for integrating the revised plans in the future.
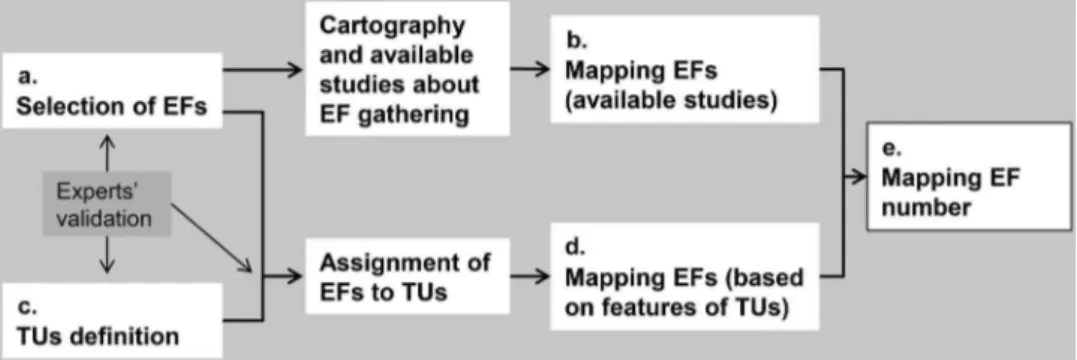
3.2. Selection of EFs
To identify and map EFs to be integrated in the ESt, the first step was the selection of EFs that contribute to achieve ESt objectives (Figure 3(a)). A revision of the literature on EFs and ecosystem services was performed (De Groot1992,2006; Costanza et al.1997; De Groot et al. 2000, 2002, 2010, 2012; [MEA] Millennium Ecosystem Assessment 2003, 2005; [TEEB] The Economics of Ecosystems and Biodiversity 2010; Eastwood et al. 2016) in order to identify the EFs’
classifications that are most accepted in the scientific community. Priority was given to classifications that specifically categorize EFs. Remaining literature was also used to identify gaps on previous papers and the missing ecosystem services were converted into EFs (e.g., the ecosystem service‘genetic resources,’ identi-fied in [MEA] Millennium Ecosystem Assessment (2003), can be converted to the EFs ‘maintenance of natural evolutionary processes’).
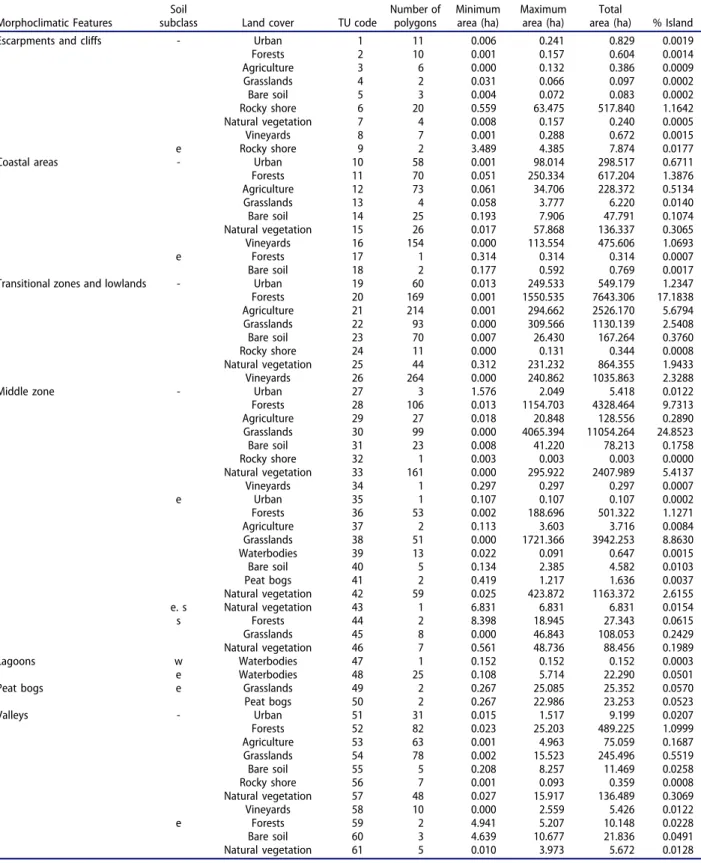
The classification used in the present methodology was mainly based on those proposed by Costanza et al. (1997) and De Groot et al. (2002, 2010). Considering the particular case study of Pico Island, the ESt should identify systems for the protection of natural, cultural, agricultural and forest resources (Regional Legislative Decree No. 35/2012/A), thus only EFs associated with these resources were selected (Table 1).
The selection of functions also considered the insular context. For example, small islands have insufficient area to contribute much to the regulation of the global climate, so this function (Eastwood et al.
2016) and the chemical regulation of the atmosphere (De Groot1992) were adapted to represent the func-tion at the local scale. Small islands may contribute little to global climate change but are highly exposed and susceptible to its consequences, namely coastal storms and landslides (Nurse et al. 2014). Coastal
hazards are a major issue in these territories, so the mitigation of extreme coastal events was added as an EF, even though it is not an intrinsic function of the ecosystem itself. The chemical regulation of the local atmosphere was evaluated separately from carbon storage based on Vergílio, Fjøsne, et al. (2016). It is assumed that the regulation of the local atmosphere contributes to the release of gases to the atmosphere (mainly carbon dioxide) and carbon storage seques-ters carbon from the atmosphere.
3.3. Description of data
This methodology includes two approaches for which a schematic representation is given inFigure 3.
The first approach assumed that studies focused on mapping individual EFs in the study area are as accurate as possible (Figure 3(b)). Geospatial data resulting from those studies were used to map corre-sponding EFs if they existed in the available literature and/or digital databases at appropriate scale and for-mat. Individual studies were used to map the func-tions of carbon storage (Vergílio, Fjøsne, et al.2016) and groundwater recharge (Cruz et al.2011).
Several authors have advocated that planning deci-sions should be based on ‘conserving the arenas, not the actors’(Beier and Brost2010), that is, conserving geophysical features that contain diverse or important plant and animal assemblages, because climate change will change ecological communities (Ruddock et al.2013). Beier and Brost (2010) advo-cated the use of land facets (recurring landscape units with identical topographic and soil attributes) when designing reserves for a changing climate, instead of climatic modeling or approaches based on mapped species ranges. The second approach assumed that EFs depend on natural processes and the interactions between biotic and abiotic elements and that integrat-ing stable biophysical characteristics with land cover allow a complete analysis of the landscape, when data for individual EFs were not available (Figure 3(d)). TUs were defined to be the basis of mapping remain-ing EFs (Figure 3(c)), according to the following rationale.
3.3.1 TUs’definition
Landscapes may be characterized for planning pur-poses by stable biophysical characteristics and related functions and processes and by manageable land-use patterns and related functions and processes (Fernandes et al. 2014). Ruddock et al. (2013) mapped ecological land units (relatively homoge-neous associations of landforms and geomorphologic compositions) based on data for landform, soil drai-nage and surface texture, and open water. Fernandes et al. (2014) mapped ecological reference units (ERUs) (combinations of stable biophysical variables defining a homogeneous reference system) based on geology, morphology, soil potential productivity, cli-mate, internal drainage areas and their respective watersheds and ravines and similar water courses.
The ERUs proposed by Fernandes et al. (2014) and the land covers proposed by Moreira (2013, unpub-lished data) were combined to define the TUs for Pico Island (Table 2). These two layers were overlaid using ArcGIS (version 10.3) ‘union’ and ‘dissolve’
tools, to obtain one map with the TUs (Figure B1,
Appendix B). The selection of features (morphocli-matic, soil, land cover, or others) to define TUs is dependent on the study site, on available geospatial data and on the level of detail to be represented in each TU, which can be adapted to other contexts.
This study was exploratory with the objective of devel-oping a practical methodology, so ERUs and land covers were simplified to decrease the final number of TUs. Morphoclimatic features depending on climatic variables
(precipitation, humidity and wind) were grouped to form a middle zone around the island: a ring between Mount Pico and the remaining areas closer to the coast (Table 2). Land cover is also influenced by geology, so the geological types from Fernandes et al. (2014) were not used in the present study, avoiding redundancy and decreasing the number of TUs.
A soil map is not available for Pico Island, only the Soil Quality Map (Pinheiro et al. 1987, unpublished data) which represents the suitability of soils for agriculture, classed on a scale of I–VII, and referen-cing particular limiting factors (soil subclasses), such as risk of erosion or limitation of the rooting zone. Pico Island lacks classes I and II, the most suitable for agriculture. The selected EFs already comprised func-tions protecting agriculture, so only soil subclasses were used to define TUs.
Some of the land covers from Moreira (2013, unpublished data) were also aggregated following the same rationale for simplification. Areas covered by exotic forest species were merged, despite having distinct behaviors and different economic objectives. Endemic macaronesian heath and areas of Myrica faya were also combined, because they are mainly native species.
3.4. Exploratory data analysis and mapping EFs
At this point, EFs for which we had existing geospa-tial data were mapped and it was necessary to map the remaining EFs.
Table 1.Ecosystem functions (EFs) contributing to ecological structure objectives.
Natural regulation functions
Capacity of ecosystems to regulate natural ecological processes and the systems that support life on Earth, through biogeochemical cycles and other processes of the biosphere
1 Local climatic regulation Role of ecosystems (e.g., influence of land cover) in regulating temperature, rainfall and other climatic processes at the local level
2 Chemical regulation of the local atmosphere
Role of ecosystems in the regulation of atmospheric chemical composition (e.g., balance between O2and CO2and other greenhouse gases). Carbon storage was considered for a particular function 2.1 Carbon storage Role of ecosystems in carbon storage
3 Nutrient regulation and maintenance of soil fertility
Role of natural processes in the storage and cycling of nutrients and maintaining soil fertility
4 Soil formation Role of ecosystems in organic material accumulation, chemical weathering of rocks and soil formation and regeneration
5 Soil retention Role of ecosystems (e.g., vegetation root matrix and soil biota) in soil retention to prevent erosion and landslides
6 Mitigation of extreme coastal events Influence of terrestrial ecosystems in dampening extreme coastal events (e.g., coastal flooding, winds, and sea spray)
7 Regulation of flow of inland waters Influence of terrestrial ecosystems, topography, soils and hydrological conditions on the spatial and temporal distribution of inland waters, regulating flow and contributing to flood prevention 8 Surface-water catchment Role of ecosystems in capturing and retaining surface water (natural reservoirs)
9 Groundwater recharge Role of ecosystems in water infiltration and aquifer recharge
Support functions
Local habitats providing species occurrence, refugia and breeding and nursery grounds for plants and animals, and ecosystems contributing to biological conservation and the preservation of genetic diversity and natural evolutionary processes
10 Local habitats Natural and semi-natural ecosystems providing habitat for resident species important for conservation 11 Refugium and nursery Ecosystems providing refugia and suitable places for feeding, breeding and raising young for transient species 12 Maintenance of natural evolutionary
processes
Contribution of natural ecosystems to maintaining natural evolutionary processes and preserving native biological and genetic diversity
Cultural functions
Capacity of ecosystems to provide intangible benefits, such as landscape aesthetic value, artistic and spiritual inspiration, historical and educational values and the‘sense of place’
13 Landscape attractiveness Landscapes with attractive features, with aesthetic qualities based on, for example, structural diversity, quiet and‘greenness’
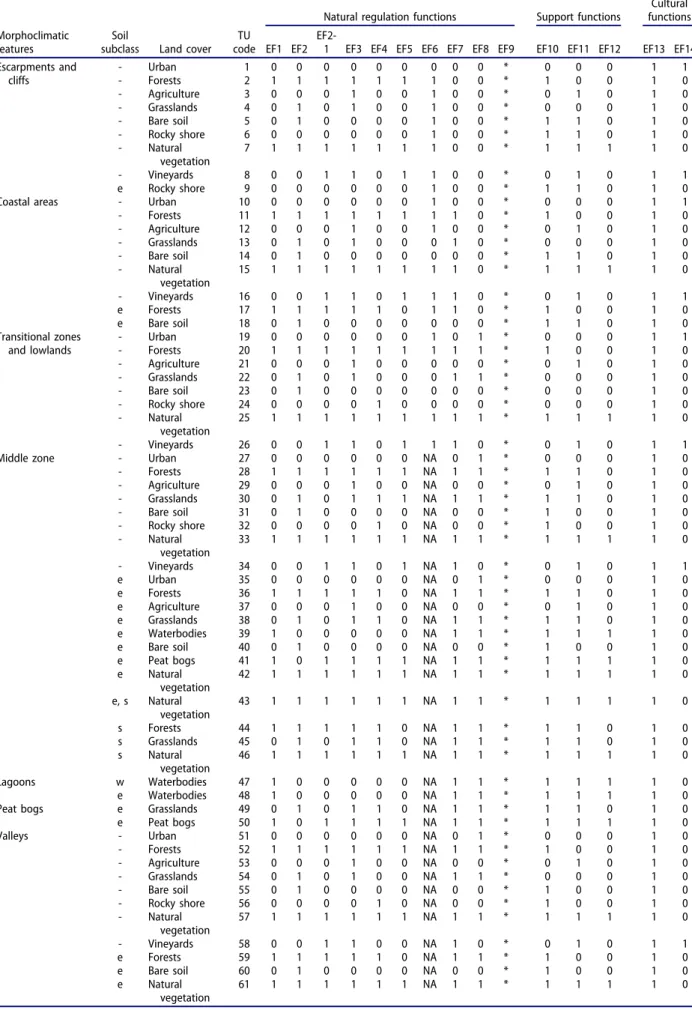
TUs were used as cartographic units to assign each remaining EF (Figure 3(d)). Having in consideration the set of selected features to define TUs and the characteristics of each TU, each EF was identified and assigned as present or absent in each TU (Table 3). A value of 0 is assigned if the EF is absent and a value of 1 is assigned if the EF is present. The table resulting from this procedure, with all EFs assigned to all TUs, was used to join to the TUs shapefile (Figure 3(e)). This allows integrating several EFs resulting in one shapefile that includes all the information in each polygon (morphoclimatic fea-tures, soil subclasses, land cover and EFs).
Several assessments were possible with this infor-mation. For this study, four maps were created (Figure 4), one with the total number of EFs and one with total number of EFs in each main category of EFs (natural regulation, support and cultural func-tions). All cartographic operations and analyses were performed using ArcGIS software (version 10.3).
Vergílio, Fonseca, et al. (2016) analyzed the effi-ciency of current PAs for meeting individual conser-vation targets (based on the context of each species in the archipelago and its current conservation status) and identified alternative or complementary areas relevant for the conservation of species on Pico Island. These areas were ranked in four quartiles. The quartile with the highest value for conservation was used to overlay the map with the total number of EFs in order to analyze to what extent these areas
overlap a high number of EFs. A similar procedure and analysis was used with existing PAs to overlay the map with the total number of EFs.
3.5. Validation
The value of integrating experts’opinion into spatial planning (Knight et al. 2006; Lehtomäki and Moilanen 2013), including in the design of ESt (Snäll et al. 2016), is widely recognized. In this study, experts were queried also to avoid personal biases.
Local experts were asked to contribute their deep knowledge on the Azores and, specifically in Pico Island, to validate different steps of the methodology (Figure 3). Firstly, they were asked to validate the selection of EFs and to identify if any were not logical and appropriate, or if any were missing given the objectives of the ESt. Secondly, they were asked to validate TUs, namely the adopted aggregation process to decrease number of TUs. Finally, experts were asked to validate the assignment of each EFs to each TU. The expert input was obtained through indivi-dual interviews. Final decisions and outputs were made according to the majority if no consensus existed among the interviewees.
Selected experts were researchers working specifi-cally in the Azores archipelago with knowledge of the scientific issues of each EF (e.g., volcanology and geology, hydrological resources, soils, biodiversity
Table 2.Stable biophysical features and land-cover classes used to define territorial units (TUs). Morphoclimatic features (adapted from Fernandes et al. (2014))
Escarpments and cliffs A narrow strip along the coast, mainly rocky
Coastal areas Coastal areas inland from escarpments and cliffs, generally reaching 30 or 40 m in altitude Transitional zones and
lowlands
Strip immediately inland from the coastal areas, generally between 30–40 and 200 m
Middle zone Strip immediately inland from the transitional zones to the base of Mount Pico, generally between 200 and 1100 m
Lagoons Lagoons
Peat bogs Peat bogs
Valleys Narrow valleys generally with non-permanent and torrential streams
Marshes Marshes are mainly located along the middle zone, following the distribution of lagoons; a few marshes are also located in the transitional zones and lowlands
Mount Pico Mount Pico, above 1100 m
Soil subclasses (from the use-capacity map of Pinheiro et al. (1987, unpublished data)) - Without limitations
w Soils for which excess water is the dominant hazard or limitation affecting their use (e.g., drenching) e Soils for which the susceptibility to erosion is the dominant problem or hazard affecting their use
s Soils that have limitations within the rooting zone (e.g., shallowness of the rooting zone, stones, low moisture-holding capacity, low fertility that is difficult to correct and high salinity or sodium content)
e, s Soils with high susceptibility to erosion and limitations within the rooting zone Land cover (adapted from Moreira (2013, unpublished data))
Urban Urban areas and roads Agriculture Areas covered with crops Vineyards Areas covered with vineyards Grasslands Intensive and semi-natural grasslands
Forests Areas covered with exotic forest species for production (C.japonica,E.globulusandPinus pinaster) and with mainly exotic species with invasive character (Pittosporum undulatumandAcacia melanoxylon)
Rocky shore Rocky shoreline
Bare soil Open spaces without vegetation Waterbodies Lagoons and other natural waterbodies
Alpine and boreal heath Areas covered with natural vegetation adapted to higher altitudes in the crater and on the mountain Peat bogs Peat bogs
Table 3.EFs assigned to each TU: 1, each function present in each TU; 0, absence of the function in each TU.
Morphoclimatic features
Soil
subclass Land cover TU code
Natural regulation functions Support functions
Cultural functions
EF1 EF2
EF2-1 EF3 EF4 EF5 EF6 EF7 EF8 EF9 EF10 EF11 EF12 EF13 EF14 Escarpments and
cliffs
- Urban 1 0 0 0 0 0 0 0 0 0 * 0 0 0 1 1
- Forests 2 1 1 1 1 1 1 1 0 0 * 1 0 0 1 0
- Agriculture 3 0 0 0 1 0 0 1 0 0 * 0 1 0 1 0
- Grasslands 4 0 1 0 1 0 0 1 0 0 * 0 0 0 1 0
- Bare soil 5 0 1 0 0 0 0 1 0 0 * 1 1 0 1 0
- Rocky shore 6 0 0 0 0 0 0 1 0 0 * 1 1 0 1 0
- Natural vegetation
7 1 1 1 1 1 1 1 0 0 * 1 1 1 1 0
- Vineyards 8 0 0 1 1 0 1 1 0 0 * 0 1 0 1 1
e Rocky shore 9 0 0 0 0 0 0 1 0 0 * 1 1 0 1 0
Coastal areas - Urban 10 0 0 0 0 0 0 1 0 0 * 0 0 0 1 1
- Forests 11 1 1 1 1 1 1 1 1 0 * 1 0 0 1 0
- Agriculture 12 0 0 0 1 0 0 1 0 0 * 0 1 0 1 0
- Grasslands 13 0 1 0 1 0 0 0 1 0 * 0 0 0 1 0
- Bare soil 14 0 1 0 0 0 0 0 0 0 * 1 1 0 1 0
- Natural vegetation
15 1 1 1 1 1 1 1 1 0 * 1 1 1 1 0
- Vineyards 16 0 0 1 1 0 1 1 1 0 * 0 1 0 1 1
e Forests 17 1 1 1 1 1 0 1 1 0 * 1 0 0 1 0
e Bare soil 18 0 1 0 0 0 0 0 0 0 * 1 1 0 1 0
Transitional zones and lowlands
- Urban 19 0 0 0 0 0 0 1 0 1 * 0 0 0 1 1
- Forests 20 1 1 1 1 1 1 1 1 1 * 1 0 0 1 0
- Agriculture 21 0 0 0 1 0 0 0 0 0 * 0 1 0 1 0
- Grasslands 22 0 1 0 1 0 0 0 1 1 * 0 0 0 1 0
- Bare soil 23 0 1 0 0 0 0 0 0 0 * 0 0 0 1 0
- Rocky shore 24 0 0 0 0 1 0 0 0 0 * 0 0 0 1 0
- Natural vegetation
25 1 1 1 1 1 1 1 1 1 * 1 1 1 1 0
- Vineyards 26 0 0 1 1 0 1 1 1 0 * 0 1 0 1 1
Middle zone - Urban 27 0 0 0 0 0 0 NA 0 1 * 0 0 0 1 0
- Forests 28 1 1 1 1 1 1 NA 1 1 * 1 1 0 1 0
- Agriculture 29 0 0 0 1 0 0 NA 0 0 * 0 1 0 1 0
- Grasslands 30 0 1 0 1 1 1 NA 1 1 * 1 1 0 1 0
- Bare soil 31 0 1 0 0 0 0 NA 0 0 * 1 0 0 1 0
- Rocky shore 32 0 0 0 0 1 0 NA 0 0 * 1 0 0 1 0
- Natural vegetation
33 1 1 1 1 1 1 NA 1 1 * 1 1 1 1 0
- Vineyards 34 0 0 1 1 0 1 NA 1 0 * 0 1 0 1 1
e Urban 35 0 0 0 0 0 0 NA 0 1 * 0 0 0 1 0
e Forests 36 1 1 1 1 1 0 NA 1 1 * 1 1 0 1 0
e Agriculture 37 0 0 0 1 0 0 NA 0 0 * 0 1 0 1 0
e Grasslands 38 0 1 0 1 1 0 NA 1 1 * 1 1 0 1 0
e Waterbodies 39 1 0 0 0 0 0 NA 1 1 * 1 1 1 1 0
e Bare soil 40 0 1 0 0 0 0 NA 0 0 * 1 0 0 1 0
e Peat bogs 41 1 0 1 1 1 1 NA 1 1 * 1 1 1 1 0
e Natural vegetation
42 1 1 1 1 1 1 NA 1 1 * 1 1 1 1 0
e, s Natural vegetation
43 1 1 1 1 1 1 NA 1 1 * 1 1 1 1 0
s Forests 44 1 1 1 1 1 0 NA 1 1 * 1 1 0 1 0
s Grasslands 45 0 1 0 1 1 0 NA 1 1 * 1 1 0 1 0
s Natural vegetation
46 1 1 1 1 1 1 NA 1 1 * 1 1 1 1 0
Lagoons w Waterbodies 47 1 0 0 0 0 0 NA 1 1 * 1 1 1 1 0
e Waterbodies 48 1 0 0 0 0 0 NA 1 1 * 1 1 1 1 0
Peat bogs e Grasslands 49 0 1 0 1 1 0 NA 1 1 * 1 1 0 1 0
e Peat bogs 50 1 0 1 1 1 1 NA 1 1 * 1 1 1 1 0
Valleys - Urban 51 0 0 0 0 0 0 NA 0 1 * 0 0 0 1 0
- Forests 52 1 1 1 1 1 1 NA 1 1 * 1 0 0 1 0
- Agriculture 53 0 0 0 1 0 0 NA 0 0 * 0 1 0 1 0
- Grasslands 54 0 1 0 1 0 0 NA 1 1 * 0 0 0 1 0
- Bare soil 55 0 1 0 0 0 0 NA 0 0 * 1 0 0 1 0
- Rocky shore 56 0 0 0 0 1 0 NA 0 0 * 1 0 0 1 0
- Natural vegetation
57 1 1 1 1 1 1 NA 1 1 * 1 1 1 1 0
- Vineyards 58 0 0 1 1 0 0 NA 1 0 * 0 1 0 1 1
e Forests 59 1 1 1 1 1 0 NA 1 1 * 1 0 0 1 0
e Bare soil 60 0 1 0 0 0 0 NA 0 0 * 1 0 0 1 0
e Natural vegetation
61 1 1 1 1 1 1 NA 1 1 * 1 1 1 1 0
and spatial planning). Approximately the same num-ber of experts (2–3) was consulted for each scientific issue, and most opinions were consensual.
4. Results
4.1. Mapping EFs
The combination of the morphoclimatic features, soil subclasses and land covers on Pico Island pro-duced 86 TUs (Table 3; see Appendix B for Figure B1 and more details). The assignment of EFs to each TU, after validation by experts, is summarized in Table 3.
Local climatic regulation (EF1) was assigned to Mount Pico as one main element of relief on the island contributing to the climatic conditions. Other elements (e.g., waterbodies, peat bogs and well-devel-oped vegetation) were also assigned to EF1 because they contribute to the local climatic conditions such as temperature and humidity balance.
Raich and Potter (1995) estimated that the annual flux of carbon dioxide (CO2) from soils to the
atmo-sphere was larger than terrestrial net primary produc-tivity. The rates of soil CO2efflux are generally lower
from wetlands than from better drained sites, because
high moisture levels inhibit aerobic respiration. Raich and Potter (1995) also reported that CO2emissions did
not differ significantly between broadleaved and con-iferous trees. Highly disturbed areas have lower rates of soil CO2efflux. The function of the chemical regulation
of the local atmosphere (EF2) was thus assigned to grasslands (including emissions from cattle), forests and areas of natural vegetation and bare soil, except those in wetlands (such as peat bogs and marshes).
The carbon-storage function (EF2-1) was assigned to the areas with higher amounts of carbon storage based on the data reported by Vergílio, Fjøsne, et al. (2016): vineyards, forests, peat bogs and areas of nat-ural vegetation. Grasslands and agricultnat-ural land were not assigned to EF2-1 due to less carbon storage and the frequent rotation of crops and removal of biomass. The function of nutrient regulation and mainte-nance of soil fertility (EF3) was assigned to agricul-tural land (artificial input from fertilizers), vineyards, grasslands, forests, areas with alpine and boreal heath, peat bogs and areas of natural vegetation. This func-tion was also assigned to waterbodies in marshes due to the seasonal drenching that releases nutrients.
Soil formation (EF4) was generally assigned to forests, areas with alpine and boreal heath, peat bogs and areas of natural vegetation. This function
Table 3.(Continued).
Morphoclimatic features
Soil
subclass Land cover TU code
Natural regulation functions Support functions
Cultural functions
EF1 EF2
EF2-1 EF3 EF4 EF5 EF6 EF7 EF8 EF9 EF10 EF11 EF12 EF13 EF14
Marshes - Urban 62 0 0 0 0 0 0 NA 0 1 * 0 0 0 1 0
- Forests 63 1 0 1 1 1 1 NA 1 1 * 1 1 0 1 0
- Agriculture 64 0 0 0 1 0 0 NA 0 0 * 0 1 0 1 0
- Grasslands 65 0 0 0 1 1 1 NA 1 1 * 1 1 0 1 0
- Waterbodies 66 1 0 0 1 1 0 NA 1 1 * 1 1 1 1 0
- Bare soil 67 0 0 0 0 0 0 NA 0 0 * 1 0 0 1 0
- Peat bogs 68 1 0 1 1 1 1 NA 1 1 * 1 1 1 1 0
- Natural vegetation
69 1 0 1 1 1 1 NA 1 1 * 1 1 1 1 0
- Vineyards 70 0 0 1 1 0 1 NA 1 0 * 0 1 0 1 1
e Forests 71 1 0 1 1 1 0 NA 1 1 * 1 1 0 1 0
e Grasslands 72 0 0 0 1 1 0 NA 1 1 * 1 1 0 1 0
e Waterbodies 73 1 0 0 1 1 0 NA 1 1 * 1 1 1 1 0
e Bare soil 74 0 0 0 0 0 0 NA 0 0 * 1 0 0 1 0
e Peat bogs 75 1 0 1 1 1 1 NA 1 1 * 1 1 1 1 0
e Natural vegetation
76 1 0 1 1 1 1 NA 1 1 * 1 1 1 1 0
s Grasslands 77 0 0 0 1 1 0 NA 1 1 * 1 1 0 1 0
s Natural vegetation
78 1 0 1 1 1 1 NA 1 1 * 1 1 1 1 0
Mount Pico - Alpine and boreal heath
79 1 0 0 1 1 1 NA 1 1 * 1 1 1 1 0
- Bare soil 80 1 1 0 0 0 0 NA 0 0 * 1 0 0 1 0
e Grasslands 81 1 1 0 1 1 0 NA 1 1 * 1 1 0 1 0
e Bare soil 82 1 1 0 0 0 0 NA 0 0 * 1 0 0 1 0
e Natural vegetation
83 1 1 1 1 1 1 NA 1 1 * 1 1 1 1 0
e, s Alpine and boreal heath
84 1 0 0 1 1 0 NA 1 1 * 1 1 1 1 0
e, s Bare soil 85 1 1 0 0 0 0 NA 0 0 * 1 0 0 1 0
s Grasslands 86 1 1 0 1 1 0 NA 1 1 * 1 1 0 1 0
was also assigned to waterbodies in marshes due to the seasonal drenching that contributes to soil forma-tion; to rocky shores in transitional zones and low-lands, in the middle zone, valleys and marshes; and to grasslands on Mount Pico, in the middle zone, peat bogs and marshes, because the grasslands in these areas are usually permanent or semi-natural with less human intervention.
Soil retention (EF5) was generally assigned to peat bogs and areas of natural vegetation because these areas usually have dense and continuous soil cover with well-developed herbaceous and/or arbustive substrates. When soil subclasses had no limitations, this function was also assigned to vineyards on
escarpments and cliffs and in coastal areas, marshes and transitional zones and lowlands; to areas with alpine and boreal heath; to forests and to grasslands at higher altitudes (middle zone, marshes and Mount Pico), because these areas usually contain semi-nat-ural grasslands with less human intervention.
The mitigation of extreme coastal events (EF6) was only assigned to areas at lower altitudes: escarpments and cliffs, coastal areas and transitional zones and lowlands. Escarpments and cliffs were included regardless of land cover (except for urban areas), because these areas are obstacles to direct waves. Coastal areas included urban centers, agricultural land, vineyards, forests and areas of natural
vegetation. Transitional zones and lowlands included urban centers, vineyards, forests and areas of natural vegetation, because these land covers contribute to the mitigation of, for example, sea spray and winds.
The regulation of the flow of inland waters (EF7) was generally assigned to vineyards (due to the stone walls that slow water runoff), grasslands, forests, lagoons and other waterbodies, areas with alpine and boreal heath, peat bogs and areas of natural vegetation. The function of surface-water catchment (EF8) was assigned to the areas contributing to the reten-tion of water for natural availability: grasslands, for-ests, lagoons and other waterbodies, areas with alpine and boreal heath, peat bogs and areas of natural vegetation, except on escarpments and cliffs and in coastal areas.
The function of groundwater recharge (EF9) was mapped based on the data reported by Cruz et al. (2011), and value‘1ʹ was assigned to polygons where the function was present.
The function of local habitats (EF10) was assigned to areas containing native species. These areas gener-ally included forests, lagoons and other waterbodies, areas with alpine and boreal heath, peat bogs and areas of natural vegetation. This function was also assigned to rocky shores and areas of bare soil on escarpments and cliffs and in coastal areas (containing, e.g., marine species) on Mount Pico (where smaller species may be found, such as mosses and fungi) and in the middle zone, valleys and marshes; and to grasslands at higher altitudes in the middle zone and marshes and on Mount Pico, because these grasslands are usually semi-natural with less human intervention.
The function of refugia and nurseries (EF11) was generally assigned to agricultural land, vineyards, lagoons and other waterbodies, areas with alpine and boreal heath, peat bogs and areas of natural vegetation. EF11 was also assigned to forests at higher altitudes (which usually do not include invasive spe-cies) in the middle zone; and to rocky shores, areas of bare soil on escarpments and cliffs and in coastal areas, where, for example, migratory species nest.
The maintenance of natural evolutionary processes (EF12) was only assigned to natural and native eco-systems: lagoons and other waterbodies, areas with alpine and boreal heath, peat bogs and areas of nat-ural vegetation.
The function of landscape attractiveness (EF13) was assigned to the entire island without discrimina-tion among the ecosystems because of the excepdiscrimina-tional scenic quality of the landscape on Pico Island and because the attractiveness of the landscape depends on the observer.
Pico Island is known for its vineyards (some clas-sified as a UNESCO world heritage site) composed of many small rectangular and contiguous plots (‘ cur-rais’in Portuguese) divided by walls of volcanic rock. Most of these areas are near villages in coastal areas, where other cultural elements may be found, such as small wineries. The function of cultural heritage (EF14) was therefore assigned to vineyards and urban areas in the coastal zone (escarpments and cliffs, coastal areas and transitional zones and lowlands).
The map showing the total number of functions is presented inFigure 4(a) and maps of the numbers of natural regulation, support and cultural functions are presented in Figure 4(b, c,d), respectively. Maps of each EF (Figure C1) are presented inAppendix C.
EFs were assigned to the entire area of Pico Island (Table 4). Areas with 12 overlapping functions (24.30% of the total area) were mainly in transitional zones and lowlands covered by forests, and 10 over-lapping functions (22.33%) were mainly in the middle zone of Pico Island covered by semi-natural grass-lands. Areas with 13 functions (8.47%) were mainly in coastal areas and transitional zones and lowlands covered by natural vegetation (mostlyM. faya) and in the middle zone, also covered by natural vegetation (mostly endemic macaronesian heath). Areas with 14 functions (1.54%) were mainly in coastal areas cov-ered by natural vegetation. Fewer overlapping func-tions occurred mainly in urban areas, agricultural land, rocky shores and areas of bare soil.
Table 4.Areas of the number (No.) of functions on Pico Island.
All functions Natural regulation functions Support functions Cultural functions
No. Area (ha) No. Area (ha) No. Area (ha) No. Area (ha)
2 50.85 (0.11%) 0 2.63 (0.01%) 0 2414.31 (5.43%) 1 42,099.28 (94.65%) 3 2791.64 (6.28%) 1 3192.64 (7.18%) 1 14,554.07 (32.72%) 2 2380.55 (5.35%) 4 1632.44 (3.67%) 2 1361.30 (3.06%) 2 21,784.26 (48.98%) Total: 44,479.82 5 2609.43 (5.87%) 3 1322.80 (2.97%) 3 5727.19 (12.88%)
6 170.35 (0.38%) 4 1359.35 (3.06%) Total: 44,479.82 7 128.79 (0.29%) 5 4264.57 (9.59%)
8 4100.75 (9.22%) 6 4325.02 (9.72%) 9 4336.40 (9.75%) 7 9519.56 (21.40%) 10 9933.53 (22.33%) 8 3122.98 (7.02%) 11 3466.30 (7.79%) 9 8944.99 (20.11%) 12 10,806.80 (24.30%) 10 7063.98 (15.88%) 13 3768.61 (8.47%) Total: 44,479.82 14 683.94 (1.54%)
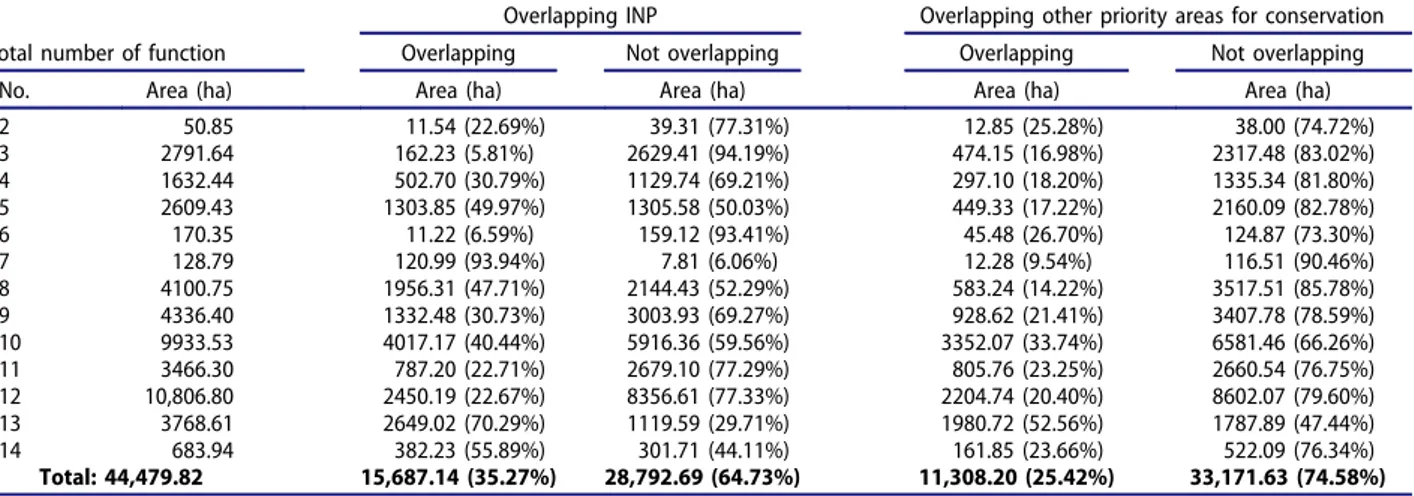
Table 5.Total number (No.) of EFs overlapping and not overlapping Pico’s INP and other priority areas for conservation.
Total number of function
Overlapping INP Overlapping other priority areas for conservation Overlapping Not overlapping Overlapping Not overlapping
No. Area (ha) Area (ha) Area (ha) Area (ha) Area (ha)
2 50.85 11.54 (22.69%) 39.31 (77.31%) 12.85 (25.28%) 38.00 (74.72%) 3 2791.64 162.23 (5.81%) 2629.41 (94.19%) 474.15 (16.98%) 2317.48 (83.02%) 4 1632.44 502.70 (30.79%) 1129.74 (69.21%) 297.10 (18.20%) 1335.34 (81.80%) 5 2609.43 1303.85 (49.97%) 1305.58 (50.03%) 449.33 (17.22%) 2160.09 (82.78%) 6 170.35 11.22 (6.59%) 159.12 (93.41%) 45.48 (26.70%) 124.87 (73.30%) 7 128.79 120.99 (93.94%) 7.81 (6.06%) 12.28 (9.54%) 116.51 (90.46%) 8 4100.75 1956.31 (47.71%) 2144.43 (52.29%) 583.24 (14.22%) 3517.51 (85.78%) 9 4336.40 1332.48 (30.73%) 3003.93 (69.27%) 928.62 (21.41%) 3407.78 (78.59%) 10 9933.53 4017.17 (40.44%) 5916.36 (59.56%) 3352.07 (33.74%) 6581.46 (66.26%) 11 3466.30 787.20 (22.71%) 2679.10 (77.29%) 805.76 (23.25%) 2660.54 (76.75%) 12 10,806.80 2450.19 (22.67%) 8356.61 (77.33%) 2204.74 (20.40%) 8602.07 (79.60%) 13 3768.61 2649.02 (70.29%) 1119.59 (29.71%) 1980.72 (52.56%) 1787.89 (47.44%) 14 683.94 382.23 (55.89%) 301.71 (44.11%) 161.85 (23.66%) 522.09 (76.34%)
Total: 44,479.82 15,687.14 (35.27%) 28,792.69 (64.73%) 11,308.20 (25.42%) 33,171.63 (74.58%)
Some small patches (0.01%) corresponding to urban areas on escarpments and cliffs and areas of bare soil in marshes were not assigned natural ulation functions. The largest areas with natural reg-ulation functions have 10, 9 or 7 functions occurring simultaneously (15.88%, 20.11% and 21.40%, respec-tively). Areas with 10 functions were mainly in coastal areas and transitional zones and lowlands covered by forests and natural vegetation; 9 functions were mainly in the middle zone covered by forests and natural vegetation; and 7 functions were also mainly in the middle zone of the island but covered mostly by grasslands. Areas with no support func-tions (5.43%) corresponded mostly to urban areas in coastal areas and in transitional zones and lowlands. A few more intensively managed grassland areas were also not assigned support functions. Most of the island (81.70%) was assigned one or two support functions (32.72% and 48.98%, respectively). Areas with one support function were mainly in coastal zones and in transitional zones and lowlands, and areas with two functions were mainly in the middle zone and marshes. Areas with all support functions (12.88%) were mainly covered by natural vegetation,
both M. faya and endemic macaronesian heath.
Cultural functions were present on the entire island, with two cultural functions (5.35%) mainly in coastal zones and in transitional zones and lowlands contain-ing urban areas.
4.2. EFs, the INP and other areas for conservation
Most areas with the higher number of functions occurring simultaneously (14 and 13 functions with 55.89% and 70.29%, respectively) were in the INP (Figure 5(a) and Table 5), mainly coincident with nature reserves and protected landscapes for vineyard culture (see Figure A1 Appendix A for the locations of the classified PAs). Nature reserves on Mount Pico, however, were assigned only five functions. Areas with 12 and 11 functions were mainly outside the INP (22.67% and 22.71%, respectively) and were cov-ered mostly by forests. Additionally, areas with seven functions were mostly in the INP (93.94%) corre-sponding to marshes. Areas with fewer functions (two, three or four functions overlapping simulta-neously) were mainly outside the INP (77.31%, 94.19% and 69.21%, respectively), containing mostly urban areas and forests in coastal zones and in tran-sitional zones and lowlands.
Areas with higher number of functions occurring simultaneously were both inside and outside the priority areas for the conservation of species (Figure 5(b)). Areas with 13 functions were mainly inside priority areas (52.56%), and areas with 14, 12
and 11 functions were mainly outside priority areas (76.34%, 79.60% and 76.75%, respectively) (Table 5).
5. Discussion
The main goal of this study was to contribute to implement the methodology proposed by Vergílio and Calado (2016), that is, identifying and mapping EFs to be integrated in the design of the ESt, in an expeditious way and easy to use for decision-makers, for territories lacking detailed data on biodiversity and individual studies on ecosystem functions and services.
In this case study of Pico Island, the areas of natural vegetation, peat bogs, and forests had higher total numbers of EFs. From the point of view of conservation, this result highlights the importance of natural areas with native species on Pico Island. More functions can provide more and better ecosys-tem services. Thus, caution is needed when licensing human activities to explore these areas. As mentioned previously, Vergílio and Calado (2016) suggested that ESt should cover the entire island, integrating a
‘priority ESt’ (that aggregates legally constrained areas) and a ‘secondary ESt’ (with less sensitive areas). Assuming that the priority ESt ensures enough constraints to activities to preserve the ecosystems, the secondary ESt must be able to combine human activities with the capacity of the ecosystems to accommodate such activities. For example, the assignment of EFs to production forests (with
Cryptomeria or Eucalyptus) or invasive forests (with mainly Pittosporum and Acacia) is similar; however, their behavior is completely different from the point of view of territorial management. Production forests, despite having less biodiversity, may be used by sev-eral species as refugia or nurseries without signifi-cantly threatening other natural habitats. Invasive forest species, in contrast, have a high capacity to invade other areas in the Azores, especially aban-doned lands, even if they are used by other species (e.g., as refugia or nurseries). The decreasing human population on Pico Island and concomitant abandon-ment of managed lands may contribute to amplify this process. Activities in invasive forests should thus be promoted, but only when the invasion can be reverted or at least controlled.
and the selection of EFs also considered other aspects of the environment. Despite this discrepancy, one may point out the potential of using EFs to identify and/or corroborate areas with possible connectivity between PAs and other priority areas for conserva-tion (black arrows in Figure 5). These areas of con-nectivity are important because careful management may be applied without adding new legal restrictions to human activities but adapting human actions to minimize impact to the ecosystem processes.
This exploratory methodology presented both lim-itations and advantages. One of the major benefits is the possibility to integrate several EFs in a relatively simple way to be implemented by decision-makers with available expert knowledge, despite the absence of particular studies about each EF. The methodology is applicable to islands that have been scientifically studied or where experts are available for collabora-tion. The presence of a university system in the Azores with broad scientific expertise allows for the validation of assumptions, the listing of EFs and the assignment to each TU. Another advantage of the methodology is its dynamics, which enables its adap-tation to other territories and modification over time, because it enables improvements by experts (it inte-grates sectoral information that may be included as more information becomes available).
The selection of functions in the proposed metho-dology was adapted to the study area, and the defini-tion of TUs was a critical step. A too general definidefini-tion of TUs would simplify the assignment of functions and produce a general map less able to support decision-making. TUs based on many biophysical features could increase the number of TUs and complicate function assignment. Finding a balance for selecting biophysical features used to define TUs is fundamental and will mainly depend on the objectives of the study. In this particular case study, it could have been useful to have more biophysical or more detailed features. For example, having more categories of land cover, such as production forests separated from invasive forests, could help distinguishing areas whose EFs might be more threatened or not.
Assuming that well-functioning ecosystems are able to provide services to communities, the metho-dology allows the identification of areas with more functions that will potentially contribute the most to provide those services. However, the presence of only one or two critical functions, either for the function-ing of the ecosystem itself or for providfunction-ing particular services to societies, may be as important as the pre-sence of several other functions. Hansen and Pauleit (2014) explored how multifunctionality can be oper-ationalized by approaches developed and tested in ecosystem services research, specifically as a contri-bution to assess the integrity of green infrastructure networks for urban areas. These authors posit that
potential conflicts between ecosystem services might be overlooked if multifunctionality is understood only ‘as a quantitative sense of the more functions the better.’They also advert for the potential increase of environmental injustice for particular groups of society, if the capacity of ecosystems to provide ser-vices and social questions of demand and access to those benefits are assessed and planned indepen-dently. These authors suggest the integration of a broad range of ecological and social aspects to meet the holistic goals of green infrastructure planning. One advantage of the approach proposed in the pre-sent study is the integration of both perspectives of nature conservation (by integrating functions for the internal balance of ecosystems) and community development (by integrating functions with interest for societies). Processes integrating these two per-spectives might, however, produce multiple and con-flicting interests, hindering the decision on what kind of human actions to allow in a certain area with high value for both species conservation and the develop-ment of human activities.
stakeholders to answer questions such as: is the num-ber of functions more important than the type of functions; how many functions are fundamental to preserve; if all areas are important, which ones are the most important?
Some aspects, however, have to be considered when adopting an MCDM in the Azores for design-ing the ESt. Independent of the technique adopted, there might be the need to inform stakeholders about the theoretical concepts and objectives. Considering that several environmental aspects will be discussed and the complexity of ecosystems and effects of human actions, this will allow everyone involved to be able to ‘speak the same language’ and give rea-soned opinions. Considering the diversity of stake-holders that might be involved and their different backgrounds, the information should be as simple and clear as possible in order to avoid misunder-standings. A successful stakeholder engagement pro-cess contributing to design the ESt might be crucial to successfully implement it, as suggested by Kopperoinen et al. (2014):
By involving both experts and local and regional actors in assessing ES [ecosystem services] provision potential we can add local knowledge to the general scientific understanding. (. . .) The group discussions involved in our method provided an additional ben-efit, as the experts and local and regional actors felt that this discussion platform enhanced their under-standing of both GI [green infrastructure] and ES [ecosystem services].
This paper is a first contribution for the Azores to include EFs into ESt design in a practical way and applicable in the short term. Future research, how-ever, should be developed, including investing in the assessment and mapping of individual EFs. A com-prehensive knowledge of territories will greatly improve integrated management decisions and mea-sures. Future developments for the proposed metho-dology could include a more extensive expert consultation as a pilot test for ranking EFs to over-come the bias from using the number of EFs. Also, the implementation of an MCDM process will con-tribute to validate this methodology, gathering stake-holders’ perspective about its practicality. Finally, it would be interesting to explore this approach to include EFs not only in the design of the ESt, but in the overall design of the Portuguese spatial planning defined in MMPs, including other categories of EFs, such as production functions, and increasing the con-tribution of social issues.
6. Conclusion
This study presented an exploratory strategy for iden-tifying and mapping EFs on small islands. The method
contributes to the definition of ESt, one of the ele-ments integrating Portuguese MMPs. These plans are being reviewed on Pico Island, so a simple straightfor-ward methodology for ESt visualization is needed. The analysis suggests that the EFs are a useful tool that can be integrated in the procedures of spatial planning, because it provides an easy way to spatially visualize EFs, bringing a new perspective of the landscape and its potential. It also suggests that the proposed meth-odology may help to define ESt because it gives an integrated overview of ecosystems and their multiple functions, thereby contributing to the identification of the systems for protecting the values of natural, cul-tural, agricultural and forest resources, as required by Azorean legislation (Regional Legislative Decree No. 35/2012/A of 2012). MMPs are spatial plans defined at the local scale and must comply with regional legisla-tion. The primary ESt (Vergílio and Calado 2016) aggregates areas with legal protection and complies with regional legislation. The proposed methodology integrating EFs identifies the areas with more func-tions and higher potential to provide ecosystem ser-vices. The use of an MCDM technique may enable the integration of community needs and expectations, resulting in a more comprehensive process for future developments.
Acknowledgments
This work was also funded by FEDER funds through the Operational Program for Competitiveness Factors COMPETE and by National Funds through FCT -Foundation for Science and Technology under the UID/ BIA/50027/2013, POCI-01-0145-FEDER-006821 and UID/ SOC/04647/2013.
The authors would like to thank António Medeiros, who was an important source of help with the geographic infor-mation systems, and all the collaborating experts who dis-cussed and improved the application of the methodology.
Disclosure statement
No potential conflict of interest was reported by the authors.
Funding
This work was supported by Azorean Regional Fund for
Science and Technology [M3.1.2/F/007/2011]; FCT –
Foundation for Science and Technology [POCI-01-0145-FEDER-006821,UID/BIA/50027/2013,UID/SOC/04647/ 2013].
ORCID
References
Andrade C, Borges P, Freitas MC. 2006. Historical
Tsunami in the Azores Archipelago (Portugal). J Volcanology Geothermal Res. 156:172–185.
Arcidiacono A, Ronchi S, Salata S.2016. Managing multi-ple ecosystem services for landscape conservation: a green infrastructure in Lombardy region. Procedia Eng. 161:2297–2303.
Aretano R, Petrosillo I, Zaccarelli N, Semeraro T, Zurlini G. 2013. People perception of landscape change effects on ecosystem services in small Mediterranean islands: A combination of subjective and objective assessments. Landsc Urban Plan. 112:63–73.
Azevedo EB. 1996. Modelação do Clima Insular à Escala
Local–Modelo CIELO aplicado à ilha Terceira [disser-tation]. The Azores: University of Azores.
Beier P, Brost B.2010. Use of land facets to plan for climate change: conserving the arenas, not the actors. Conservation Biol. 24:701–710.
Borges PJSA.2003. Ambientes litorais nos grupos central e
oriental do arquipélago dos açores – conteúdos e
dinâmica de microescala [dissertation]. The Azores: University of the Azores.
Calado H, Braga A, Moniz F, Gil A, Vergílio M. 2015.
Spatial planning and resource use in the Azores. Mitig Adapt Strat Gl. 20:1079–1095.
Calado H, Bragagnolo C, Silva SF, Pereira M. 2014. A
multi-scale analysis to support the implementation of a regional conservation policy in a small-island archipe-lago–the Azores, Portugal. J Coastal Res. SI70:485–489.
COM.2011a. Communication from the commission to the
European parliament, the council, the European eco-nomic and social committee and the committee of the regions, Regional Policy Contributing to Sustainable Growth in Europe 2020, No. 17 Final. Brussels:
European Commission. Available from http://eur-lex.
e u r o p a . e u / l e g a l - c o n t e n t / E N / T X T / P D F / ? u r i =
CELEX:52011DC0017&qid=1436456776654&from=EN.
COM.2011b. Communication from the commission to the
European parliament, the council, the European eco-nomic and social committee and the committee of the regions, Our Life Insurance, Our Natural Capital: An EU Biodiversity Strategy to 2020, No. 244 Final. Brussels:
European Commission. Available from http://eur-lex.
e u r o p a . e u / l e g a l - c o n t e n t / E N / T X T / P D F / ? u r i =
CELEX:52011DC0244&from=EN.
COM.2013. Communication from the commission to the
European parliament, the council, the European eco-nomic and social committee and the committee of the regions, Green infrastructure (GI)–Enhancing Europe’s Natural Capital, No. 249 Final. Brussels: European
Commission. Available from: http://eur-lex.europa.eu/
legal-content/EN/TXT/?uri=COM:2013:0249:FIN.
Condé S, Richard D 2002. Biogeographical regions in
Europe. The macaronesian region – volcanic islands in
the ocean. EEA (European Environment Agency), Report No 1/2002 - Europe’s biodiversity - biogeogra-phical regions and seas. Sweden: ZooBoTech HB.
Costa H, Medeiros V, Azevedo EB, Silva L. 2013.
Evaluating ecological-niche factor analysis as a modeling tool for environmental weed management in island sys-tems. Weed Res. 53:221–230.
Costanza R, d’Arge R, De Groot R, Farber S, Grasso M, Hannon B, Limburg K, Naeem S, O’Neill RV, Paruelo J, et al.1997. The value of the world’s ecosystem services and natural capital. Nature. 387:253–260.
Cruz JV.2003. Groundwater and volcanoes: examples from the Azores archipelago. Environ Geol. 44:343–355. Cruz JV, Cabral L, Fontiela J, Coutinho R.2011. Plano de
Gestão de Recursos Hídricos de Ilha Pico. Relatório de Caracterização e Diagnóstico. Azores (portugal): Centro de Vulcanologia e Avaliação de Riscos Geológicos/ Universidade dos Açores. DTC 38/CVARG/10.
De Groot R.2006. Function-analysis and valuation as a tool to assess land use conflicts in planning for sustainable,
multi-functional landscapes. Landsc Urban Plan.
75:175–186.
De Groot R, Brander L, Van Der Ploeg S, Costanza R, Bernard F, Braat L, Christie M, Crossman N, Ghermandi A, Hein L, et al. 2012. Global estimates of the value of ecosystems and their services in monetary units. Ecosystem Serv. 1:50–61.
De Groot R, Van Der Perk J, Chiesura A, Marguliew S. 2000. Ecological functions and socio-economic values of critical natural capital as a measure for ecological integ-rity and environmental health. In: Crabbé P, Holland AJ, Ryszkowski L, Westra L, editors. Implementing ecologi-cal integrity–restoring regional and global environmen-tal and human health. Netherlands: Kluwer Academic Publishers.
De Groot R, Van Der Perk J, Chiesura A, Van Vliet V.2003. Importance and threat as determining factors for critical-ity of Natural capital. Ecological Econ. 44:187–204.
De Groot RS. 1992. Functions of nature: evaluation of
nature in environmental planning, management and decision making. Amsterdam: Wolters-Noordhoff. De Groot RS, Alkemade R, Braat L, Hein L, Willemen L.
2010. Challenges in integrating the concept of ecosystem services and values in landscape planning, management and decision making. Ecol Complex. 7:260–272.
De Groot RS, Wilson MA, Boumans RMJ.2002. A typology
for the classification, description and valuation of eco-system functions, goods and services. Ecological Econ. 41:393–408.
Decree-Law No. 46/2009 of 2009 February 20, Amends (Sixth Amendment) and republishes the Decree-Law No. 380/99 of September 22, which establishes the Portuguese Legal Framework of the territorial manage-ment instrumanage-ments (in Portuguese). Available from:
https://dre.pt/application/file/602179.
[DROTRH/IA] Direcção Regional do Ordenamento do Território e dos Recursos Hídricos/Secretaria Regional
do Ambiente.2001. Regional Plano Regional da Água–
Relatório técnico-Versão para Consulta Pública. Ponta Delgada: Direcção Regional do Ordenamento do Território e dos Recursos Hídricos/Secretaria Regional do Ambiente.
Eastwood A, Brooker R, Irvine RJ, Artz RRE, Norton LR, Bullock JM, Ross L, Fielding D, Ramsay S, Roberts J, et al.2016. Does nature conservation enhance ecosystem services delivery? Ecosystem Serv. 17:152–162.
Egoh B, Reyers B, Rouget M, Richardson DM, Le Maitre
DC, Van Jaarsveld AS. 2008. Mapping ecosystem
ser-vices for planning and management. Agric Ecosyst Environ. 127:135–140.
Ekins P, Simon S, Deutsch L, Folke C, De Groot R.2003. A framework for the practical application of the concepts of critical natural capital and strong sustainability. Ecological Econ. 44:165–185.