LONG-TERM ANNUAL FERTILIZATION WITH NITROGEN
AND POTASSIUM AFFECT YIELD AND MINERAL
COMPOSITION OF ‘FUJI’ APPLE
Gilberto Nava1*; Antonio Roque Dechen2
1
Epagri/Estação Experimental de São Joaquim, C.P. 81 - 88600-00 - São Joaquim, SC - Brasil. 2
USP/ESALQ - Depto. Ciência do Solo, C.P. 9 - 13418-900 - Piracicaba, SP - Brasil. *Corresponding author <nava@epagri.sc.gov.br>
ABSTRACT: Nitrogen (N) and potassium (K) are closely related to orchard productivity, since they are usually found in higher concentrations than others macronutrients in apple (Malus ×
domestica Borkh) fruits. This research was carried out to assess the effect of eight years of
soil additions of N and K on yield, fruit size and mineral composition of ‘Fuji’/Marubakaido apple in São Joaquim, State of Santa Catarina, Southern Brazil. A factorial design was used with N and K annual fertilizer rates (0, 50, 100, 200 kg ha–1 of N and K2O) replicated in three orchards from 1998 to 2006. Yield was estimated by multiplying the total number of fruit per tree by the mean weight of 100 randomly sampled fruit. Fifteen days prior to harvest, 24 fruit pulps were analyzed for N, K, Ca and Mg contents. Increases in yields were noticed in five and four years, due to the N and K fertilizer additions, respectively. Fruit size was more affected by K than by N fertilization. Fruit mineral composition was affected by both N and K fertilization. N concentration and N:Ca ratios were enlarged by N fertilization. K concentration and K:Ca ratios were also enlarged by K fertilization. Ca fruit concentration was reduced by N fertilization and often by K. Ca-related fruit disorders were not observed even after 180 days storage. However, N and K fertilization affected Ca nutrition. Thus, when fertilizing with N and K, it is imperative to use combined practices in order to offset the detrimental effect that these nutrients may cause on Ca concentration in the fruit.
Key words: Malus domestica Borkh, fertilization, production, nutrition
ADUBAÇÕES ANUAIS COM NITROGÊNIO E POTÁSSIO POR LONGO
PRAZO INFLUENCIAM O RENDIMENTO E A COMPOSIÇÃO
MINERAL DE MAÇÃS ‘FUJI’
RESUMO:O nitrogênio (N) e o potássio (K) são os nutrientes mais exportados pelas maçãs (Malus
domestica Borkh) e por isso estão diretamente relacionados com a produtividade dos pomares. O
objetivo desse trabalho foi avaliar a influência das adubações anuais com nitrogênio e potássio sobre o rendimento, tamanho e composição mineral de maçãs ‘Fuji’ enxertada sobre o Marubakaido. O experimento foi conduzido nos anos de 1998 a 2006, no município de São Joaquim-SC, Brasil. Consistiu de um fatorial com doses de N e K aplicadas anualmente ao solo (0, 50, 100 e 200 kg ha–1 de N e de K2O) e repetidas em três pomares comerciais. O rendimento foi estimado a partir da contagem do número total de frutos por planta e multiplicado pelo peso médio de 100 frutos amostrados aleatoriamente por parcela. Quinze dias antes da colheita, 24 frutos foram amostrados para fins de determinação das concentrações de N, K, Ca e Mg. As adubações nitrogenada e potássica aumentaram o rendimento da macieira em cinco e quatro dos oito anos avaliados, respectivamente. O tamanho dos frutos foi mais afetado pela adubação potássica que pela nitrogenada. As adições de N e K influenciaram a composição mineral dos frutos, incrementando suas concentrações e as relações N:Ca e K:Ca. A concentração de Ca nos frutos foi reduzida pela adubação nitrogenada e frequentemente pela potássica. Distúrbios fisiológicos relacionados com a deficiência de Ca não foram observados, mesmo após 180 dias de armazenagem. Entretanto, a nutrição do Ca foi influenciada pelas adubações nitrogenada e potássica. Por isso, ao aplicar-se N e K deve-se combinar práticas nutricionais que compensem a redução da concentração de Ca nos frutos que esses nutrientes promovem.
INTRODUCTION
Nitrogen (N) and potassium (K) are the most extracted nutrients from the soil by the apple fruits, with the amount of K extracted being greater than N. Currently, with the use of new technologies, yield may reach values higher than 100 t ha–1 (Ernani et al., 2002), which increases the nutrients demanded by the apple.
The effective fruiting of apple trees is influ-enced by N, which plays an important effect in floral bud formation and increases the period when the ovule can be fertilized (Petri, 2002). K increases sugar trans-location to sink tissues, promoting their growth (Taiz & Zeiger, 2004). Thus, fruits from K-deficient plants have reduced size (Neilsen et al., 1998; Daugaard & Grauslund, 2000; Neilsen et al., 2000; Hunsche et al., 2003) which can reduce overall yield (Ernani et al., 2002). An excess of both N or K can affect calcium (Ca) nutrition, increasing the intensity of physiologi-cal disorders related to this nutrient, including the bit-ter pit, cork spot and lenticel blotch pit, among others (Iuchi et al., 2001). Increasing K as well as N rates can decrease flesh firmness (Nava et al., 2008), re-ducing the storage life of apples (Argenta, 2002).
Fertilizer recommendations for apple in Santa Catarina (SC) and Rio Grande do Sul States (RS) Brazil are based on soil and leaves chemical analysis, shoot growth and orchard productivity (Comissão de Química e Fertilidade do Solo RS/SC, 2004). The amount recommended for each year varies from 0 to 50 kg ha–1 for N and 0 to 100 kg ha–1 for K. These recommendations were obtained from results of re-search conducted in Fraiburgo/SC and Vacaria/RS, or adapted from other production regions around the world. Regional fertilization tests are quite important to São Joaquim/SC, considering that this region pre-sents very stony and shallow Inceptisols and the mean temperatures are lower when in comparison to other production regions in Brazil.
The objective of this study was to evaluate the effects of long-term annual additions of N and K to the soil on yield, fruit size, mineral composition and Ca-related disorders of ‘Fuji’ apples for São Joaquim/ SC soil and climate conditions.
MATERIAL AND METHODS
The experiment was conducted in the grow-ing seasons from 1998 to 2006, in São Joaquim, Santa Catarina State, Southern Brazil (28° 17' S, 49° 55' W), in three commercial orchards of 12, 16 and 19 years old. A randomized block experimental design was used, in a factorial 42
scheme with three replications, con-sidering each orchard/locality as a replication. Further
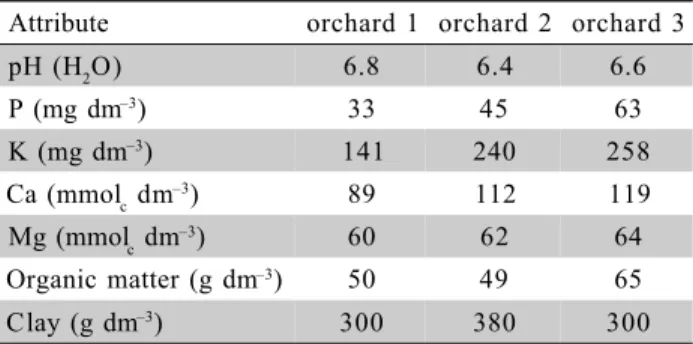
details about the experimental design, planting systems, treatment arrangement, plant and fertilizer management were described by Nava et al. (2008). Composite soil samples were collected in 1998, before experiment implementation. Clay content and chemical character-istics of the soils from the experimental orchards, at the beginning of the experiment, are presented in Table 1.
The experimental plots comprised five plants, spaced 4.5 m between plants by 6.0 m between rows in one orchard and 3.0 by 6.0 m in the other two, with the three central plants used as measurement plants. Trees were trained on a central leader system and received the same pruning and thinning practices as recommended for apple commercial orchards.
Annual yield was obtained by counting the to-tal number of fruit per plant and multiplying by the av-erage weight of 100 fruits randomly sampled per plot. In 2003, 2004 and 2006, samples of 24 fruit per plot were collected, approximately fifteen days before har-vest. These fruits were washed in distilled water. Two triangular longitudinal sections (1 cm, outside) of each fruit, including epidermis, were used as sub-samples. These parts were crushed using a processor and ap-proximately 5 g of this material were digested with H2O2 (3.0 mL) + H2SO4 (1.5 mL) at 200°C on a heat-ing block. The extracted K, Ca and Mg contents were determined through flame atomic absorption spectrom-etry. The N content was determined by the micro-Kjeldahl method, after digestion of 5g with H
2O2 (5.0
mL) + H2SO4 (5.0 mL) at 380°C and followed by ti-tration with H2SO4 0,025 mol L–1.
At harvest time of each year, three samples of ten randomly sampled fruits were obtained per plot. These samples were used to evaluate the percentage of fruit with physiological disorders related to low Ca content (bitter pit, lenticel blotch pit and cork spot). One of the samples was evaluated immediately after harvest and the two others after three and six months of storage at air atmosphere (2°C).
Table 1 - Soil testing results before experiment implementation (1998).
Attribute orchard 1 orchard 2 orchard 3
pH (H2O) 6.8 6.4 6.6
P (mg dm–3) 33 45 63
K (mg dm–3) 141 240 258
Ca (mmolc dm–3) 89 112 119
Mg (mmolc dm–3) 60 62 64
Organic matter (g dm–3) 50 49 65
Clay (g dm–3) 300 380 300
All statistical analyzes were undertaken using the Statistical Analysis System (SAS, 1996), and start-ing with the ANOVA. After definstart-ing the significance of N x K interaction, the General Linear Model (GLM) procedure was used for adjusting the regression equa-tion for each of N and K level. The significance level for all statistical analyzes was 95 % (p ≤0.05).
RESULTS AND DISCUSSION
Yield
No interaction was noticed between N and K rates. Thus, only the main effects for each nutrient are presented. Apple yield was increased due to N fer-tilization, in five of the eight evaluated years (Tables 2 and 3), contrasting with other research done elsewhere in Southern Brazil (Basso & Suzuki, 1992; Ernani et al., 1997; Ernani & Dias, 1999; Freire et al., 1999). The maximum increment ranged from 9.5 t ha–1 in 1999/2000 to 16.1 t ha–1 in 2004/2005, representing increments of 18.2% and 52.1%, respectively, when compared to no N application. For the quadratic model, rates for attainment of maximum yield ranged from 115 kg ha–1
in 2004/2005 to 161 kg ha–1
in 2000/2001 (Table 2 and 3). Yield showed a linear increase in 1999/2000,
with increased rate of N application, indicating that the N rates were insufficient to attain this year’s maximum yield.
Variation in response to N across all the years is related to soil parameter variations related to rainfall and temperature. These variation factors have a great influence on organic matter decomposition rates, amount of N lost by leaching and volatilization (Alexander, 1977) and on the N supply and absorp-tion by plants (Havlin et al., 2005). Absence of re-sponse to N in the first evaluated growing season can be attributed to the fact that buds that generate the fruit in this year have already differentiated in the previous one (Petri, 2002). Moreover, apple trees can accumu-late a large reserve of N in protein forms and reuse it in subsequent cycles (Titus & Kang, 1982; Manru et al., 1990).
Research conducted in other apple producing regions around the world is contradictory about the benefits of N fertilization on apple yield (Drake et al., 2002; Wargo et al., 2003; Ernani et al., 1997, 2000). For positive responses the maximum yield generally occurred with rates lower than 100 kg ha–1(Drake et al., 2002; Wargo et al., 2003), making it evident that apple trees had lower N demand, when compared to
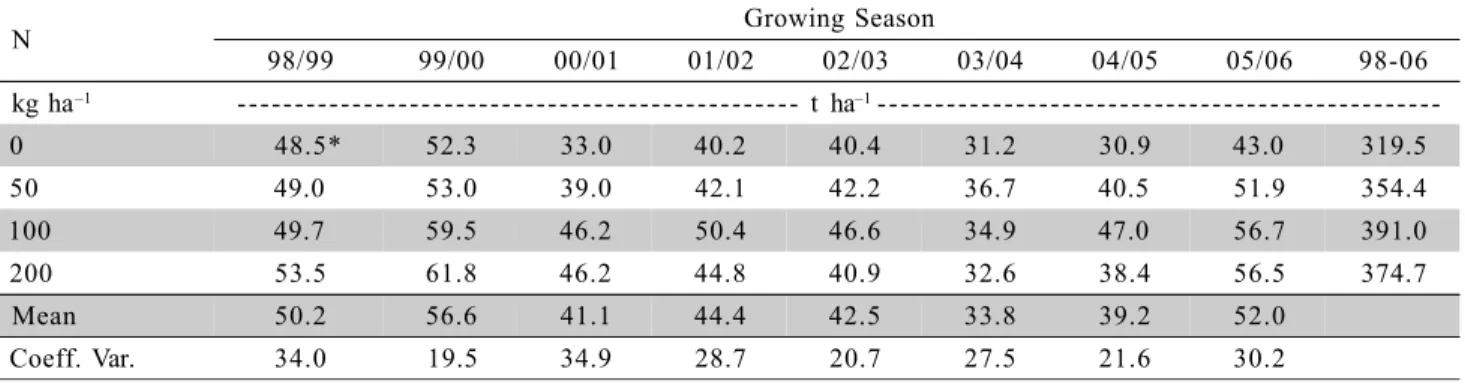
Table 2 - Average annual and cumulative fruit yield (1998-2006) for ‘Fuji’, as affected by annual surface addition of N.
*Average values (n = 12).
N Growing Season
98/99 99/00 00/01 01/02 02/03 03/04 04/05 05/06 98-06
kg ha–1 - - - t ha–1
-0 48.5* 52.3 33.0 40.2 40.4 31.2 30.9 43.0 319.5
50 49.0 53.0 39.0 42.1 42.2 36.7 40.5 51.9 354.4
100 49.7 59.5 46.2 50.4 46.6 34.9 47.0 56.7 391.0
200 53.5 61.8 46.2 44.8 40.9 32.6 38.4 56.5 374.7
Mean 50.2 56.6 41.1 44.4 42.5 33.8 39.2 52.0
Coeff. Var. 34.0 19.5 34.9 28.7 20.7 27.5 21.6 30.2
Growing Season Regression R2
1998/1999 = = 50.2 ns
1999/2000 y = 52.13 + 0.0517x 0.88*
2000/2001 y = 32.52 + 0.184x + 0.00057x2 0.98**
2001/2002 y = 39.07 + 0.151x + 0.00060x2 0.74*
2002/2003 = = 42.5 ns
2003/2004 = = 33.8 ns
2004/2005 y = 30.56 + 0.276x - 0.0012x2 0.97**
2005/2006 y = 43.07 + 0.208x - 0.0007x2 0.99**
1998-2006 y = 316.92 + 1.0852x - 0.004x2 0.97**
Table 3 - Relationship between annual and cumulative fruit yield (1998-2006) and annual surface addition of N.
ns, *, **Nonsignificant or significant (p ≤ 0.05 or 0.01), respectively. yˆ y
annual crops as corn and winter cereals. Under Bra-zilian conditions, research carried out in Caçador/SC over seven years using the ‘Golden Delicious’ culti-var showed no significant increase of fruit yield in any growing season with N rates as higher as 160 kg ha–1
. Also, in the same experiment, no effect of time or mode of N application was observed (Basso & Suzuki, 1992). Similar research conducted in Vacaria/RS with ‘Fuji’ and ‘Gala’ cultivars showed no response to N rates up to 200 kg ha–1
while obtaining apple yield higher than 90 t ha–1.
Apple tree response to N fertilization in São Joaquim/SC is possibly linked to the soil type, which is very shallow and stony, and different from soils in Fraiburgo and Vacaria, which are relatively deep and not stony. The shallow soil depth not only limits the soil volume exploited by roots, but also reduces the water storage capacity of the soils, which is directly associated with N supply and organic matter mineral-ization (Alexander, 1977). Moreover, N leaching can be greater under these conditions, since there are no deep roots to absorb N.
Soil temperature has an important role in soil organic matter mineralization (Alexander, 1977). The higher temperatures occurring in autumn and winter in Southern Brazil, particularly in Vacaria/RS and
Fraiburgo/SC regions, compared to other apple pro-ducing countries, favor N mineralization and enable N absorption by plants throughout the year. The extended duration of N mineralization can explain, in part, the absence of the apple tree’s response to N fertilization under these conditions (Ernani et al., 2000). However, due to the results here obtained, one can deduce that climatic conditions in São Joaquim/SC possibly are more similar to other temperate producing regions in the world than those found in Vacaria/RS and Fraiburgo/SC. Because of the lower temperatures, the N released via mineralization is probably lower, as com-bined with a lower absorption rate and shorter time available for the roots to absorb N.
Using the same experimental treatments and apple trees as used in this study, Nava et al. (2008) observed during the 2004 and 2005 growing seasons, detrimental effects of N on some fruit qualitative char-acteristics such as color, sugar content and flesh firm-ness. Hence, when evaluating the N fertilization, the detrimental effects on fruit quality that this nutrient may cause must be taken into account, in addition to fruit yield.
Apple yield was increased by K fertilization in four of the eight evaluated growing seasons (Tables 4 and 5), corroborating the results obtained in a
long-Table 4 - Average annual and cumulative fruit yield (1998-2006) for ‘Fuji’, as affected by annual surface addition of K.
*Average values (n = 12).
K2O Growing Season
98/99 99/00 00/01 01/02 02/03 03/04 04/05 05/06 98-06
kg ha–1 - - - t ha–1
-0 50.7* 52.5 38.7 41.0 35.3 28.3 25.6 46.6 318.7
50 50.5 56.8 38.9 43.3 40.6 31.1 38.8 55.3 355.3
100 50.8 60.9 40.7 47.5 46.4 36.2 42.4 54.7 379.6
200 48.7 56 44.1 45.6 47.7 39.7 43.1 49.2 374.1
Mean 50.2 56.5 40.6 44.3 42.5 33.8 37.5 51.4
Coeff. Var. 34.5 21.1 35.9 29.7 17.8 24.6 20.5 31.3
Table 5 - Relationship between annual and cumulative fruit yield (1998-2006) and annual surface addition of K.
Ns, * Nonsignificant or significant (p ≤ 0.05), respectively.
Growing Season Regression R2
1998/1999
= = 50.2 ns
1999/2000 y = 52.18 + 0.142x - 0.00061x2 0.96*
2000/2001
= = 40.6 ns
2001/2002
= = 44.3 ns
2002/2003 y = 34.98 + 0.151x - 0.0004x2 0.98*
2003/2004 y = 28.72 + 0.0583x 0.95*
2004/2005 y = 28.04 + 0.230x - 0.0008x2 0.98*
2005/2006
= = 51.4 ns
1998-2006 y = 318.23 + 0.928x - 0.0032x2 0.99*
ns, *Nonsignificant or significant (p ≤ 0.05), respectively. yˆ y
yˆ y yˆ y
term experiment in Southern Brazil (Ernani et al., 2002). The maximum increment in yield due to K fer-tilization ranged from 8.4 t ha–1 in 1999/2000 to 17.5 t ha–1 in 2004/2005, representing increases of 16.0% and 68.3% in fruit yield, respectively, as compared to trees not receiving K in these years (Table 4).
Highest average fruit yields, exceeding 50 t ha–1, occurred in 1999/2000 and 2005/2006, with re-sponse to K fertilization in all these years. When the quadratic regression model was used, the rates which gave maximum yields ranged from 116 kg ha–1
in 1999/ 2000 to 189 kg ha–1
in 2002/2003 (Table 5). These val-ues are smaller than those obtained by Ernani et al. (2002), which reflect the relatively lower yields found in the present study.
In the first and third year no effect of K fer-tilization on yield was detected, because of the high exchangeable K content in the soil in all orchards prior to establishment of the experiment (Table 1). The yield increase in the second growing season, in 1999/2000, when exchangeable K was still high, can be related to water deficit. As K moves itself toward the roots, pre-dominantly through diffusion and mass flux (Havlin et al., 2005), periods of water scarcity in soil can nega-tively affect K absorption by apple trees (Ernani et al., 2002). This same reason can explain part of the yield variation observed among other growing seasons.
Yield was more consistently increased by K fertilization after the 2002/2003 growing season, when exchangeable K contents were reduced (data not shown) in the plots without fertilization. The absence of response in the 2005/2006 growing season can be
attributed to the increase in K levels of the plant, as a result of lower yields observed in the previous two growing seasons (Table 4), since fruits are strong sinks for K (Neilsen & Neilsen, 2003).
Fruit Size
The effect of N fertilization on fruit size was not consistent, since only in two of the eight years the fruit size was increased by N addition (Tables 6 and 7). These results agree with those obtained by Wargo et al. (2003), who verified that fruit size is influenced more by crop load than by the amount of N applied to the apple tree. Fruit size was consistently increased by K fertilization after 2001/2002 growing season (Tables 6 and 7). The increase in fruit size was used by Nava et al (2008) to explain the decrease in flesh firmness of fruits in response to the K fertilization.
When the quadratic model was used, the rates for attainment of maximum size ranged from 138 to 153 kg ha–1 of potassium. Several researchers have re-ported increased fruit size due to K fertilization (Neilsen et al., 1998; Daugaard & Grauslund, 2000; Neilsen et al., 2000; Hunsche et al., 2003). The efflux of sucrose to the apoplast is facilitated by K availability, which in-creases sugar translocation to sink tissues, promoting their growth (Taiz & Zeiger, 2004). Thus, when the goal on nutrition management is producing large fruits, K fertilization is more effective than N.
Symptoms of Deficiency
Visual symptoms of K deficiency in leaves started in 2001/2002 in no K fertilized treatments when levels of exchangeable K in the soil were lower than
Table 6 - Average Fruit size (1998-2006) for ‘Fuji’, as affected by annual surface addition of N or K.
*Average values (n = 12)
N (kg ha–1) Growing Season
98/99 99/00 00/01 01/02 02/03 03/04 04/05 05/06 98-06
--- Fruit weight (g)
-0 165* 169 168 148 142 149 142 159 155
50 165 174 181 151 142 156 157 162 161
100 165 174 183 153 152 158 173 164 165
200 170 178 181 152 142 156 153 157 161
Mean 166 174 178 151 145 155 156 161 161
Coeff. Var. 10.4 26.7 15.0 25.2 12.4 23.2 18.0 16.9
K2O (kg ha–1) Fruit weight (g)
---0 166 174 172 144 130 140 119 145 149
50 164 170 176 151 143 150 156 163 159
100 167 174 183 155 151 160 164 169 165
200 170 176 182 154 153 167 170 167 167
Mean 167 174 178 151 144 154 152 161 160
60 mg dm–3
. This value is similar to those obtained by Neilsen et al. (1998; 2000), for coarse-textured soils in Canada. However, for soils from Vacaria, Southern Brazil, symptoms of K deficiency appeared when K exchangeable content in soil was less than 45 mg dm–3
(Ernani et al., 2002). The higher threshold value ob-served in São Joaquim relative to soils in Vacaria/RS is probably related to the shallow depth of the soil in the former region, which limits the root system de-velopment and consequently, the ability to absorb wa-ter and nutrients.
Chemical analyses of fruit
Nitrogen concentration of fresh fruit flesh showed a linear increase in 2006, with increased rate of N application, and a quadratic response up to 162 kg ha–1
and 194 kg ha–1
, in the 2003 and 2004 grow-ing seasons, respectively (Figure 1), in agreement with Raese & Drake (1997) and Dris et al. (1999). In 2006, N contents in fruit were higher than those obtained in the previous years. This can be ascribed to potentially beneficial climate factors as precipitation and tempera-ture which are involved in organic matter mineraliza-tion, N absorption by the plant, and N-fertilizer recov-ery. A larger N reserve, as a result of lower yield in the two previous growing seasons, could also have contributed to the greater N fruit levels in 2006. The decrease in fruit Ca concentration promoted by N ad-dition in 2004 and 2006 years (Figure 2) could be
re-Table 7 - Relationship between the fruit size (1998-2006) and annual surface addition of N or K.
Ns, *Non-significant or significant (p ≤ 0.05), respectively.
Growing Season Regression R2
Fruit weight vs N rates
1998/1999 = = 166 ns
1999/2000 = = 174 ns
2000/2001 y = 168.74 + 0.255x - 0.001x2 0.95*
2001/2002 = = 151
ns-2002/2003 = = 145 ns
2003/2004 = = 155 ns
2004/2005 y = 140.5 + 0.525x - 0.0023x2 0.93*
2005/2006 = = 161 ns
Fruit weight vs K20 rates
1998/1999 = = 167 ns
1999/2000 = = 174 ns
2000/2001 = = 178 ns
2001/2002 y = 144 + 0.17 - 0.0006x2 0.99*
2002/2003 y = 130.03 + 0.306x - 0.001x2 0.99*
2003/2004 y = 142.6 + 0.1331x 0.98*
2004/2005 y = 121.1 + 0.701x - 0.023x2 0.95*
2005/2006 y = 145.6 + 0.386x - 0.0014x2 0.97*
lated to greater branch and leaf development stimulated by N in these years (data not shown). Nitrogen pro-motes vegetative growth which drives more Ca to the leaves either because the new growth needs more Ca or because increasing leaf transpiration reduces xylem flow to the fruit (Taiz & Zeiger, 2004).
The decrease in Ca concentration and increase in N concentration in the fruit (Figures 1 and 2) in-creased fruit N:Ca ratios (Figure 3). Nevertheless, only in 2006, when N concentration in the fruit was rela-Figure 1 - Concentration of N in the apple fruit as affected by rate of annual surface additions of N in three ‘Fuji’ orchards, 2003, 2004 and 2006 (**significant at p ≤ 0.01).
yˆ y yˆ y yˆ y yˆ y yˆ y
yˆ y
yˆ y yˆ y yˆ y
N rates, kg ha-1
0 50 100 150 200
220 240 260 280 300 320 340 360 380 400
2003 : y = 248.26 + 1.046x - 0.00322x R = 0.98*82 2
2004 : y = 248.24 + 1.241x - 0.00319x2 R = 0.93**2
2006 : y = 325.4 + 0.2894x 2R = 0.89**2
2006
2004
2003
N
it
ro
g
e
n
,
m
g
k
g
(
w
e
t
w
e
ig
h
t)
tively high, did the Ca:N ratios slightly exceed the criti-cal value of 10:1, as recognized by Suzuki & Basso (2002), for optimum storage potential. Dris et al. (1999), evaluating the N and Ca effect on the nutri-tion of six apple cultivars, observed a greater varia-tion in N:Ca ratios in leaves than in fruit, and obtained values between 5 and 16 in fruit, depending upon the cultivar or year of evaluation.
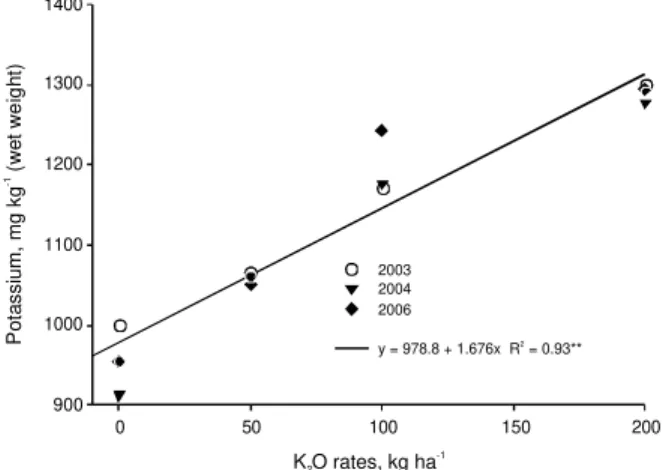
The fruit K concentration increased in a linear fashion with increasing K rates, as averaged over three evaluated growing seasons (Figure 4). On average, applications of 100 kg ha–1
of K2O increased fruit K concentration in 18% or 168 mg kg–1
. In similar re-search conducted in Vacaria-RS, Brazil, Hunsche et al. (2003) evaluated the effect of the annual application of rates up to 300 kg ha–1
of K2O, during nine years and they observed that K concentration in fruit
in-creased, but Ca and Mg concentration remained un-changed. However, in this present research, K appli-cation also reduced Ca concentration in fruit in two of the three evaluated growing seasons (Figure 5), but without affecting Mg concentration (data not shown). The yield variability between the researches could be the main factor for obtaining these different results in Ca fruit concentration. In the present research the trees had a lighter crop load when compared with that con-ducted by Hunsche et al. (2003). Light cropping trees tend to produce large fruit which have low Ca con-centration (Wargo et al., 2003; Ferguson & Watkins, 1992).
The combination of increased K concentration and decreased Ca concentration in fruit increased the K:Ca ratios, for the three years under evaluation (Fig-ure 6). In 2006, the K:Ca ratios were greater than 38, Figure 3 - N:Ca ratios in the apple fruit as affected by annual
surface additions of N in three ‘Fuji’ orchards, 2003, 2004 and 2006 (**significant at p ≤ 0.015). Figure 2 - Concentration of Ca in the apple fruit as affected by
rate of annual surface additions of N in three ‘Fuji’ orchards, 2003, 2004 and 2006 (ns, *, **non-significant or **non-significant at p ≤ 0.05 or 0.01, respectively).
Figure 4 - Concentration of K in the apple fruit as affected by rate of annual surface additions of K in three ‘Fuji’ orchards, 2003, 2004 and 2006 (**significant at p ≤ 0.05).
Figure 5 - Concentration of Ca in the apple fruit as affected by rate of annual surface additions of K in three ‘Fuji’ orchards, 2003, 2004 and 2006 (ns, ** non-significant or significant at p ≤ 0.01, respectively).
0 50 100 150 200
30 35 40 45 50 55 60 65
2003 y = (mean) = 45.9 ns
2004 y = 45.863 + 9.324(-0.0098x) R = 0.72*2
2006 y = 34.746 + 7.663(-0.0231x) R 096**2 =
2004 2003 2006 C a lc iu m , m g k g ( w e t w e ig h t) -1
N rates, kg ha-1
0 50 100 150 200
0 2 4 6 8 10 12
2003 : y = 5.14 + 0.0314x - 0.00010x R = 0.97**2 2
2004 : y = 4.309 + 0.0399x - 0.00012x R = 0.92**2 2
2006 : y = 7.788 + 0.0405x - 0.00013x R = 0.96**2 2
2006
2003
2004
N rates, kg ha-1
N :C a r a ti o
0 50 100 150 200
900 1000 1100 1200 1300 1400 2003 2004 2006
y = 978.8 + 1.676x R 2= 0.93**
K O rates, kg ha2
-1 P o ta s s iu m , m g k g ( w e t w e ig h t) -1
0 50 100 150 200
30 35 40 45 50 55 60 65
2003 : y = 44.068 + 5.498(-0.0261x) R = 0.93**2
2004 : y = (mean) = 50.8 ns
2006 : y = 35.4 + 8.3(-0.2791x) 2
R = 0.87**
2004
2003
2006
K O rates, kg ha2
a value considered detrimental to apple storage (Suzuki & Basso, 2002). Nevertheless, results of analysis of physiological disorders occurring at harvest and also during storage did not increase bitter pit, cork spot and lenticel blotch pit as K and N application rates increased (data not shown). Dris et al. (1999) has shown in-creased occurrence of bitter pit when K:Ca ratios ex-ceeded 45, a value relatively greater than the maximum here obtained .
A long-term experiment with annual additions of K on the soil surface and with the same cultivar as used in this study did not also observed increases of fruit physiological disorders during storage (Hunsche et al, 2003), despite the high exchangeable K detected in the soil (> 600 mg dm–3). The physi-ological nature of the relationship between K and Ca and bitter pit occurrence in apple is not clear. The in-volvement of K still appears to be related to its effect on Ca nutrition rather than a direct effect of this nu-trient per se in inducing bitter pit in apples (Telias et al., 2006).
CONCLUSIONS
Yield, size and mineral composition of apple were influenced, in a non interactive way, by N and K fertilization. Depending upon the growing season, yield and size of the fruit were often increased in re-sponse to annual addition of N and K to soil, with fruit size more affected by K than by N fertilization.
Once the fertilizations with N and K have in-fluenced the mineral composition of the fruits, which is directly related to quality and the preserving time of them, during the management of these fertiliza-tions, one must take into account their effects on per-formance and also the changes that these nutrients may cause to the fruits. Calcium nutrition was af-Figure 6 - K:Ca ratios in the apple fruit as affected by rate of annual surface additions of K in three ‘Fuji’ orchards, 2003, 2004 and 2006 (** significant at p ≤ 0.01).
fected and this nutrient is a key element in fruit con-servation. Thus, when fertilizing with N and K it is imperative to combine nutritional practices to offset the detrimental effect in the fruit’s Ca concentration as increase the number of Ca foliar sprays during the growth season.
REFERENCES
ALEXANDER, M. Introduction to soil microbiology. 2ed. New York: John Wiley, 1977. 467p.
ARGENTA, L.C. Fisiologia pós-colheita: maturação, colheita e armazenagem dos frutos. In: EPAGRI. Manual da cultura da macieira: Florianópolis: Epagri, 2002. p.691-732.
BASSO, C.; SUZUKI, A. Resposta da macieira Cv. Golden Delicious à adubação nitrogenada. Revista Brasileira de Ciência do Solo, v.16, p.223-227, 1992.
COMISSÃO DE QUÍMICA E FERTILIDADE DO SOLO RS/SC.
Manual de adubação e calagem para os estados do Rio Grande do Sul e de Santa Catarina. 10ed. Porto Alegre: CQFS-RS/SC, 2004. 400p.
DAUGAARD, H.; GRAUSLUND, J. Fruit colour and correlations with orchard factors and post-harvest characteristics in apple cv. Mutsu. Journal of Horticultural Science & Biotechnology, v.74, p.283-287, 2000.
DRAKE, S.R.; RAESE, J.T.; SMITH, T.J. Time of nitrogen application and its influence on ‘golden delicious’ apple yield and fruit quality. Journal of Plant Nutrition, v.25 p.143-157, 2002.
DRIS, R.; NISKANEN, R.; FALLAHI, E. Relationships between leaf and fruit minerals and fruit quality attributes of apples grown under northern conditions. Journal of Plant Nutrition, v.22, p.1839-1851, 1999.
ERNANI, P.R.; DIAS, J. Soil nitrogen application in the spring did not increase apple yield. Ciência Rural, v.29, p.645-649, 1999.
ERNANI, P.R.; DIAS, J.; VANZ, L. Application of nitrogen to the soil after fruit harvest has not increased apple yield. Revista Brasileira de Fruticultura, v.19, p.33-37, 1997.
ERNANI, P.R.; DIAS, J.; BORGES, M. A aplicação de nitrogênio ao solo em diferentes estádios não afetou o rendimento de frutos de cultivares de macieira. Ciência Rural, v.30, p.223-227, 2000.
ERNANI, P.R.; DIAS, J. FLORE, J.A. Annual additions of potassium to the soil increased apple yield in Brazil. Communication in Soil Science and Plant Analysis, v.33, p.1291-1304, 2002. FERGUSON, I.B.; WATKINS, C.B. Crop load affects mineral concentrations and incidence of bitter pit in Cox’s Orange Pippin apple fruit. Journal of the American Society for Horticultural Science, v.117, p.373-376, 1992.
FREIRE, C.J.S.; ZANCAN, C.; DITTMAR, E.A. Comportamento da macieira cv Gala/MM106 em função da adubação nitrogenada de primavera e de outono. Agropecuária Clima Temperado, v.2, p.37-47, 1999.
HUNSCHE, M.; BRACKMANN, A.; ERNANI, P.R. Efeito da adubação potássica na qualidade pós-colheita de maçãs Fuji.
Revista Agropecuária Brasileira, v.38, p.489-496, 2003. IUCHI, V.L.; NAVA, G.; IUCHI, T. Distúrbios fisiológicos e
desequilíbrios nutricionais em macieira. Florianópolis:
Epagri/Jica, 2001. 74p.
MANRU, G.; HUAIRUI, S.; HONGWEI, Z. A study on nitrogen nutrition of apple trees. In: Diagnosis of nutritional status of deciduous fruit orchards. Acta Horticulturae, v.274, p.179-185, 1990.
NAVA, G.; DECHEN, A.R.; NACHTIGALL, G.R. Nitrogen and potassium fertilization affect apple fruit quality in Southern Brazil. Communication in Soil Science and Plant Analysis, v.39, p.96-107, 2008.
0 50 100 150 200
10 20 30 40
2003 : y = 21.76 + 0.0462x R = 0.96**2
2004 : y = 17.81 + 0.0893x - 0.000242x 2R = 0.96**2
2006 : y + 22.38 + 0.1727x - 0.00046x 2R = 0.98**2
2006
2003
2004
K O rates, kg ha2 -1
N
:C
a
r
a
ti
NEILSEN, G.H.; PARCHOMCHUK, P.; MEHERIUK, M.; NEILSEN, D. Development and correction of K-deficiency in drip irrigated apple. Hortscience, v.33, p.258-261, 1998. NEILSEN, G.H.; PARCHOMCHUK, P.; NEILSEN, D.; ZEBARTH,
B.J. Drip-fertigation of apples trees affects root distribution and the development of K deficiency. Canadian Journal of Soil Science, v.80, p.353-361, 2000.
NEILSEN, G.H.; NEILSEN, D. Nutritional requirements of apple. In: FERREE, D.C.; WARRINGTON, J.J. Apples, Botany, production and uses: Wallingford: CABI, 2003. p.267-302. PETRI, J.L. Formação de flores, polinização e fertilização. In:
EPAGRI. Manual da cultura da macieira. Florianópolis: Epagri, 2002. p.229-259.
RAESE, J.T.; DRAKE, S.R. Nitrogen fertilization and elemental composition affects fruit quality of ‘Fuji’ apples. Journal of Plant Nutrition, v.20, p.1797-1809, 1997.
SAS INSTITUTE. The SAS-system for windows: release 6.08. Cary, SAS Institute, 1996. 633p.
SUZUKI, A.; BASSO, C. Fertilidade do Solo e nutrição da macieira. In: EPAGRI. Manual da cultura da macieira: Florianópolis: Epagri, 2002. p.341-381.
TAIZ, Z.; ZEIGER, E. Fisiologia vegetal. Porto Alegre: Artmed, 2004. 719p.
TELIAS, A.; HOOVER, E.; ROSEN, C.; BEDFORD, D.; COOK, D. The effect of Ca sprays and fruit thinning on bitter-pit incidence and Ca content in ‘Honeycrisp’ apple. Journal of Plant Nutrition, v.29, p.1941-1957, 2006.
TITUS, J.S.; KANG, S.M. Nitrogen metabolism, translocation, and recycling in apple trees. Horticultural Reviews, v.4, p.204-246, 1982.
WARGO, J.M.; MERWIN; I.A., WATKINS, C.B. Fruit size, yield, and market value of ‘GoldRush’ apple are affected by amount, timing and method of nitrogen fertilization. Horttechnology, v.13, p.153-161, 2003.