1 Recebido para publicação em 13.11.2002 e aceito para publicação em 17.2.2004.
2 Pesquisador, D.S., Embrapa Acre, P.O. Box321, 69908-970 Rio Branco-AC, Brazil, <paulo@dris.com.br>.
NUTRITIONAL STATUS OF
Eucalyptus grandis
CLONES EVALUATED BY
CRITICAL LEVEL AND DRIS METHODS
1Paulo Guilherme Salvador Wadt2
ABSTRACT - Nutritional status of eight 1.0 and 4.7 years old clones of Eucalyptus grandis, cultivated in a medium textured Ustults - US - and a Quartzipsamments - PS - soils, in Lençóis Paulista, São Paulo, were evaluated by the Diagnosis and Recommendation Integrated System (DRIS) and Critical Level (CL) methods. Based on multivariate discriminant analysis, the DRIS indices described the nutritional status of trees better in relation to tree age and soil type than in relation to nutrient composition. Spearman’s correlation coefficients showed statistically significant relationships between volumetric tree growth and nutrients when applying DRIS indices or foliar nutrient concentrations. However, the DRIS indices indicated a lower number of trees with nutritional deficiencies, in relation to the CL method. According to the CL method, P, S, and Ca were deficient in the majority of the soils and tree age categories. By the DRIS method, Ca was the only deficient nutrient in PS soils, and appeared to be particularly limited in one-year-old trees. In conclusion, the DRIS method was more efficient than the CL method in evaluating the nutritional status of eucalyptus trees.
Key words: Multivariate analysis, nutrient composition, calcium, eucalyptus.
AVALIAÇÃO NUTRICIONAL DE CLONES DE Eucalyptus grandis, PELOS MÉTODOS DO
NÍVEL CRÍTICO E DO DRIS, EM ÁRVORES DE 1 E 5 ANOS DE IDADE
RESUMO - Avaliou-se o estado nutricional de oito clones de Eucalyptus grandis, com idade de 1,0 e 4,7 anos, cultivados em dois solos (Neossolo Quartzarênico - PS e Argissolo Vermelho Amarelo - US), pelos métodos do nível crítico e do DRIS. Os índices DRIS apresentaram maior coerência para o padrão nutricional determinado pelo local de crescimento e pela idade das árvores, em comparação à concentração dos nutrientes, com base na análise multivariada discriminante. A maioria dos nutrientes, tanto em relação à concentração como ao índice DRIS, apresentou correlações significativas com o crescimento volumétrico da árvore, pela análise de correlação de Spearman. Contudo, o DRIS foi mais conservador que o método do NC na indicação de deficiências nutricionais: P, S e Ca foram apontados como deficientes pelo método do NC, em todos os solos e em todas as idades. Pelo método do DRIS, somente a deficiência de Ca foi apontada como sendo mais severa no solo PS e, principalmente, nas árvores de 1 ano de idade. Conclui-se que o método do DRIS foi superior ao método do NC para avaliação nutricional de árvores.
Palavras-chave: Análise multivariada, concentração de nutrientes, cálcio e eucalipto.
1. INTRODUCTION
In Brazil, eucalyptus has been cultivated generally on savanna soils of low natural fertility (Barros & Novais, 1996; Reis & Barros, 1990) with limited capacity to
Fertilizer application on soil under eucalyptus plantations is undoubtedly expensive because of the extensive plantation areas. Therefore, it is necessary to develop methods of diagnosis and fertilizer recommendations which can lead to improved fertilizer recommendation and forestry productivity. The nutrient diagnostic method should identify cases in which a nutrient limits yield. Situations should also be identified, in which the nutrient does not limit yield, in order to optimize biological and economic productivity.
In order to optimize biological productivity, nutritional evaluation based on foliar analysis using the DRIS or CL methods (Schutz & Villiers, 1987; Arboleda et al.., 1988; Hockman et al., 1989; Rathfon & Burger, 1991; Malavolta et al., 1993) has been applied in trees. However, the DRIS method was more accurate. Foliar analysis was used because the leaves are the plant compartment where most metabolic activities take place, and their physiological and nutritional status may influence plant growth. Thus, leaves are the main plant tissue used for nutritional diagnosis (Malavolta et al., 1999). In Brazil, Wadt & Novais (1999) evaluated the N eucalyptus nutrition by DRIS using the ratios between nutrient allocated to each tree component (compartmentalized analysis): leaves, branches, stembark and stemwood, or integrating the ratios for all the tree components simultaneously (integrated analysis). The DRIS indices by compartmentalized analysis showed a poorer relation with forest productivity than the DRIS indices by integrated analysis. The integrated analysis to evaluate the nutritional status of mature eucalyptus plantations is expensive.
To use the DRIS indices by compartmentalized analysis the Nutrient Application Potential Response (NAPR) criterion was adopted. NAPR is one criterion of DRIS indices interpretation and classification (Wadt, 1996; Martinez et al., 1999; Wadt et al., 1999) based on the probability of highest fertilizer response to the nutrient DRIS indices were lower, negative and had higher nutritional imbalance than other nutrient analyzed (Wadt, 1996).
Therefore, the objective of this paper was to evaluate the nutritional status of Eucalyptus grandis W. Hill
ex Maiden trees of 1.0 and 4.7 years of age to compare two diagnosis methods (CL and DRIS methods by compartmentalized analysis), using NAPR criterion and independent DRIS norms and CL values.
2. MATERIALS AND METHODS
The DRIS norms were obtained through quantification of N, P, K, Ca, Mg, S, B, Zn, Mn, Fe and Cu nutrient composition of 1,986 sites of commercial 4.5 to 10 year old stands cultivated with Eucalyptus grandis x E. urophylla clones in the states of Espirito
Santo and Bahia, Brazil (Wadt & Novais, 1999). Foliar nutrients in trees from 80 clones and 9 management units were analyzed, irrespective of phenologic period, physiological age of the leaves, position of leaves in the tree or canopy, or growing season. The DRIS norms consisted of the mean, variance, and the maximum and minimum values for bivariate relations of these foliar nutrient concentrations for low, medium and high productivity subpopulations (Wadt, 1996).
Field experimental data on foliar nutrient concentration composition and eucalyptus productivity of 1.0 and 4.7 year old trees were used to evaluate the performance of the following nutritional diagnostic methods: Critical Level (CL) and DRIS (Integrated System for Diagnosis and Recommendation). Field experiment data consisted of the mean foliar nutrient concentration of 48 trees (16 trees x 3 replications) of eight clones of Eucalyptus grandis, cultivated in Ultults
(US) and Quartzipsamments (PS) soil, in Lençóis Paulista, São Paulo, Brazil. These data were published by Vettorazzo (1989) , and represent the mean foliar nutrient concentrations for N, P, K, Ca, Mg and S nutrients (in g/kg), the mean foliar nutrient concentrations for B, Cu, Fe, Mn and Zn nutrients (in mg/kg), and tree productivity (in m3/ha).
Critical values for the nutritional status of eucalyptus trees using the Critical Levels method were obtained from Schönau (1983), for N (20 g/kg), P (1.6 g/kg), K (7.0 g/kg), Ca (10.0 g/kg), Mg (3.0 g/kg) and S (1.8 g/kg).Trees were deficient if nutrient concentrations were lower than the critical values indicated and optimum if nutrient concentrations were the same or higher than the values indicated.
In the discriminant statistical analysis (Manly, 1994) using SPSS software (SPSS, 1995), trees were grouped into soil type (PS or US) and tree age (1.0 or 4.7 years). These groupings into homogeneous tree groups were termed actual grouping. Statistical agreement between actual grouping and predicted grouping were tested by discriminations using Mahalanobis distances defined from nutrient composition or DRIS indices. The percentage of correct allocations as an indication of how well groups can be separated using the nutrient composition or DRIS indices variables was calculated.
Finally, for 1.0 and 4.7 year old trees, the values for nutrient composition, DRIS indices, and tree productivity were ordered by ranking the higher values. Spearman’s correlation coefficients were employed to determine the respective significance for nutrient composition or DRIS indices in relation to tree productivity.
3. RESULTS AND DISCUSSION
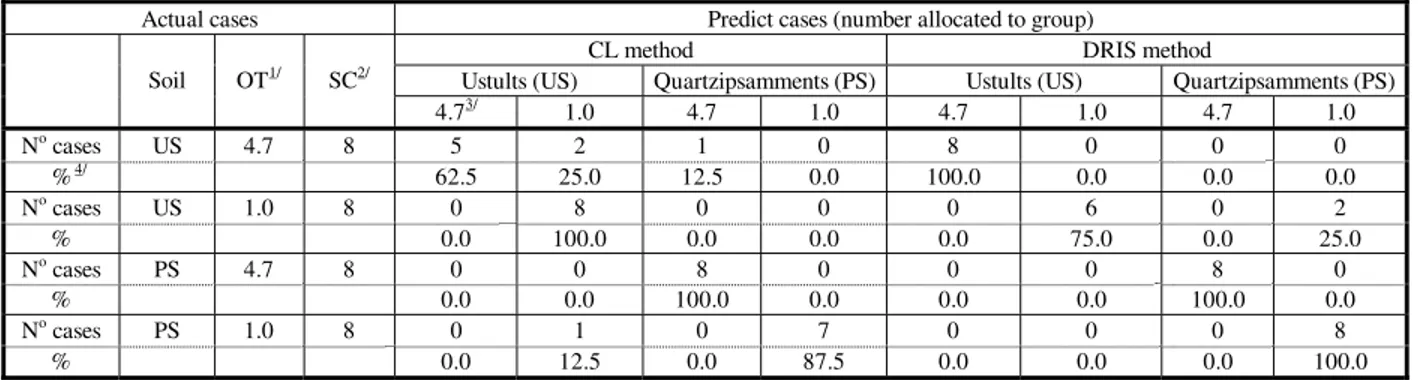
The DRIS method classified satisfactorily the actual grouping of trees cultivated in PS soil, failing only in two tree groupings of 1.0 year old trees cultivated in US soil (Table 2). The correlation between actual grouping and predicted grouping was 93.75% in relation to all cases.
Groupings based on nutrient composition correctly classified 1.0 year old groupings in US soil and 4.7 year
old groupings in PS soil. In this method, four clones were incorrectly grouped: three with 4.7 year old trees in US, and one with 1.0 year old trees in PS soil (Table 2). The correlation between actual grouping and predicted grouping was 87.50% in relation to all cases. Therefore, the DRIS indices were superior to the nutrient composition in classifying tree nutritional status based on tree age and soil type.
Compared to the CL method, the DRIS method was more conservative in identifying nutritional deficiencies. When employed CL, 100% of clones were considered S and Ca deficient; 97% were P deficient; 71% were Mg deficient and 34% were N or K deficient (Table 3). By DRIS methods, 50% of the clones were considered Ca-deficient and 3% were considered Mg-deficient with a high probability of response to lime application. With lower deficiency probability, 44, 19 and 12.5% of the cases were Mg, Ca and P deficient (Table 3).
The suggestion of a Ca deficiency by the DRIS method is probably correct in PS soil. However, in relation to the two methods, DRIS suggested 50% lower Ca deficiency than the CL method. If the Ca deficiency is false in US soil, the accuracy of DRIS methods should be higher.
In 1.0-year-old trees, the N, P, Ca, Mg, Fe, Mn and Zn concentrations were correlated with tree productivity (p = 0.05). However, no correlations were observed for N, P and Zn DRIS indices and tree productivity. Only
Table 1 – Interpretation of DRIS indices by the nutrient application potential response method (WADT, 1996). (INut = DRIS
index for the nutrient and, mNBI = mean nutritional balance index)
Quadro 1 – Interpretação dos índices DRIS pelo método do potencial de resposta à adubação (WADT, 1996). (INut = índice
DRIS para um dado nutriente; e mNBI = índice de balanço nutricional médio)
Nutritional status Nutrient application potential response1/ Condition
Deficient Positive, high probability
INut < 0 and
|INut| > mNBI and
INut DRIS index is lower
Probable deficiency Positive, low probability INut < 0 and
|INut| > mNBI
Balanced Null |INut| mNBI and
Probable excess Negative, low probability INut > 0 and
INut| > mNBI
Excess Negative, high probability
INut > 0 and
I|Nut| > mNBI and
INut| DRIS index is higher
1/ A positive response implies that nutrient inputs would increase tree growth rates and a negative response implies that nutrient inputs
the K, Ca, Mg, Fe and Mn DRIS indices were correlated to the same significance level (Table 4). The lack of agreement between the two variables (DRIS indices and nutrient composition) was due to concentration and dilution effects (Jarrel & Beverly, 1981), and shown by the high correlations observed between DRIS indices and dry matter indices in these tree ages (Table 4).
In 4.7-year-old trees, the P, K, Ca, Mg, B, Fe, Mn and Zn concentrations and DRIS indices were correlated with tree productivity (p = 0.05). Agreement between the variables was also good, probably because of the lowest nutrient concentration and dilution effects. In 4.7-year-old trees, the correlation between DRIS indices and trees productivity was also lower (Table 4).
The bivariate correlation technique did not permit identification of cause and effect between nutrient composition or DRIS indices and tree productivity. However, regardless of soil type and tree age, the correlations between Ca nutrient and tree productivity were the highest or second highest Spearman correlation coefficient.
Eighty one percent of the cases for the highest probability of response potential of Ca application by DRIS methods were restricted to trees cultivated in PS soil, at 1.0 year old (100% of these clones were considered Ca deficients by DRIS) and the Ca deficiency was lower in 4.7-years-old trees cultivated in the PS soil.
The Ca deficiency was higher in sandy soils. The hypothesis is that the relative biomass accumulation rate was higher than the relative Ca accumulation rate (Ingestad & Ågreen, 1995) in these soils during the period of highest relative biomass growth in 1.0 year old trees. The lack of Ca deficiency in 4.7 year old trees was attributed to lowest tree growth rate, due the highest tree competition and highest nutrient cycling rate, increasing the Ca liberation for radical absorption.
Table 3 – Total number of Eucalyptus clone cases with nutritional deficiencies (evaluated by the Critical Levels and Fertilization Response Potential methods), for the N, P, S, K, Ca and Mg nutrients, of 1.0- and 4.7-year old clones cultivated in PS and US soils
Quadro 3 – Número total de casos de clones de eucalipto com deficiência nutricional (avaliado pelos métodos do nível crítico e do potencial de resposta à adubação), para os nutrientes N, P, S, K, Ca e Mg, de clones de 1,0 e 4,7 anos cultivados em Neossolo Quartzarênico e Argissolo Vermelho-Amarelo
Critical level DRIS - Fertilization Response Potential Positive potential with: Nutrient
Deficient
high probability low probability
N 11 0 0
P 31 0 4
S 32 0 0
K 14 0 0
Ca 32 16 6
Mg 23 1 14
Table 2 - Summary of foliar nutrition classification in relation to actual groups (based on soil type and tree age) versus the predicted group membership by the canonical discriminant function derived by DRIS indices or nutrient composition. The percent of "grouped" cases correctly classified was 87.5% for nutrient composition and 93.7% for DRIS indices
Quadro 2 – Resumo da classificação da nutrição foliar em relação a grupos atuais, com base no tipo de solo e na idade da árvore, pelo grupamento predito pelas funções canônicas derivadas dos índices DRIS ou da composição nutricional. A porcentagem de casos agrupados corretamente foi de 87,5% para as variáveis derivadas da composição nutricional e de 93,7% para aquelas derivadas dos índices DRIS
Actual cases Predict cases (number allocated to group)
CL method DRIS method
Ustults (US) Quartzipsamments (PS) Ustults (US) Quartzipsamments (PS) Soil OT1/ SC2/
4.73/ 1.0 4.7 1.0 4.7 1.0 4.7 1.0
No cases US 4.7 8 5 2 1 0 8 0 0 0
% 4/ 62.5 25.0 12.5 0.0 100.0 0.0 0.0 0.0
No cases US 1.0 8 0 8 0 0 0 6 0 2
% 0.0 100.0 0.0 0.0 0.0 75.0 0.0 25.0
No cases PS 4.7 8 0 0 8 0 0 0 8 0
% 0.0 0.0 100.0 0.0 0.0 0.0 100.0 0.0
No cases PS 1.0 8 0 1 0 7 0 0 0 8
% 0.0 12.5 0.0 87.5 0.0 0.0 0.0 100.0
In the Lençois Paulista region, water deficiency is low, particularly when considering the same retention capacity of water by US and PS soils (Table 4). However, the soil water retention capacity and retention energy was probably lower in PS soils when compared to US soils, because coarse materials are higher in PS soil and fine materials are higher in US soil. This suggests that water deficiency probably differs between microenvironments.
However, the higher Ca deficiency in PS soils, identified by DRIS methods, may be explained by mass flow interruption. It is possible that in PS soil, root Ca absorption was reduced during periods when tree transpiration was relatively high because the turgor potential was sufficient for meristematic growth. Therefore, the tree was able to maintain relatively high growth rates under low water transpiration and Ca demand. This rationale would explain the reason for low Ca depletion in PS soil when compared to US soils (Table 5).
Table 4 – Meteorological data in Lençóis Paulista, from1984 to 1989
Quadro 4 – Dados meteorológicos médios de Lençóis Paulista, no período de 1984 a 1989
Meteorological parameters J F M A M J J A S O N D Mean maximum temperature (oC) 30.0 29.6 29.9 28.2 24.2 23.6 24.7 26.2 27.2 30.0 30.0 30.1
Mean minimum temperature (oC) 16.3 16.3 15.3 14.1 10.0 6.1 6.1 6.9 9.7 11.9 13.6 14.9
Precipitation (mm) 226 232 153 74 101 61 18 53 55 79 121 145 Rain day’s number 31 28 31 30 31 31 29 30 29 26 28 31 Source: Appendice 1 for Vettorazzo (1989).
The high correlation coefficients between other nutrients concentrations and tree productivity suggest that other nutritional factors are able to control tree growth rate (Table 6). In this study, Ca deficiency was attributed to a lack of parallel rates between relative Ca
Table 6 – Spearman’s coefficient and significance (Sig) for correlation between tree growth estimate and nutrient composition (NC) or DRIS indices (DI), for the 1.0 and 4.7-year-old clones cultivated in PS and US soils
Tabela 6 – Coeficiente de Spearman e significância (Sig) para correlação entre estimativa do crescimento da árvore e composição mineral (NC) ou índices DRIS (DI), para clones de 1,0 e 4,7 anos de idade, cultivados em Neossolo Quartzarênico e Argissolo Vermelho-Amarelo
1.0-years-old trees 4.7-years-old trees Nutrient
NC Sig1/ DI Sig NC Sig DI Sig
N 0.86 0.000 -0.01 0.983 0.34 0.197 0.23 0.393 P 0.64 0.008 0.37 0.154 -0.53 0.036 -0.70 0.003 K 0.19 0.477 -0.65 0.006 0.77 0.000 0.65 0.007 Ca 0.82 0.000 0.85 0.000 0.83 0.000 0.81 0.000
Mg 0.77 0.000 0.68 0.004 0.88 0.000 0.86 0.000
S 0.37 0.161 -0.47 0.064 -0.18 0.495 -0.24 0.374 B 0.28 0.297 -0.28 0.297 -0.61 0.012 -0.77 0.000 Cu 0.33 0.211 -0.19 0.471 -0.33 0.207 -0.37 0.161 Fe -0.55 0.027 -0.77 0.000 0.58 0.018 0.49 0.052 Mn -0.71 0.002 -0.81 0.000 0.68 0.004 0.53 0.034 Zn 0.74 0.001 0.06 0.812 -0.81 0.000 -0.84 0.000
dry matter -0.78 0.000 -0.55 0.027
1/ in fractionary number.
Table 5 – Calcium concentration in soils PS and US, in mmolc/dm3
Tabela 5 – Concentração de cálcio nos solos Neossolo Quartzarênico e Argissolo Vermelho-Amarelo, em mmolc/dm3
Soil Prof. (cm) Initiation of Experiment (Aug-84)
Prof. (cm)
After 4,5 years (Feb-89) 0-15 3.5 Ustults 0-20 20.0
15-40 0.5 0-15 1.3 Quartzipsamments 0-20 1.0
15-40 1.6
accumulation and relative biomass growth. The tree response for Ca application is improbable because limiting absorption of Ca in the PS soil was dependent upon mass flux in periods of water deficit.
4. CONCLUSION
DRIS methods using NAPR criterion were superior to CL methods in diagnosing nutrient deficiencies. High Ca deficiency was due to the limited Ca absorption in PS soil during periods of water deficit in trees with high relative biomass growth.
5. ACKNOWLEDGEMENT
I wish to thank Karen A. Kainer - University of Florida for revising the original paper.
6. REFERENCES
ARBOLEDA, C. V.; ARCILA, J. P.; MARTINEZ, R. B. Sistema integrado de recomendación y diagnosis: una alternativa para la interpretación de resultados del análisis foliar en café. Agron. Colombiana, v. 5, p. 17-30, 1988.
BARROS, N. F.; NOVAIS, R. F. Eucalypt nutrition and fertilizer regimes in Brazil. In: ATTIWILL, P. M.; ADAMS, M. A. (Eds.) Nutrition of eucalypts. Collingwood: CSIRO, 1996. p. 335-355.
HOCKMAN, J. N.; BURGER, J. A.; SMITH, D. W. M. A DRIS application to fraser fir christmas trees. Comm. Soil Sci. Plant Anal., v. 20, p. 305-318, 1989.
INGESTAD, T.; ÅGREN, G. I. Plant nutrition and growth: basic principles. Plant Soil, n. 168-169, p. 15-20, 1995.
JARREL, W. M.; BEVERLY, R. B. The dilution effect in plant nutrition studies. Adv. Agron., n. 34, p. 197-224, 1981.
JONES, C. A. Proposed modifications of the Diagnosis and Recommendation Integrated System (DRIS) for interpreting plant analyses. Comm. Soil Sci. Plant Anal., n. 12, p. 785-794, 1981.
LEAL, P. G. L. et al. Produção de biomassa e conteúdo de nutrientes em Eucalyptus grandis influenciados pela aplicação de fosfato natural em solos de cerrado. Revista Árvore, n. 12, p. 165-182, 1988.
MALAVOLTA, E.; OLIVEIRA, S. A.; VITTI, G. C. The use of diagnosis recommendation integrated system (DRIS) to evaluate the nutritional status of healthy and blight affected citrus trees. In: FRAGOSO, M. A. C.; BEUSICHEM, M. L. van (Eds.) Optimization of plant nutrition. S.l.: Kluwer Academic Publishers, 1993. p. 157-159.
MALAVOLTA, E.; OLIVEIRA, S. A.; WADT, P. G. S. Foliar diagnosis: The status of the art. In: SIQUEIRA, J. O. (Eds.) Inter-relação fertilidade, biologia e nutrição de plantas. Lavras: Sociedade Brasileira de Ciência do Solo, 1999. p. 205-242.
MANLY, B. F. J. Multivariate statistical methods. A primer. London: Chapman & Hall, 1994. 215 p.
MARTINEZ, H. E. P.; CARVALHO, J. G.; SOUZA, R. B. Diagnose Foliar. In: Comissão de Fertilidade do Solo do Estado de Minas Gerais. Recomendações para o uso de corretivos e fertilizantes em Minas Gerais. 5a. aproximação. Viçosa: Universidade Federal de Viçosa, 1999. p. 143-168.
RATHFON, R. A.; BURGER, J. A. Diagnosis and
Recommendation Integrated System modifications for fraser fir christmas trees. Soil Sci. Soc. Am. J., v. 55, p. 1026-1031, 1991.
REIS, M. G. F.; BARROS, N. F. Ciclagem de nutrientes em plantios de Eucalyptus. In: BARROS, N. F.; NOVAIS, R. F. Relação solo-eucalipto. Viçosa: Folha de Viçosa, Viçosa, 1990. p. 265-302.
SCHÖNAU, A. P. G. Fertilization in South African forestry. South Africa Forest Journal, n. 125, p.1-19, 1983.
SCHUTZ, C. J.; VILLIERS, J. M. Foliar diagnosis and fertiliser prescription in forestry - The DRIS system and its potential. South Africa Forest Journal, v. 141, p. 6-12, 1987.
SPSS. Standard version. SPSS Inc. Chicago, Illinois. 1995.
VETTORAZZO, S.C. Efeito dos fatores do solo e de genótipos no crescimento, nutrição e atividade da fosfatase ácida em clones de Eucalyptus grandis W. Hill ex Maiden. 1989. 115 f. Dissertação (Mestrado em Ciências Florestais) – Escola Superior de Agricultura “Luiz de Queiróz” Piracicaba, 1989.
WADT, P. G. S. Os métodos da chance matemática e do sistema integrado de diagnose e recomendação (DRIS) na avaliação nutricional de plantios de eucalyptus. 1996. 123 f. Tese (Doutorado em Solos e Nutrição de Plantas) – Universidade Federal de Viçosa, Viçosa, 1996.
WADT, P. G. S. et al. Normas prelimares do sistema integrado de diagnose e recomendação para clones de Eucalyptus grandis x Eucalyptus urophylla. Revista Scientia Forestalis, n. 55, p. 145-154, 1999.