Genetic diversity of American wild rice species
Elizabeth Ann Veasey
1*, Eduardo de Andrade Bressan
2, Maria Imaculada Zucchi
3,
Roland
Vencovsky
1, Daruska Cavalcante Cardim
4, Rainério Meireles da Silva
51
USP/ESALQ – Depto. de Genética, C.P. 83 – 13400-970 – Piracicaba, SP – Brasil. 2
USP/CENA – Programa de Pós-Graduação em Biologia na Agricultura e no Ambiente, Piracicaba, SP – Brasil.
3
APTA/Polo Apta Centro Sul, C.P. 28 – 13400-970 – Piracicaba, SP – Brasil 4
Serviço Municipal de Saneamento Ambiental de Santo André, R. José Caballero, 143 – 09040-210 – Santo André, SP – Brasil.
5
UFPA/Centro Agropecuário, Campus Altamira, R. Cel. José Porfírio, 2515 – 68372-040 – Altamira, PA – Brasil. *Corresponding author <eaveasey@esalq.usp.br>
Edited by: Alexandre Siqueira Guedes Coelho
ABSTRACT: Studies on genetic diversity and genetic structure of natural populations are important in order to define strategies for in situ and ex situ conservation actions and for plant pre-breeding programs. Aiming to assess the genetic diversity and genetic structure of three wild American Oryza species with isozyme markers, 14 populations of the diploid O. glumaepatula (Agl
Agl
), 11 populations of the tetraploid O. grandiglumis (CCDD) and five populations of the also tetraploid O. latifolia (CCDD)were studied. They were all originated from Rio Paraguay hydrographic basin and the Amazon. Four enzymes were used and they gave 40 polymorphic bands. The most polymorphic species was O. glumaepatula, followed by O. latifolia and O. grandiglumis. A cluster analysis with the Jaccard similarity coefficient separated the diploid from the two tetraploid species, and also the two tetraploid species. This separation was also evident on a scatter plot from a principal component analysis, suggesting that they should be treated as two separate species, although further studies are necessary to provide support for this affirmative. The AMOVA analyses showed a high intrapopulational variability for O. latifolia (67.6%) and O. grandiglumis (52.2%), when compared to their interpopulational variability (32.4% and 47.8%, respectively), which suggests the hypothesis of a higher degree of outcrossing events within these species. When studying the correlation between the Jaccard dissimilarity coefficient and geographic distances, a spatial genetic structure was observed for O. glumaepatula only. These results are important for defining strategies of both in situ and ex situ
conservation.
Keywords: Oryza glumaepatula, O. latifolia, O. grandiglumis, Amazon, genetic structure
Introduction
The Oryza genus comprises two cultivated species (Oryza sativa, native to Southeast Asia, spread throughout tropical and sub-tropical environments, and O. glaberrima, limited to Western Africa) and 22 wild species distributed in all tropical and subtropical world regions (Vaughan et al., 2003). Eight wild species occur both in Asia and Oceania, four in Asia, two in Oceania, five in Africa and four in America (IRRI, 2009). The four American species are distributed from Mexico to Argentina and all of them are found in Brazil (Oliveira, 1994).
Genetic and ecological studies with wild rice natural popu-lations are necessary to provide information for both ex situ
or in situ conservation programs for these species (Xie et al., 2010). To date, there are quite a few studies concerning the genetic structure of the diploid O. glumaepatula popu-lations (Akimoto et al., 1998; Buso et al., 1998; Brondani et al., 2005; Karasawa et al., 2007a,b; Veasey et al., 2008a), but very little has yet been published on the genetic structure and variability of the tetraploid American species (Agrama and Eizenga, 2008; Arrieta-Espínoza et al., 2005; Quesada et al., 2002; Veasey et al., 2008b). The wild species represent an im-portant genetic reservoir for rice plant breeding for the pur-pose of introgression of useful genes into the cultivated
spe-cies O. sativa (Brondani et al., 2002; Eisenga et al., 2009; Multani et al., 2003; Yoon et al., 2006).
This study analyzed the genetic diversity and genetic struc-ture of two tetraploid American wild rice species, O. latifolia
and O. grandiglumis, and the diploid O. glumaepatula as an outgroup, using isozyme markers. The objectives were to provide useful information for in situ or ex situ conserva-tion of these species, and also to provide further data in or-der to elucidate the taxonomic issue of the tetraploid spe-cies.
Materials and Methods
the other Amazonian populations, in the State of Mato Grosso (Table 1, Figure 1).
A bulk of 50 seeds was formatted using randomly sampled two to three seeds from each plant within each population. After germination in plastic gerboxes on filter paper at 27ºC in the dark in germination chambers, the seed-lings were planted in pots in the greenhouse. The number of evaluated plants from each population varied from four (ARG6) to 36 (RPG1), according to their germination po-tential, amounting to a total of 700 individuals (Table 1).
For enzyme extraction, newly expanded leaves (200 mg) were ground in liquid nitrogen in 1.5 mL microtubes using a power homogenizer, adding 1 mL of number 1 extraction buffer (Alfenas et al., 1991), excluding diethyldithiocarbamic acid (DIECA) and 2- mercaptoethanol. The crude extract was
then centrifuged at 18,000 x g for 20 min at 4ºC and 130 μL of the supernatant placed in 0.5 mL microtubes, diluted in 150 μL of a solution containing Tris-HCl pH 6.8 and Coomassie blue, the latter component indicating the protein migration in the gel. Electrophoresis was conducted accord-ing to Veasey et al. (2008a).
Six enzyme systems presenting higher band resolution were initially selected for the analyses: glucose-6-phosphate isomerase (GPI; E.C. 5.3.1.9), aspartate aminotransferase (AAT; E.C. 2.6.1.1), shikimate dehydrogenase (SKD; E.C. 1.1.1.25), glutamate dehydrogenase (GDH; E.C. 1.4.1.2), phosphoglucomutase (PGM; E.C. 2.7.5.1) and malate de-hydrogenase (MDH; E.C. 1.1.1.37). Due to the difficulty in interpreting, the MDH and PGM systems were discarded. The PGM system was excellent for O. glumaepatula
popu-Nº Code Species Nº
samples
Hydrographic
Basin River
Lake
(Municip.) Latitude Longitude
1 RTAQ1 O. latifolia 30 Paraguay Taquari Pantanal 19º15' S 57º13' W
2 RPG1 " 32 Paraguay Paraguay Pantanal 19º01' S 57º30' W
3 ARG5 " 26 Paraguay Paraguay - 27º18' S 59º24' W
4 ARG8 " 17 Paraguay Paraguay - 27º26' S 58º52' W
5 ARG6 " 4 Paraguay Paraguay - 27º17' S 59º23' W
6 RP2 O. grandiglumis 14 Purus Purus Bravo 3º51' S 61º26' W
7 RS20 " 30 Solimões - - 2º50' S 65º13' W
8 RN32 " 11 Negro - - 1º01' S 61º53' W
9 RJP2 " 9 Japurá Japurá - 2º57' S 64º50' W
10 RS3 " 30 Solimões - Paru 3º18' S 60º35' W
11 RJP3 " 32 Japurá Japurá - 2º40' S 64º57' W
12 RS26 " 31 Solimões - Caldeirão 3º15' S 60º11' W
13 RS14 " 30 Solimões - Jucara 4º02' S 63º08' W
14 RS10 " 26 Solimões - Miuá 3º50' S 62º05' W
15 RSJN3 " 32 Solimões - Janauacá 3º19' S 60º11' W
16 RP1 " 11 Purus Purus - 3º49' S 61º25' W
17 RJP4 O. glumaepatula 21 Japurá Japurá Cuiucuiú 2º22' S 65º07' W
18 RS14 " 9 Solimões - Jucara 4º02' S 63º08' W
19 RP1 " 21 Purus Purus - 3º49' S 61º25' W
20 RT1 " 24 Tapajós Tapajós - 2º26' S 54º42' W
21 RS17 " 30 Solimões - Coari 4º10' S 63º15' W
22 RS6 " 27 Solimões Solimões Manacapuru 3º11' S 60º47' W
23 RPG3 " 27 Paraguay Corumbá - 18º59' S 57º37' W
24 RPG2 " 23 Paraguay - - 19º00' S 57º41' W
25 RPG1 " 36 Paraguay Paraguay - 19º01' S 57º30' W
26 RS21 " 23 Solimões - Mamiá 4º15' S 63º03' W
27 RPG4 " 23 Paraguay Taquari - 19º15' S 57º13' W
28 RX1 " 24 Xingu Xingu Piulaga 12º14' S 53º35' W
29 RN18 " 24 Negro Branco - 1º53' S 61º22' W
30 RN26 " 23 Negro Carabinani - 1º54' S 61º23' W
lations but provided a poor resolution for the tetraploid species.
Due to the tetraploid species (O. grandiglumis and O. latifolia), the zimograms of all three species were interpreted as presence/absence of bands (binary data), as in the case of dominant markers. Using the UPGMA (unweighted pair group method with arithmetic averages) method and the Jaccard similarity coefficient, a cluster analysis was obtained with NYSYS-pc software (Rohlf, 1992). The reliability of the formed groups in the cluster analyses was verified with a boot-strap analyses using 10000 permutations implemented in the software BOOD-P, version 2.0 (Coelho, 2001). Also, a prin-cipal component analysis was conducted by PROC PRINCOMP procedures of SAS program (SAS, 1993) for the two tetraploid species, and a scatter graph was obtained using BioStat 4.0 software (Ayres et al., 2005).
The level of genetic spatial structure was analyzed using the Pearson coefficient of correlation (r) between the Jaccard dissimilarity coefficient matrix and the geographic distances (shortest distance between two given points on the map) matrix between populations, using the NTSYS-pc software (Rohlf, 1992). Mantel’s Z statistic (Mantel, 1967) and 10000 random permutations were used to test the significance of these correlations.
Figure 1 – Map of Brazil showing the location of 30 Oryza glumaepatula, O. latifolia and O. grandiglumis
populations.
Species O. grandiglumis O. latifolia O. glumaepatula
System b pb % P b pb % P b pb % P
AAT 7 4 57 11 8 73 6 5 83
PGI 12 12 100 10 10 100 8 8 100
SKDH 2 1 50 2 1 50 2 2 100
GTDH 8 6 75 9 8 89 1 0 0
Total 29 23 - 32 27 - 17 15
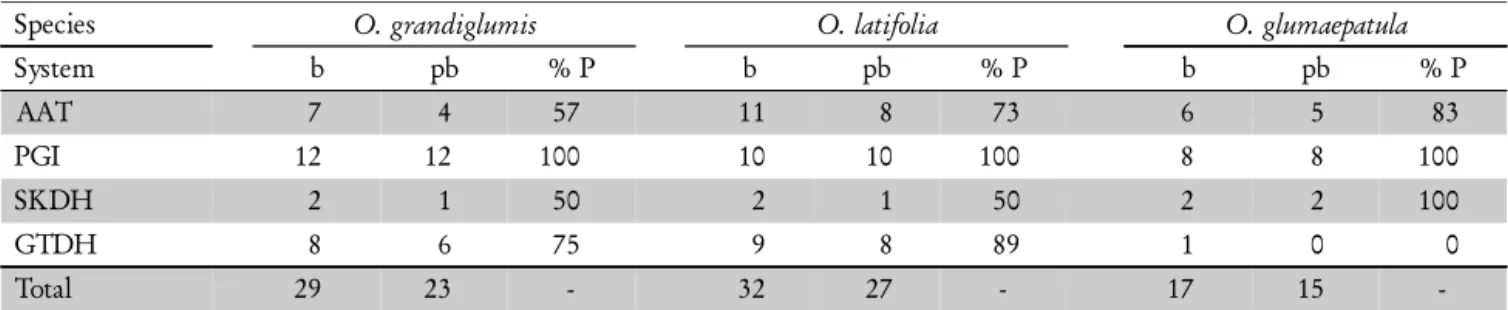
-Table 2 – Number of bands (b), number of polymorphic bands (pb) and percent polymorphism (%P) assessed for each enzymatic system and for each species.
Using the ARLEQUIN software (Schneider et al., 2004), analyses of molecular variance for dominant markers (AMOVA) (Excoffier et al., 1992) were conducted with bi-nary data to assess the genetic structure of the species/popu-lations under investigation. Four AMOVA analyses were car-ried out, one considering the two tetraploid species in a to-tal of 16 populations; and three further analyses, one for each species and their respective populations (O. latifolia with five populations, O. grandiglumis with 11 populations, and O. glumaepatula with 14 populations). These three latter analy-ses allowed us to estimate the parameter φST, which is analo-gous to Wright φST, an interpopulation diversity parameter (Lacerda et al., 2001).
Results and Discussion
A total of 40 isozyme bands were found in 30 popula-tions belonging to the three species evaluated: four bands for SKDH, 13 for AAT, 14 for GPI and nine for GTDH. High level of polymorphism was observed in all 30 popu-lations and in all the species tested (Table 2). The diploid O. glumaepatula was the most polymorphic (88%), followed by O. latifolia (84%) and O. grandiglumis (79%). The same result was observed for morphoagronomic traits in a simi-lar set of populations (Veasey et al., 2008b). Although O. grandiglumis was represented by a larger number of popu-lations than O. latifolia in both studies, they were all origi-nated from the Amazon region and showed less polymor-phism. On the other hand, O. latifolia was represented by two populations from the Pantanal ecosystem in Brazil and three populations collected in a more distant area in Argen-tina. However, these two groups were not separated in the cluster analysis (Figure 2). Based on total genomic hybrid-ization and in agreement with our findings, Aggarwal et al. (1996) showed that O. latifolia was the most divergent among the three CCDD species, and that O. alta and O. grandiglumis were more similar to each other. Bao and Ge (2004) concluded that the CD genome originated from a single hybridization event, and that the C genome species (O. officinalis or O. rhizomatis instead of O. eichingeri) served as the maternal parent while the E genome species (O. australiensis) was the paternal donor during the forma-tion of CD genome.
populations of the three species, a wide range was found for the Jaccard similarity coefficient, varying from 0.05 to 1.0, but most of this variability was due to the separation of the diploid from the tetraploid species. The dendrogram (Fig-ure 2) showed two well defined great groups, one including the two tetraploid species and one including the populations of the diploid species, O. glumaepatula. Although minor groups were formed, three groups were noticed within the
O. glumaepatula great group. The first one classifying the Amazon populations, except for Rio Japura (RJP-4), which had a different pattern for the GPI system in relation to all the other populations, and was, therefore, classified as a sec-ond separate group, with 100% reliability. A third group clas-sified the four Rio Paraguay populations together with the Rio Xingu population, with 53% reliability.
When studying morphoagronomic traits, Veasey et al. (2008b) also found an evident separation of O. glumaepatula populations, to the right side of the first ca-nonical axis, which explained 64.8% of total variation, from the tetraploid species, scattered towards the left side. Arrieta-Espinoza et al. (2005) also showed that the first and third components, which together explained 55.1% of the varia-tion, separated O. latifolia and O. grandiglumis (CCDD ge-nomes) from O. glumaepatula, O. sativa, and other AA genome species in Costa Rica. Also in Costa Rica, Zamora et al. (2003) found that the small ligule and the wide flag leaf characteristic of the two CCDD species separated them from the AA diploid O. glumaepatula.
Within the tetraploid great group, the O. latifolia popu-lations were clearly separated from O. grandiglumis, with 59% reliability as shown by the bootstrap analysis (Figure 2). Within the O. latifolia populations, no separate groups were observed between the two areas sampled, the Pantanal in the State of Mato Grosso do Sul, Brazil and Argentina. Although showing less polymorphism, O. grandiglumis
populations were separated also into different clusters, with two Rio Solimões populations (RS20 and RS10) and one Rio Japura population (RJ3) showing greater genetic simi-larity to the O. latifolia populations. A Rio Negro O.
grandiglumis population (RN32) was isolated from the oth-ers, as it displayed unique isozyme band patterns for the GPI system. Another group classified most of the Amazonian
O. grandiglumis populations, with 100% reliability. The scatter graph was done only for the two tetraploid species, in order to show their genetic differences or similari-ties (Figure 3), which were obtained from the principal com-ponent analysis, whose first two comcom-ponents explained 57.6% of total variation, confirmed the results from the clus-ter analyses. It showed the separation of the O. latifolia
populations from the O. grandiglumis populations, which had a higher dispersion, from what we may suggest that they should be considered as two separate species. Examining the scatter graph, the O. latifolia populations were clustered to-gether on the lower right side of the graph and separated from the O. grandiglumis populations. RN32 O. grandiglumis population was also separated from the other populations of this species, agreeing with the dendrogram, which also separated this population in a single sub-group (Figure 2).
The taxonomic status of the two tetraploid species is more complex. In this study, the two species were grouped in separate clusters, from what we suggest that they be con-sidered as separate species. However, further studies with a higher number of accessions of each species, which could include the third American tetraploid species, O. alta, and other molecular markers such as microsatellites or AFLP (am-plified fragment length polymorphism), should be con-ducted to clarify this issue. Buso et al. (2001), Grover and Pental (1992) and Vaughan et al. (2003) suggested that the three American CCDD tetraploid species should be treated as a complex or a single species. But some support the view that these are separate species (Aggarwal et al., 1996; Ge et al., 1999; Veasey et al., 2008b; Zamora et al., 2003), while others suggest that O. latifolia should be treated as a single
Figure 3 – Scatter graph obtained from the principal component analysis (princomp 1 explaining 44.4% and princomp 2 explaining 13.2% of total variation) for the 16 populations of the tetraploid species: O. latifolia (Ol) and O. grandiglumis (Og).
species in contrast to O. alta and O. grandiglumis which share more similarities. Bao and Ge (2004), based on two chloroplast fragments and three nuclear gene fragments, sug-gested treating O. alta and O. grandiglumis as a single spe-cies, but not O. latifolia. Nishikawa et al. (2005) have shown that O. latifolia has a different chloroplast genome from O. alta and O. grandiglumis. Phylogenetic trees using microsatellite markers have placed both O. latifolia and O. alta in the same cluster within a set of wild rice species, in comparison to O. sativa (Agrama and Eizenga, 2008; Eisenga et al., 2009).
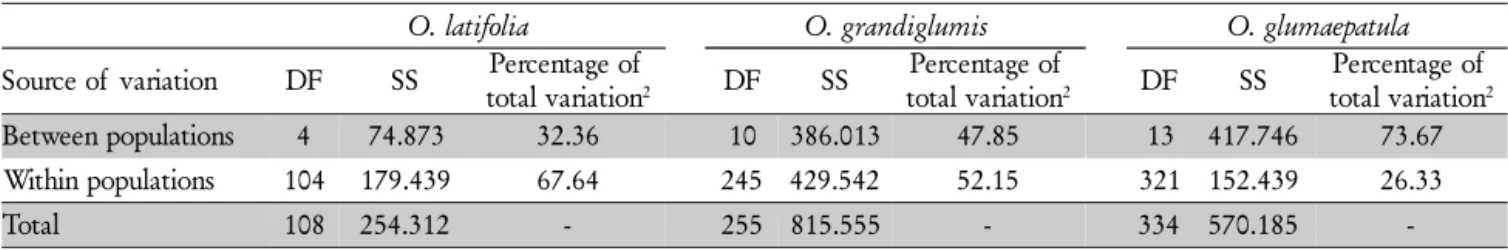
Taking into account the genetic structure of these spe-cies, the AMOVA analysis conducted for the two tetraploid species showed a relatively low percentage of the variability distributed between species (38.4%), with a similar percent-age of the variability distributed within populations (34.1%) (Table 3). When considering each individual species, a higher interpopulational diversity was found for the diploid O. glumaepatula populations (φST = 0.737), compared to the interpopulational diversity observed for O. latifolia popu-lations (φST = 0.324) and O. grandiglumis populations (φST
= 0.478) (Table 4). On the other hand, higher intrapopula-tion diversity was found for the tetraploid species, especially
O. latifolia (67.6%) followed by O. grandiglumis (52.2%), against 26.3% for the diploid O. glumaepatula populations. The interpopulation diversity parameter (φST) estimated in this study can be compared with Wright FST interpopula-tion variability obtained in other studies. A lower FSTvalue (0.491) was obtained by Karasawa et al. (2007) with microsatellite markers for O. glumaepatula populations, al-though similar values were obtained by Brondani et al. (2005) (FST= 0.847) and Silva et al. (2007) (FST= 0.715). The fact that most of the isozymic variability was distributed between rather than within species is in accordance with the predomi-nantly autogamic mating system of these species, especially
the diploid O. glumaepatula (Akimoto et al., 1998; Buso et al., 1998; Brondani et al., 2005; Karasawa et al., 2007a,b; Vaz et al., 2009). Apparent outcrossing rates were estimated as 0.143 and 0.135 by Karasawa et al. (2007a) and Brondani et al. (2005), respectively, for O. glumaepatula, both using microsatellite markers, while multilocus outcrossing rates varying from 0.011 to 0.223 were reported by Karasawa et al. (2007b), justifying the O. glumaepatula interpopulation variation found in nature. A higher apparent outcrossing rate (0.30 on average) using 18 microsatellite loci was reported by Vaz et al. (2009) for a single large population of O. glumaepatula, occurring in the Paraguay River, Brazil. How-ever, the higher variability found within populations for the two tetraploid species, when compared to the interpopulational variability, suggest the hypothesis of a higher degree of outcrossing events within these species. Fur-ther progeny studies are recommended for a better under-standing of the mating system of the CCDD tetraploid spe-cies.
Quesada et al. (2002) found high levels of interpopula-tion diversity for O. latifolia in Costa Rica, with most popu-lations being monomorphic for at least one genotype, sug-gesting little gene flow within populations. However, Quesada et al. (2002) observed high frequency of heterozy-gous-like isozymatic patterns which may suggest that the re-productive system of O. latifolia might be more complex. In our study, heterozygous-like isozymatic patterns were also observed, especially for the GPI system. The excess of het-erozygous patterns and fixed heterozygotes could be due to polyploidy, and have been observed in autogamous allopoly-ploids, mainly in colonizing plants (Barret and Shore, 1989). However, the diploid O. glumaepatula also presented high frequency of heterozygotes for the dimeric GPI system, which is harder to explain, considering that the other sys-tems showed low frequency of heterozygotes.
Source of variation DF SS Percentage of total variation p value1
Between species 1 339.553 38.43 0.0000
Between populations within species 14 460.886 27.43 0.0000
Within populations 349 608.981 34.14 0.0000
Total 364 1409.419
-1Number of permutations = 1023.
Table 3 – Analysis of Molecular Variance (AMOVA) with isozyme markers for 16 populations belonging to the tetraploid species
Oryza latifolia and O. grandiglumis.
1Number of permutations = 1023; 2p < 0.0000.
Table 4– Analysis of Molecular Variance (AMOVA) with isozyme markers for Oryza latifolia with 5 populations, O. grandiglumis with 11 populations and O. glumaepatula with 14 populations.
O. latifolia O. grandiglumis O. glumaepatula
Source of variation DF SS Percentage of
total variation2 DF SS
Percentage of
total variation2 DF SS
Percentage of total variation2
Between populations 4 74.873 32.36 10 386.013 47.85 13 417.746 73.67
Within populations 104 179.439 67.64 245 429.542 52.15 321 152.439 26.33
-When correlation analyses between geographic and genetic distances, using the Mantel test, were conducted for each spe-cies separately, the tetraploid spespe-cies (O. grandiglumis with 11 populationsand O. latifolia with five populations) did not show any correlation among these two distances. How-ever, a strong correlation between genetic and geographic dis-tances was found for O. glumaepatula (r = 0.67; p ≤ 0.0004), tested with 14 populations. Also, when the analysis was con-ducted with the 10 Amazon populations only, excluding the more distant ones from the Rio Paraguay hydrographic ba-sin, a high correlation was still observed (r = 0.66; p ≤ 0.03), but at a lower (5%) significance level.
The strong correlation between geographic and genetic distances observed for O. glumaepatula agrees with the clus-ter analysis (Figure 2) where the most distant populations are also genetically differentiated. In this study, the popula-tions are quite distant from each other. However, even among the Amazonian populations, excluding the more dis-tant Pantanal populations, a correlation was found. The clus-ter analysis separated the Pantanal populations in Rio Para-guay from the Amazonian populations. The Xingu popula-tion, which is at an intermediate position in the physical map, was also at an intermediate position in the cluster analysis, confirming the correlation result observed for this species.
No correlation, however, was found for genetic and geo-graphic distances, when assessing almost the same group of
O. glumaepatula populations with microsatellite markers (Karasawa et al., 2007b), which may be explained by the com-plete absence of selection effect in this neutral marker, while some selection effect could be found in isozymes.
To understand the reasons for this greater space struc-turing among the diploid O. glumaepatula populations, the interpopulational diversity parameter (φST) was compared be-tween both tetraploids and the diploid populations. The higher interpopulational value found for the diploid popu-lations (φST= 0.737) was indicative of a higher genetic struc-turing among populations, which could provide an expla-nation for the higher level of genetic spatial structure ob-served for O. glumaepatula populations. Comparable val-ues of FST were found for O. glumaepatula populations by other authors, such as FST = 0.85 (Brondani et al., 2005) with SSR markers, FST = 0.763 (Veasey et al., 2008a) with isozyme markers, although a lower FST = 0.491 was reported by Karasawa et al. (2007a) with SSR markers.
In conclusion, our data showed a high enzymatic poly-morphism for the three wild American rice species, which is important considering their possible use in plant breeding programs. The AMOVA results with the two tetraploid spe-cies showed high intrapopulation variability, a different re-sult from the diploid species, with higher interpopulational variability, which may suggest a higher level of outcrossing for the two tetraploid species. Further studies on the mat-ing system of the tetraploid species are recommended, con-sidering that this type of information is very important for
ex situ or in situ conservation strategies. The higher out-crossing pattern found in the tetraploid species suggests a mixed or predominantly cross-fertilization breeding system. This would lead to the sampling of a higher number of
plants within fewer populations, in comparison with a pre-dominantly inbreeding population. The strategies for collec-tion would include sampling from many plants from sev-eral populations, considering the sampling of seeds for ex situ conservation. But strategies for maintaining these popu-lations at an in situ conservation program are also impor-tant and this knowledge allows the definition of the num-ber of populations to be preserved. Xye et al. (2010) have shown the necessity to maintain in situ conservation of O. rufipogon populations, considering that ex situ conservation of this species populations failed to maintain the genetic iden-tity and reduced genetic diversity. Our data also suggests the distinction of O. latifolia and O. grandiglumis as two sepa-rate species, although further studies with a greater number of accessions and other molecular markers could provide a more reliable conclusion concerning the taxonomic status of the tetraploid species.
Acknowledgements
To the Fundação de Amparo à Pesquisa do Estado de São Paulo (FAPESP) and to the Conselho Nacional de Desenvolvimento Científico e Tecnológico (CNPq), for the financial support for thedevelopment of this research and scholarships.
References
Aggarwal, R.K.; Brar, D.S.; Huang, N.; Khush, G.S. 1996. Differentiation within CCDD genome species in the genus Oryza as revealed by total genomic hybridization and RFLP analysis. Rice Genetics Newsletter 13: 54-57.
Agrama, H.A.; Eizenga, G.C. 2008. Molecular diversity and genome-wide linkage disequilibrium patterns in a worldgenome-wide collection of Oryza sativa and its wild relatives. Euphytica 160: 339-355. Akimoto, M.; Shimamoto, Y.; Morishima, H. 1998. Population genetic
structure of wild Oryza glumaepatula distributed in the Amazon flood area influenced by its life-history traits. Molecular Ecology 7: 1371-1381.
Alfenas, A.C.; Peters, I.; Brune, W.; Passador, G.C. 1991. Electrophoresis of Proteins and Isozymes of Fungi and Forest Plants. 2ed. UFV, Viçosa, MG, Brazil. (in Portuguese).
Arrieta-Espinoza, G.; Sánchez, E.; Vargas, S.; Lobo, J.; Quesada, T.; Espinoza, A.M. 2005. The weedy rice complex in Costa Rica. I. Morphological study of relationships between commercial rice varieties, wild Oryza relatives and weedy types. Genetic Resources and Crop Evolution 52: 575–587.
Ayres, M.; Ayres, J.R.; Ayres, D.L.; Santos, A.S. 2005. BioEstat 4.0:Statistics Application in Biological Sciences and Medical Areas. 4ed. Sociedade Civil Mamirauá, CT Brasil, Belém, PA, Brazil. (in Portuguese).
Bao, Y.; Ge, S. 2004. Origin and phylogeny of Oryza species with the CD genome based on multiple-gene s equence data. Plant Systematics and Evolution 249: 55-66.
Barret, S.C.H.; Shore, J.S. 1989. Isozyme variation in colonizing plants. p. 106-126. In: Soltis, D.E.; Soltis, P.S., eds. Isozymes in plant biology. Dioscorides Press, Portland, Oregon, OR, USA.
Brondani, C.; Rangel, P.H.N.; Brondani, R.P.V.; Ferreira, M.E. 2002. QTL mapping and introgression of yield-related traits from Oryza glumaepatula to cultivated rice (Oryza sativa) using microsatellite markers. Theoretical and Applied Genetics 104: 1192-1203. Brondani, R.P.V.; Zucchi, M.I.; Brondani, C.; Rangel, P.H.N.; Borba, T.C.O.;
Buso, G.S.C.; Rangel, P.H.; Ferreira, M.E. 1998. Analysis of genetic variability of South American wild rice populations (Oryza glumaepatula) with isozymes and RAPD markers. Molecular Ecology 7: 107-117.
Buso, G.S.C.; Rangel, P.H.; Ferreira, M.E. 2001. Analysis of random and specific of nuclear and cytoplasmic DNA in diploid and tetraploid American wild rice species (Oryza spp.). Genome44: 476-494.
Coelho, A.S.G. 2001. BOOD - Dendrogram Assessment Based on Distances/Genetic Similarities Estimates through the Bootstrap Procedure. v.3.0. Departamento de Biologia Geral, Instituto de Ciências Biológicas, Universidade Federal de Goiás, Goiânia, GO, Brazil. (in Portuguese).
Eizenga, G.C.; Agrama, H.A.; Lee, F.N.; Jia. Y. 2009. Exploring genetic diversity and potential novel disease resistance genes in a collection of rice (Oryza spp.) wild relatives. Genetic Resources and Crop Evolution 56: 65-76.
Excoffier, L.; Smouse, P.E.; Quattro, J.M. 1992. Analysis of molecular variance inferred from metric distances among DNA haplotypes: application to human mitochondrial – DNA restriction data. Genetics 131: 479-491.
Ge, S.; Sang, T.; Lu, B.; Hong, D. 1999. Phylogeny of rice genomes with emphasis on origins of allotetraploid species.Proceedings of the National Academy of Sciences 96: 14400-14405.
Grover, A.; Pental, D. 1992. Interrelationships of Oryza species based on electrophoretic patterns of alcohol dehydrogenase. Canadian Journal of Botany 70: 352-358.
International Rice Research Institute [IRRI]. 2009. Wild rice taxonomy. Available at: http://www. knowledgebank.irri.org/ wildRiceTaxonomy/Default.htm. [Accessed Apr. 04, 2009]. Karasawa, M.M.G.; Vencovsky, R.; Silva, C.M.; Zucchi, M.I.; Oliveira,
G.C.X.; Veasey, E.A. 2007a. Genetic structure of Brazilian wild rice (Oryza glumaepatula Steud., Poaceae) populations analysed using microsatellite markers. Genetics and Molecular Biology 30: 400-410.
Karasawa, M.M.G.; Vencovsky, R.; Silva, C.M.; Zucchi, M.I.; Oliveira, G.C.X.; Veasey, E.A. 2007b. Mating system of Brazilian Oryza glumaepatula populations studied with microsatellite markers. Annals of Botany 99: 245-253.
Lacerda, D.R.; Acedo, M.D.P.; Lemos-Filho, J.P. 2001. Genetic diversity and structure of natural populations of Plathymenia reticulate
(Mimosoideae), a tropical tree from Brazilian Cerrado. Molecular Ecology 10: 1143-1152.
Mantel, N. 1967. The detection of disease clustering and a generalized regression approach. Cancer Research 27: 209-220.
Multani, D.S.; Khush, G.S.; Reyes, B.G.; Brar, D.S. 2003. Alien genes introgression and development of monosomic alien addition lines from Oryza latifolia Desv. to rice, Oryza sativa L. Theoretical and Applied Genetics 107: 395-405.
Nishikawa, T.; Vaughan, D.A.; Kadowaki, K.I. 2005. Phylogenetic analysis of Oryza species, based on simple sequence repeats and their flanking nucleotide sequences from the mitochondrial and chloroplast genomes. Theoretical and Applied Genetics 110: 696-705.
Oliveira, G.C.X. 1994. Geographic distribution of wild Oryza species in Brasil. p. 10-15. In: Morishima, H.; Martins, P.S., eds. Investigations of plant genetic resources in the Amazon basin with the emphasis on the genus Oryza: Report of 1992/93 Amazon Project. Monbusho International Scientific Research Program, Mishima, Japan; Research Support Foundation of the State of São Paulo, São Paulo, SP, Brazil.
Quesada, T.; Lobo, J.; Espinoza, A.M. 2002. Isozyme diversity and analysis of the mating system of the wild rice Oryza latifolia
Desv. in Costa Rica. Genetic Resources and Crop Evolution 49: 633-643.
Rohlf, F.J. 1992. NTSYS-pc:Numerical Taxonomy and Multivariate Analysis System.Version 1.70 (software). Stony Brook, New York, NY, USA.
SAS Institute. 1993. SAS/STAT User’s Guide for Personal Computers. Version 6. 3ed. SAS Institute, Cary, NC, USA.
Silva, C.M.; Karasawa, M.M.G.; Vencovsky, R.; Veasey, E.A. 2007. Elevada diversidade genética interpopulacional em Oryza glumaepatula
Steud. (Poaceae) avaliada com microssatélites. Biota Neotropica 7: 1-7.
Schneider, S.; Roessli, D.; Excoffier, L. 2004. Arlequin:a software for population data analysis (Software). Genetic and Biometry Laboratory, University of Geneva, Geneva, Switzerland. Available at: http://anthropologie.unige.ch/arlequin. [Accessed Oct. 20, 2004].
Vaughan, D.A.; Morishima, H.; Kadowaki, K. 2003. Diversity in the
Oryza genus. Current Opinion in Plant Biology 6: 139-146. Vaz, A.R.C.; Borba, T.C.O.; Brondani, C.; Rangel, P.H.N.; Camargo, G.S.O.;
Telles, M.P.C.; Diniz Filho, J.A.F.; Brondani, R.F.V. 2009. Genetic analysis of a local population of Oryza glumaepatula using SSR markers: implications for management and conservation programs. Genetica 137: 221-231.
Veasey, E.A.; Cardin, D.C.; Silva, R.M.; Bressan, E.A.; Vencovsky, R. 2008a. Assessing the genetic structure of Oryza glumaepatula
populations with isozyme markers. Brazilian Archives of Biology and Technology 51: 873-882.
Veasey, E.A.; Silva, E.F.; Schamass, E.A.; Oliveira, G.C.X.; Ando, A. 2008b. Morphoagronomic genetic diversity in American wild rice species. Brazilian Archives of Biology and Technology 51: 99-108.
Xie, J.; Agrama, H.A.; Kong, D.; Zhuang, J.; Hu, B.; Wan, Y.; Yan, W. 2010. Genetic diversity associated with conservation of endangered Dongxiang wild rice (Oryza rufipogon). Genetic Resources and Crop Evolution 57: 597-609.
Yoon, D.B.; Kang, K.H.; Kim, H.J.; Ju, H.G.; Kwon, S.J.; Suh, J.P.; Jeong, O.U.; Ahn, S.N. 2006. Mapping quantitative trait loci for yield components and morphological traits in an advanced backcross population between Oryza grandiglumis and the O. sativa japonica cultivar Hwaseongbyeo.Theoretical and Applied Genetics 112: 1052-1062.
Zamora, A.; Barboza, C.; Lobo, J.; Espinoza, A.M. 2003. Diversity of native rice (Oryza Poaceae:) species of Costa Rica. Genetic Resources and Crop Evolution 50: 855-870.