To See or Not to See: Do Front of Pack
Nutrition Labels Affect Attention to Overall
Nutrition Information?
Laura Bix1*, Raghav Prashant Sundar1, Nora M. Bello2, Chad Peltier3, Lorraine J. Weatherspoon4, Mark W. Becker3
1School of Packaging, Michigan State University East Lansing, MI, United States of America,2Department of Statistics, Kansas State University Manhattan, KS, United States of America,3Psychology Cognition and Cognitive Neurosciences Group, Michigan State University East Lansing, MI, United States of America,
4Department of Food Science and Human Nutrition, Michigan State University East Lansing, MI, United States of America
Abstract
Background
Front of pack (FOP) nutrition labels are concise labels located on the front of food packages that provide truncated nutrition information. These labels are rapidly gaining prominence worldwide, presumably because they attract attention and their simplified formats enable rapid comparisons of nutritional value.
Methods
Eye tracking was conducted as US consumers interacted withactual packageswith and without FOP labels to (1) assess if the presence of an FOP label increases attention to nutri-tion informanutri-tion when viewers are not specifically tasked with nutrinutri-tion-related goals; and (2) study the effect of FOP presence on consumer use of more comprehensive, traditional nutri-tion informanutri-tion presented in the Nutrinutri-tional Facts Panel (NFP), a mandatory label for most packaged foods in the US.
Results
Our results indicate that colored FOP labels enhanced the probability that any nutrition mation was attended, and resulted in faster detection and longer viewing of nutrition infor-mation. However, for cereal packages, these benefits wereat the expense of attention to the more comprehensive NFP. Our results are consistent with a potential short cut effect of FOP labels, such that if an FOP was present, participants spentless time attending the more comprehensive NFP. For crackers, FOP labels increased time spent attending to nutrition information, but we found no evidence that their presence reduced the time spent on the nutrition information in the NFP.
OPEN ACCESS
Citation:Bix L, Sundar RP, Bello NM, Peltier C, Weatherspoon LJ, Becker MW (2015) To See or Not to See: Do Front of Pack Nutrition Labels Affect Attention to Overall Nutrition Information? PLoS ONE 10(10): e0139732. doi:10.1371/journal.pone.0139732
Editor:Anderson de Souza Sant'Ana, University of Campinas, BRAZIL
Received:July 22, 2015
Accepted:September 15, 2015
Published:October 21, 2015
Copyright:© 2015 Bix et al. This is an open access article distributed under the terms of theCreative Commons Attribution License, which permits unrestricted use, distribution, and reproduction in any medium, provided the original author and source are credited.
Data Availability Statement:All relevant data are within the paper and its Supporting Information files.
Conclusions
The finding that FOP labels increased attention to overall nutrition information by people who did not have an explicit nutritional goal suggests that these labels may have an advan-tage in conveying nutrition information to a wide segment of the population. However, for some food types this benefit may come with a short-cut effect; that is, decreased attention to more comprehensive nutrition information. These results have implications for policy and warrant further research into the mechanisms by which FOP labels impact use of nutrition information by consumers for different foods.
Introduction
Given growing rates of obesity and associated increases in health costs, morbidity and mortality [1–4], numerous governments world-wide have expressed an interest in reducing obesity rates. As part of this effort, Front of Pack (FOP) nutrition labels are becoming prominent interna-tionally [5]. These labels take varied forms, ranging from symbols that provide a global synop-sis of a product’s overall healthfulness in summative fashion to those which include explicit details regarding key components commonly associated with health risks when consumed in excess (e.g. saturated fat, fat, sugar and salt). Increasingly, explicit labels are also overlaid with qualitative assessments relating to the specific components highlighted (e.g. a traffic light sys-tem, in which red stands for“eat sparingly”, amber for“eat in moderation”and green for“eat up”).
In response to the increased use of FOP labels, and governmental calls for research investi-gating their effectiveness (Nathan, Lichtenstein, Yaktine, & Wartella, 2011; Office of Foods, Center for Food Safety and Applied Nutrition, Center for Veterinary Medicine, & Office of Regulatory Affairs, 2012; White House Task Force on Childhood Obesity, 2010), there has been a great deal of recent research on FOP labeling.
In this study we fill two critical gaps in the existing literature.
• First, we directly measure how FOP labels impact attention among participants not engaged in a nutrition-related task.
• Second, we investigate how the presence of an FOP impacts attention to existing, more com-prehensive, nutrition information (i.e., the Nutrition Facts Panel (NFP) in the US).
To do so, we employ a novel method that allows high-resolution eye tracking while people interact with commercial quality packages.
Background
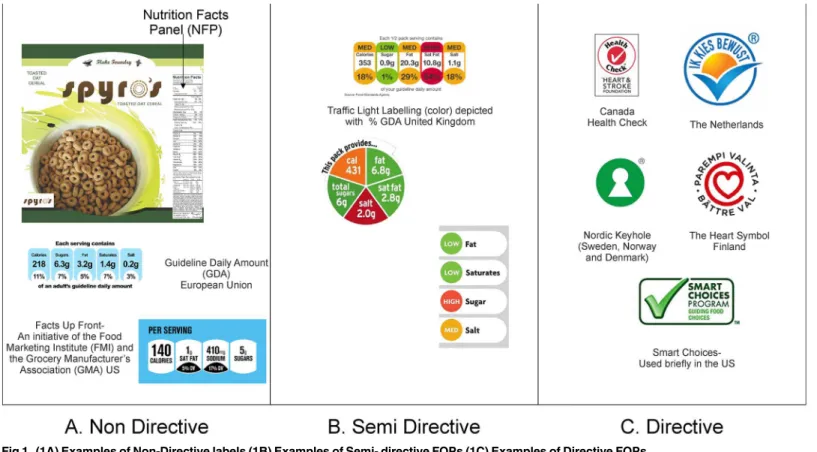
Hodgkins et al. developed a system to classify FOP labeling as: directive, non-directive and semi-directive, and defined“directiveness”as the degree to which the labeling provides guid-ance about a food’s overall healthfulness [6].‘Non-directive’labels simply offer a listing of nutrients and leave the burden of making the actual healthfulness interpretation to the con-sumer. Monochrome systems like the %GDA label in the EU and the Facts-up-Front program (also known as Nutrition Keys) [7], as well as the traditional Nutrition Facts Panel (NFP) in the US, are examples of non-directive labeling (Fig 1A). When overlaid with symbols or other qualitative assessments such as color, non-directive labels become‘semi-directive’, offering a listing of key components while also providing a color-coded interpretation of the healthful-ness of each relative to reference amounts (Fig 1B). Finally, simple icons, like the Choices Icon Competing Interests:Dr. Bix has had previous
funding from large food companies, including Kraft Foods and Nestle. These companies were not involved in any aspect of this study, and the previous funding does not alter the authors' adherence to PLOS ONE policies on sharing data and materials.
in the Netherlands [8], the Nordic Keyhole-utilized in Norway, Sweden and Denmark [9], and the now defunct Smart Choices label in the US [10] are examples of‘directive’labels, those which sum-marize and directly call out the overall healthfulness of a product in summative fashion (Fig 1C). Regardless of the approach taken (directive, semi-directive or non-directive), the rationale behind FOP labels is that presenting information regarding nutritional aspects of the product in a conspic-uous and easy to understand manner will empower people to make healthier choices [11–14].
Most of the research investigating FOP labels focuses on the consumer’s ability to compre-hend and use labels of various designs (for review see Vyth et al., 2012). With this focus, many studies have given people nutrition-relevant tasks and evaluated how well they perform the task which requires nutrition labeling, generally during trials which employ varied label designs. For instance, Borg & Westernhoefer (2009) asked people to select the healthy option in a two-alterna-tive forced-choice scheme using packaging designs that included directwo-alterna-tive, semi directwo-alterna-tive and non directive methods of labeling. Researchers found that participants performed the selection task better with a color-coded FOP label, a type of semi-directive label. This finding was repli-cated by Australian researchers, who found that participants were five times more likely to cor-rectly identify a food as healthy when food products were labeled with a traffic light FOP label (i.e. semi-directive) as compared with those which were monochromatic (i.e. non-directive) [15]. In general, it seems that color-coded FOPs, like the multiple traffic light design, are effective when people are asked to identify healthy foods (see Hawley et al 2013 for review).
While this approach is important for identifying labels that are effectivefor people who have
the goal of recognizing healthy food products, published research provides little information
about a label’s impact on individuals who might not have an explicit nutrition-related goal. From an information-processing prospective, the existing literature focuses on a relatively late
Fig 1. (1A) Examples of Non-Directive labels (1B) Examples of Semi- directive FOPs (1C) Examples of Directive FOPs.
process, namely comprehension, by-passing the earlier stage of attentional selection. Bypassing the attentional interaction ignores the fact that one of the reasons to place nutritional informa-tion on the front of packs is to make it readily accessible so that it garners more atteninforma-tion [16]. Further, a great deal of research suggests that information must be attended in order to be con-sciously perceived [17–20]. In short, if a label fails to garner attention, then the cognitive pro-cessing of the label will be derailed before comprehension even becomes an issue; that is, if the consumer does not see the information, information processing gets truncated before reaching the point of understanding.
Recognizing this gap in knowledge, recent studies have sought to investigate how different types of nutrition labels impact attention. A number of these studies use visual search tasks to investigate attention to nutrition labels. Many employ the reaction time required to find a nutri-tion-relevant search target as the dependent variable [21,22]. Others have tracked eye movements while participants were given explicit, nutrition-relevant goals like identifying whether a product had low or high sodium content, or making a health judgment about a product [23–28]. These visual search paradigms generally support the claim that semi-directive (specifically, color–coded) FOP labels are effective at attracting attention. However, in all these visual search paradigms the participants were given nutrition-relevant tasks, predisposing them to attend the relevant infor-mation. So, much like research on comprehension, these studies are unable to speak to the ability of labels to garner attention from people who do not have an explicit nutritional goal.
Other researchers have eye tracked participants while explicitly manipulating participants’
goals in order to compare those with a nutrition-related goal to others with taste or purchase-related motivations [21,22,29–32]. In general, these studies show that participants with a nutrition related goal spend more time attending to nutritional information and that formats akin to the Traffic Light FOP label garner attention particularly well among that population [21,22]. What is missing from these studies is an assessment of whether FOPdesignimpacts the attention of those participants that do not have an explicit goal related to nutrition. In other words, the results do not speak to the question ofhow effectiveFOPs are among the gen-eral population. It is still unclear which designs best garner attentionamong participants with-out a nutrition relevant task.
The distinction between participants with and without a nutrition-related goal is an impor-tant one practically and theoretically. From the practical standpoint, a label that garners atten-tion, even among participants who are not explicitly seeking nutritional informaatten-tion, is likely to impact a greater segment of the population. From a theoretical standpoint, the two scenarios (with and without a nutritional goal) tap different attentional systems. Two systems are gener-ally regarded as governing attention: a bottom-up system and a top-down system [33]. These systems are associated with distinct neural pathways, and have different time courses. When information search is goal-driven, attention is driven in a top-down fashion toward goal-rele-vant stimuli; whereas in the absence of goals, attention wanders to the most visually salient sti-muli [33]. As a result, it is unclear whether or not a label that works well under volitional (top-down conditions) will also perform well under involuntary bottom-up conditions.
longer time gazing at packages that contained a traffic light label compared to those that did not. However, the method only allowed the research team to make inference regarding eye movement with regard to the entire package. This raises the possibility that the FOP did attract attention to itself but whether or not the nutrition information was explicitly attended remains unclear.
Interestingly, Koenugstorfer’s team noted that the presence of the semi-directive traffic light label interacted with the appearance of the directive design, a“Health Check Mark”designed to provide an overall evaluation of the healthfulness of the product, a directive design. When the Health Check appeared alone, people spent very little time viewing packages. But when the package displayed both a Health Check and the traffic light, people looked at the packages for significantly longer. This finding suggests that the traffic light was attended, altering the impact of the Health Check. The finding that the traffic light label may have altered the use of other nutritional information highlights a second gap in our knowledge. Specifically, that there is lit-tle data investigating how the presence of an FOP may impact attention to the more compre-hensive information presented in the Nutritional Facts Panel (NFP).
In our study, we employ a high-resolution eye tracking method that enabled us to isolate fixa-tions on specific secfixa-tions of the package to more precisely detect the attentional patterns when peo-ple without explicit, nutrition-related goals interacted with actual packages with and without FOP labels. This is important, because it has been suggested that the FOP could act either as a prime or shortcut for the more comprehensive, required nutritional information contained within the NFP.
Determining whether the FOP primes or substitutes more complete nutrition information is an important area of inquiry for two reasons. Koenugstorfer’s work [34] supports the idea that the presence of different types of nutrition labels can influence the attention devoted to others. Additionally, it has been argued that an over-reliance on the limited nutrition informa-tion in an FOP may reduce a consumers’ability to decide what is most appropriate for him/her based on individual needs [35,36] (i.e. consumers should access the comprehensive informa-tion to make truly informed decisions regarding appropriate dietary choices).
Our experiment allowed us to objectively investigate what portions of each package partici-pants (not tasked with a nutrition-related task) viewed.
Objectives
Using an Applied Science Laboratories 501 bright pupil, head mounted eye tracker (ASL Bos-ton, MA), we tracked the gaze position of 55 participants as they interacted with novel cereal and cracker packages created for this research in order to:
1. Determine whether the presence of an FOP increased attention to nutrition information in participants that were not specifically charged with a task that required nutrition
information.
2. Study the interplay between FOP labels and existing, comprehensive nutrition information (i.e. the NFP) to address whether the FOP is used in lieu of the NFP or primes nutritional information, making people more likely to use the NFP.
Materials and Methods
Participants
To obtain a diverse sample that represented at-risk participants, we recruited adult partici-pants from Michigan State University (MSU) campus list serves and extension programs housed at the Ingham County Health Department. The programs that helped us recruit partici-pants from at-risk communities included: the Women Infants and Children (WIC) program, the Supplemental Nutrition Assistance Program (SNAP) and the Expanded Food and Nutri-tion EducaNutri-tion Program (EFNEP) with the assistance of MSU Extension (MSUE). These are government supported programs that assist people with limited resources in acquiring the: food, knowledge, skills, attitudes and behaviors necessary for nutritionally sound diets
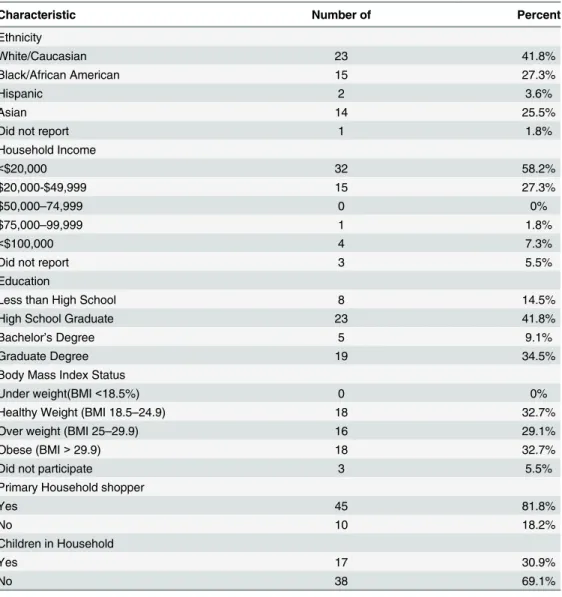
We recruited a total of 74 participants, 12 of whom were not included in the study due to technical difficulties with the instrument calibration process, and hence their eye movements could not be tracked. Data collected from an additional seven subjects were excluded from analysis due to poor quality of the captured track (e.g. excessive eye blinks, movement of the head, etc.). As such, data from 55 (31 Female) participants were used for analysis. Participants ranged in age from 18 to 72 (M = 36.6, SD = 14.3).Table 1presents the participant characteris-tics in terms of ethnicity, household income, education level, and weight status. For the pur-pose of statistical analyses, educational level was grouped into two categories, those that had completed a high school degree (or more) and those that had not. Similarly, income level was
Table 1. Participant Characteristics.
Characteristic Number of Percent
Ethnicity
White/Caucasian 23 41.8%
Black/African American 15 27.3%
Hispanic 2 3.6%
Asian 14 25.5%
Did not report 1 1.8%
Household Income
<$20,000 32 58.2%
$20,000-$49,999 15 27.3%
$50,000–74,999 0 0%
$75,000–99,999 1 1.8%
<$100,000 4 7.3%
Did not report 3 5.5%
Education
Less than High School 8 14.5%
High School Graduate 23 41.8%
Bachelor’s Degree 5 9.1%
Graduate Degree 19 34.5%
Body Mass Index Status
Under weight(BMI<18.5%) 0 0%
Healthy Weight (BMI 18.5–24.9) 18 32.7%
Over weight (BMI 25–29.9) 16 29.1%
Obese (BMI>29.9) 18 32.7%
Did not participate 3 5.5%
Primary Household shopper
Yes 45 81.8%
No 10 18.2%
Children in Household
Yes 17 30.9%
No 38 69.1%
grouped into two categories, those who reported household annual incomes of less than $20,000 and those who earned more.
Eye tracking
Participants were seated at a desk that was set up either in a university lab or a room in the Ing-ham County Department of Human Services Building. The desk had a fixture comprised of a mounted sheet of clear plastic (used as a calibrated viewing plane) and a padded chin- rest that was used to maintain each participant’s head position. Using a 9-point floating technique, the eye tracker was calibrated to the plane for each individual. This calibration technique is described thoroughly in our previous publications [37,38], and enables us to accurately track the gaze of participants while they interacted with actual food packages; specifically we examined behavior while subjects interacted with brands of cereal and crackers that we created for the study (Fig 2A).
Once calibrated, the following instructions were read to participants,
“We are interested in how people perceive box labels.We’re going to show you packages for
some new crackers and cereal.Please look at these packages as if you were thinking of buying
them.You will see 8 packages.Please continue to look at each until I tell you to stop.You may look at any side of the package,but please press the package against the plastic pane while viewing it so that we can accurately track your eyes.”
Published times that consumers spend viewing products when making a purchased decision are varied; ranging on average from 12.2 seconds [39] collected in a store environment to 25 seconds measured as part of an eye tracking study [40]; these times mark a range consistent with gaze durations reported more recently by Koenigstorfer et al. [34]. As such, our partici-pants viewed each package for a period of 20 seconds (as measured with a stop watch) while we tracked their eye movements. Order of package presentation was randomized across partici-pants to mitigate any potential order effects.
Stimuli. Four novel brands of crackers and four novel brands of cereal were created for use in the study (Fig 2A). For each brand of cereal and of crackers, we manufactured four boxes corresponding to factorial combinations of 2 levels of FOP (present/absent) X 2 levels of health (healthy/unhealthy), thus yielding a total of (2 FOP levels x 2 health levels x 2 products x 4 brands per product =) 32 boxes. Any given participant saw only eight boxes consisting of the 8 product-brand combinations. In turn, any given participant saw each of the 4 labeling condi-tions (2 FOP levels x 2 health level) on one box of crackers and on one box of cereal. The com-bination of 4 labeling conditions and 8 product-brand comcom-binations was counterbalanced across participants to prevent confounding between labeling treatments and packages.
All packages were created using ESKO ArtiosCAD1
. Graphics were designed using Adobe Photoshop CS31and printed on a HP Designjet 4520ps large format plotter on Economy Photo Satin paper supplied by Graphix Universal. These printed graphics were pasted on 16 pt coated Solid Bleached Sulfate (SBS) using a Xyron14400 Laminator. Blanks were then cut using a Flatbed Kongsberg1
1930 Sample cutting table and pasted using Grainger1
thermal glue. This process resulted in high-resolution, commercial quality, real packages, that served as the experimental stimuli.
nutrients presented on the FOP label (Fig 2B). The values for both healthy and unhealthy ver-sions were within the range of commercially available products. All remaining components not included in the FOP label were held constant, as were the lists of ingredients. All packages con-tained the standard NFP on their right side (Fig 2C). The information in the NFP always matched that in the FOP with only the components that appeared within the FOP label chang-ing across examples of the same brand.
An additional feature of our FOP labels was the use of schematic facial icons, smiling/ straight/frowning faces used as a redundant cue to the color-coded FOP [42]. A large body of evidence suggests that a face, even an‘iconic’face like the one used in our FOPs, incites atten-tion [43] [44]. Cognitive research further indicates that facial expressions of emotion are rap-idly evaluated [45–47].
Statistical Analyses. Eye tracking videos showed the participants view with the location of gaze superimposed over the video footage that was collected as participants interacted with the various packages. GazeTracker1software was used to define two areas of interest (AOI), namely the NFP and the FOP, on each frame of the eye tracking video. With the AOIs defined, the GazeTracker software coded the time to first fixate the AOI, the number of gazes at the AOI, and the total gaze duration within the AOI.
Generalized linear mixed models were fitted to each response variable. A normal distribution was assumed and responses were log or square-root transformed, as appropriate for each variable, to meet model assumptions. For all models, the linear predictor included fixed effects for label conditions (i.e. FOP label present vs. absent), health status (“healthy”vs“unhealthy”) and product type (crackers vs. breakfast cereal—Fig 2B), as well as 2- and 3-way interactions. The linear predic-tor also considered the random effect of subject fitted as a blocking facpredic-tor, as well as its cross prod-uct with the main effect to properly recognize their level of replication (i.e. experimental units). Random effects of brand nested within product were considered but removed from the final model as the corresponding variance components converged to zero. Demographic variables, including BMI category, age, gender, income level, education level, color blindness, visual acuity, and presence of children in the household were considered as potential explanatory covariates and were included in the modeling process whenever they were found to improved model fit.
Degrees of freedom were estimated and standard errors were adjusted using Kenward-Rog-er’s procedure. Relevant pairwise comparisons were performed using either a Tukey-Kramer or a Bonferroni adjustment, as appropriate in each case, to prevent inflation of Type I error. Following inference, estimated means of interest were backtransformed and are presented in the original scale, along with corresponding 95% confidence intervals, indicated by Mestand
CI95%, respectively. All models were fitted using the GLIMMIX procedure of SAS (Version 9.2,
SAS Institute, Cary, NC).
Results
Does the presence of an FOP result in greater attention to nutrition
information?
One of our main objectives was to determine whether the presence of an FOP increased atten-tion to nutriatten-tion informaatten-tion in participants that were not specifically charged with a task that required it (Objective 1). To explore this issue we investigated
Fig 2. (2A) Principle display panels (PDP for the four brands of cereal (top row) and four brands of crackers (middle row) that were created (in the form of packages) for the experiment. (2B) PDP of a single brand of cereal depicted at high and low levels of health which include the
corresponding traffic light labels. (2C) Illustration of the standard Nutrition Facts Panel (NFP) that appears on the panel immediately to the right of the PDP on cereal boxes.
• whether the presence of an FOP increased the probability of people attendinganynutritional information (either the FOP or the NFP)
• whether FOP labels increased the speed with which nutritional information (either the FOP or the NFP) was attended, and
• the overall time spent attending to nutritional information (the FOP and the NFP).
To do so we performed analyses comparing attention toanynutrition information when an FOP label was present or absent from the package.
Probability of viewing nutrition information of any type. The probability that nutrition information ofany kindwas noticed was significantly greater (P = 0.0013) for packages with colored FOP labels (Mest= 99.6, CI95%[97.5,99.9]) compared with NFP-only packages (Mest=
90.9%, CI95%[81.5, 95.8])). This was the case regardless of whether participants looked at
pack-ages of crackers or breakfast cereal at healthy or unhealthy levels of content.
To compliment this finding, we conducted an additional evaluation and considered whether the FOP was more effective than the NFP at attracting attention. For this purpose, we compared the probability of fixation of the FOP vs that of the NFP in the subset of stimuli in which both labels were present. In these conditions there was no evidence that participants were more or less likely to fixate the FOP than the NFP (Mest= 100% vs 99.9% respectively, CI95%[99.3, 100] for
both, P = 0.979). This may be partially explained by the fact that both labels were fixated at near ceiling levels (i.e. 100%), likely because participants viewed each package for a total of 20 seconds, which constitutes a relatively long time for decision making at point of purchase. Studies report average times for decision making ranging from 12 seconds [39] to 25 seconds [40].
Time to first fixation of nutrition information of any type. Analysis of the time to first fixation also supports the use of FOPs. Overall, nutrition information was noticed over 3 times quicker (P<0.0001) on packages that displayed FOP labels (Mest= 2.4s, CI95%[2.0,2.9]) com-pared to packages displaying only the current US standard for nutrition information, namely the NFP (Mest= 7.9s, CI95%[7.0, 8.8]). This effect was apparent for both products (i.e. crackers
and cereals), regardless of the health level of the food content.
To further compliment this finding, we considered how rapidly FOPs and NFP attracted attention. For this purpose, we compared the time to first fixate the FOP vs time to first fixate the NFP in the subset of stimuli in which both labels were present. This analysis showed a clear FOP advantage, whereby the FOP was first fixated much earlier in viewing than the NFP (Mest= 2.25,
CI95% [1.80, 2.75] seconds vs. Mest= 9.72, CI95%[8.84, 10.65] seconds, respectively; p = 0.0001).
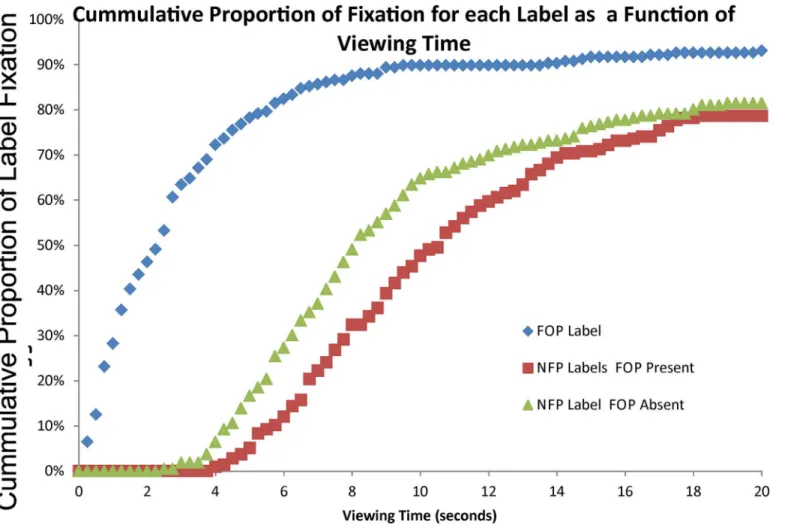
To further visualize the dynamics with which FOP and NFP labels attracted attention,Fig 3
presents the cumulative proportion of all FOP and NFP labels that were fixated as a function of viewing time during a trial. Studies indicate time to purchase decision to be relatively short [39,
40], thus suggesting that the creation of nutrition information that captures attention quickly is imperative. Note that by five seconds into viewing time, about 80% of the FOPs had been attended, whereas fewer than 20% of the NFPs had been attended by this point, regardless of whether the stimuli contained an FOP or not.
Total viewing time of nutrition information of any type. In addition to faster times to fixate nutrition information, participants spent more time viewing nutrition information of any kind when the package had an FOP label as compared to those without (Mest= 6.1,
CI95%[5.2,7.1] seconds vs. (Mest= 5.2, CI95%[4.4, 6.2] seconds, respectively) (P = 0.0032). After
accounting for labeling conditions, product types (cereal vs. crackers) also differed on the total time that people spent viewing nutrition information (P = 0.0070), whereby more time was spent on the cereal products ((Mest= 6.10, CI95%[5.15,7.13] seconds) when compared with the
cracker products also differed in total viewing time of the nutrition information (P = 0.0096) that was presented. Specifically, unhealthy products generated significantly longer total time spent on nutrition information ((Mest= 6.0, CI95%[5.07,7.00] seconds) than those produced at
healthy levels ((Mest= 5.34, CI95%[4.47,6.29] seconds]).
Does the FOP act as a prime for, or eclipse more comprehensive
nutrition information?
Our second objective was to study the interplay between FOP labels and existing, comprehen-sive nutrition information (i.e. the NFP) to address whether the FOP is used in lieu of the NFP or primes nutritional information, making people more likely to use the NFP. To explore this issue we investigated
• the probability of viewing the NFP as a function of the FOP presence
• the time to first fixate the NFP as a function of FOP presence
• the total time spent viewing the NFP as a function of FOP presence
• the number of visual hits to the NFP as a function of FOP presence
Fig 3. Plots the percentage of each type of nutritional label that has been fixated as a function of viewing time.Data were collapsed across participants so the percentage was based on the number of labels fixated out of the 220 total labels per label type (4 labels x 55 participants)
Probability of viewing the NFP as a function of FOP presence. There was no evidence for any effect of presence of FOP labels on the probability of detecting the NFP (P = 0.59), nei-ther any evidence for differences between product types or health levels (P = 0.60 and 0.68, respectively). The estimated probabilities of fixating the NFP ranged approximately from 85 to 95% across labeling conditions and products. As mentioned in a previous section, such high fixation rate may be partially explained by the relatively large amount of time that participants were allowed to view the packages (i.e. 20 seconds).
Time to first fixation on the NFP as a function of FOP presence. We detected evidence for a main effect of FOP presence on the time to first fixate the NFP (P<0.0001), such that fixa-tion of the NFP was delayed on packages that had an FOP label relative to those that did not (Mest= 9.27, CI95%[8.43,10.2] vs. Mest= 7.49, CI95%[6.81, 8.23] seconds, respectively). None of
the interaction terms were significant (all P>0.16); that is, NFP fixation was delayed in the presence of an FOP label for both types of products regardless of health level.
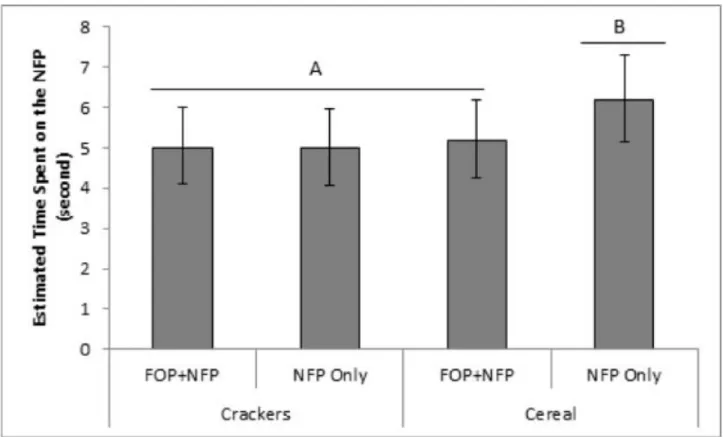
Total time spent on the NFP as a function of FOP presence. When we examined the total time spent viewing theNFP only, we found evidence for a 2-way interaction between product type and whether FOP labels were present or not (P = 0.0486). For packages of break-fast cereal, people viewed the NFP for a shorter time when the FOP was present as compared to absent (Mest= 6.2, CI95%[5.2,7.3] seconds vs. Mest= 5.2, CI95%[4.2, 6.2] seconds;
P = 0.0085). In turn, there was no evidence for any differences in time spent viewing the NFP when cracker packages with or without FOP labels were compared (Mest= 5.0, CI95%[4.1,6.0]
seconds vs Mest= 5.0, CI95%[4.1, 6.0] seconds, respectively; P = 0.95). Follow-up comparisons
suggest that the time spent viewing the NFP for cereal packages that did not have an FOP was significantly longer than for other treatments (all p<0.05) (Fig 4).
A main effect of the product’s healthfulness was also evident on the total time spent viewing the NFP (P = 0.0053), with unhealthy products garnering more time on the NFP than products presented at a healthy level (Mest= 5.7, CI95%[4.78, 6.64] seconds vs Mest= 4.97, CI95%[4.14,
5.87] seconds, respectively).
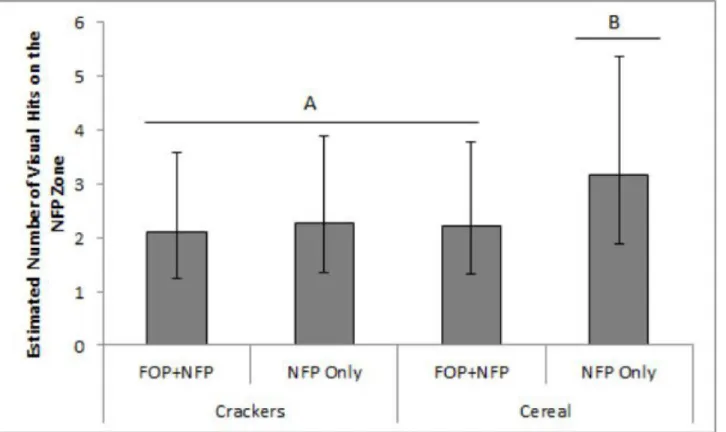
Number of visual hits to the NFP. A similar pattern was apparent when we considered the number of visual hits to the NFP as the response of interest. A 2-way interaction between product type and the FOP presence was apparent (p = 0.038). Specifically, the number of times a participant’s eyes returned to the NFP depended on whether the FOP label was present or not in cereal packages, but not in cracker packages. Cereal packages had a significantly fewer number of visual hits to the NFP when an FOP label was present relative to when it was not (Mest= 2.2, CI95%[1.2, 3.8] hits vs. Mest= 3.2, CI95%[1.9, 5.4] hits, respectively; p = 0.0002). In
turn, there was no evidence that the presence of an FOP influenced the number of hits on the NFP for cracker packages (Mest= 2.1, CI95%[1.2, 3.6] hits when the FOP was present vs Mest=
2.3, CI95%[1.3, 3.9] hits in when it was not (p = 0.4) (Fig 5). Follow-up comparison suggests
that there were significantly more gazes at the NFP label in the NFP-only cereal condition, that is when cereal packages did not have an FOP label, than in any other product-label conditions (all p<0.02) but that no significant differences were apparent amongst the other three condi-tions (all P>0.84) (Fig 5).
Discussion
Does an FOP result in greater attention to nutritional information?
80% of FOPs were fixated whereas fewer than 20% of NFPs were by this point in viewing time. Additionally, people spent significantly more time fixating nutrition information (either the FOP or NFP) when a colored FOP was present.
While these findings are broadly consistent with prior work that suggests that colored FOP labels increase attention to nutrition information [48], our data extend previous work in two important ways. First, the effect of FOP was apparent even when people who were not given a nutrition-relevant goal; as such, FOP labels seem likely to engage attention broadly. Second, we directly compared attention to the FOP label relative to the NFP on a given package and found that the FOP was better at attracting attention than the NFP. This type of direct comparison of an FOP to standard nutrition information is important in that it can be used in policy discus-sions regarding the creation and implementation of new labeling standards.
Interestingly, we also found that participants seemed to spend more time viewing nutrition information when the label indicated an unhealthy food product. This is encouraging as it sug-gests that people are sensitive to differences in the FOP label content. In addition, the finding that people spend more time attending to the labels depicting unhealthy foods is consistent with prior work that suggests an attentional bias towards and slower disengagement from nega-tive or threatening stimuli [49–52].
The type of food product also impacted overall time spent fixating on nutrition information, whereby people spent more time viewing nutrition information for cereals than for crackers. As a possible explanation of why the nutrition information of cereals was viewed for a longer time than crackers, we speculate that cereals might have been perceived as a meal while crack-ers might have been perceived as a snack. If so, this would suggest that people are more
Fig 4. Estimated mean total eye-gaze time spent on the Nutrition Facts Panel for cereal and cracker packages that did and did not include an FOP label.A 2-way interaction was apparent between product type and whether an FOP label was present or not, P<0.05.)
motivated to view nutrition information when the food is perceived as comprising a greater portion of one’s diet. Consistent with this interpretation, others have found that people spend significantly more time viewing the nutritional information of meals than snacks, in a mock purchasing scenario. [53] Alternatively, one could also explain this result in noting that prod-ucts that widely range in nutrition value may induce different behaviors than those with more predictable nutrition contents. Under this explanation, people might be more interested in the nutrition information of cereals because they vary greatly, from nutrient dense to nutrient poor alternatives. In contrast, crackers may be considered a more standardized product, in which case nutrition information may be considered less important to assess.
Although not assessed, the presence of a diet-related health problem such as diabetes may also impact the types of foods that are more likely to receive more attention. This is not beyond the realm of possibility, as prior work has found that attention to nutrition information is impacted by factors specific to the viewer. For instance, health motivation (high motivation vs low motivation [54]) and goals (health vs preference or taste [48,55]) can impact the time that people spend viewing nutrition information. It has also been suggested that the use of front of pack labels impacts food choice for sustained periods [56].
Although our data cannot distinguish between these and other possible alternative explana-tions, they support the fact that people seem to modify their attention to nutrition information as a function of food product. Additional research investigating how motivations and beliefs about potential nutrition variability in foods is needed in order to optimize labeling strategies on a product-specific basis.
Fig 5. Estimated number of visual hits on the Nutrition Facts Panel for cereal and cracker packages that did and did not include an FOP label.A 2-way interaction was apparent between product type and whether an FOP label was present or not.a,bP<0.05
Does the FOP replace or prime the NFP?
We also studied the question of how the presence of an FOP label impacts consumer behavior with regard to the NFP. This is important, because the presence of FOP labels, which simplify nutrition information substantially, may be used as a short-cut, leading people to ignore the more comprehensive information that is presented elsewhere on the package. In the US, this comprehensive (required) labeling takes the form of the Nutrition Facts Panel (NFP), located on the panel directly to the right of the Principle Display Panel (PDP) (Figs1Aand2C). Given that a healthy dietary choice for an individual is based on a confluence of factors (e.g., age, sex, activity level, health status, cultural values, and serving size [57]), amongst others, over-reliance on the limited nutrition information in an FOP may reduce a consumers’ability to make appropriate choices based on their specific, personal dietary requirements [35,36].
These limitations have led some to suggest that health and nutrition claims should be elimi-nated entirely from package fronts, and that, instead, efforts should be made to improve exist-ing nutrition labelexist-ing [58]. The goal of this approach would be to provide comprehensive nutrition information, similar to that in the currently regulated NFP, but to do so in a format that makes the information more understandable and readily available to the consumer. In direct contrast, others claim that positioning nutrition information on the front of packages is needed. It has been suggested that people with low motivation for healthful choices pay more attention to information on the front of the package than to other panels of the package [59]; and that those with health motivations will use information from the FOP label as a catalyst to access the more comprehensive NFP [54].
We found no evidence that the FOP primes attention to the NFP. On the contrary, our results suggested that the presence of the FOP label on a cereal box lowered the amount of attention to the NFP. Specifically, the NFP was fixated later in the viewing period and for a shorter period of time. This pattern is consistent with the idea that the FOP label replaces the NFP and serves as a short-cut to nutritional information. However, it is important to note that this replacement effect was product-specific as it was only evident with cereals. In fact, the amount of time spent viewing the cereal NFP was relatively high when the NFP provided the only means to evaluate the nutritional value of the cereal (Fig 4).
In short, these data suggest that the simultaneous presence of the FOP onthe cereal package
was used in lieu of the more comprehensive information in the NFP (i.e the short cut effect). As a possible interpretation of this pattern, we speculate that people are more motivated to evaluate the nutrition information for cereals than crackers (see discussion related to total time spent on nutrition information in cereal packages vs crackers). As a result, the amount of time spent viewing the NFP for cereals is relatively high when the NFP provides the only means to evaluate the nutritional value of the cereal. If, however, the FOP is present, it is detected early in the viewing and participants fulfill their need for nutrition information by viewing the FOP. Having addressed that need, they are no longer motivated by nutrition information once they reach the NFP. In short, these data suggest that the simultaneous presence of the FOP on the cereal package was used in lieu of the more comprehensive information in the NFP (i.e the short cut effect).
good. They found that people seeking healthy foods fixated both the NFP and FOP more than those seeking tasty foods, and concluded that the FOPs were not used as short-cuts but, instead, as another source of nutritional information. However, there are substantial differences between our study and that by Turner et al. [54]. Turner et al. presented both the front panel and NFP on the same screen at the same time in a flattened view. This may have artificially increased the amount of attention paid to the NFP. In addition, they gave some participants an explicit goal of seeking healthy products, whereas we did not. Finally, the study by Turner et al. used images of commercial packages from the US market. Given that FOPs are not regulated in the US, these are likely to have been FOP systems developed by the product manufacturers. These systems are variable, and can be perceived as unreliable [60], both of which may decrease reliance on the FOP. Further, participants familiarity, or lack thereof with each of the brands may have altered their interactions with the nutrition information.
Regardless, our data show that, in specific instances, the FOP has the potential to serve as a shortcut for the more complete information on the NFP. As such, more research specific to sit-uations where this type of short-cut occurs is warranted.
Overall, the pattern of results we present suggest that the presence of an FOP increases attention to any nutritional information, but that the FOP may, at least for some food products, reduce attention to the NFP.
Conclusions
Our work strongly supports the idea that FOP labels are effective at garnering attention to nutrition information. The added presence of color-coded FOP labels on food packages attracted attention to nutrition information more rapidly and increased the total time that peo-ple spent attending to any nutrition information. However, we also found that FOP labels can be used, under certain situations, as a short-cut, thereby decreasing people’s attention to the more comprehensive information found in the NFP. For the scenarios considered in this study, we found no evidence that the presence of FOP labels primed attention to the comprehensive nutrition information on the NFP. These findings have practical implications for policy. First, our finding that FOP labels can, under some circumstances, reduce attention to comprehensive information in the NFP, suggests that any attempt to standardize FOP labels should ensure that that the most important information for making healthy choices appear in the FOP label. Conversely, this“short-cut”finding suggests that manufacturers should not be allowed to selectively report nutrition information on the front-of-pack, as it has the potential to mislead consumers. However, we believe that the attentional benefits of the FOP outweigh the potential negatives. FOP labels produced a dramatic increase in the speed with which people attended to nutrition information, and increased the overall amount of time spent attending to nutrition information. Moreover, the existing literature suggests that FOP labels may not act as a short-cut when people are explicitly interested in nutrition information [54] and that these labels can catalyze more healthful choices [61] for a sustained period of time [56]. Given the magnitude of the evidence that too few people currently attend to nutrition information [62], raising awareness, even to partial nutrition information, constitutes a step towards fostering informed food choices and potentially impacting overall dietary quality.
Supporting Information
S1 File. Raw data—Flat File. (XLSX)
Acknowledgments
The project described was supported by Award Number R21CA155818 from the National Cancer Institute. The content is solely the responsibility of the authors and does not necessarily represent the official views of the National Cancer Institute or the National Institutes of Health. Further, Laura Bix, one of the coauthors, has salary support through the Hatch Act (USDA) as a Michigan Ag Bio Station researcher.
The authors would also like to express their deep gratitude to Joyce McGarry, and all of the Extension Educators at Ingham County. This group provided contacts, suggestions, physical space and other support that was critical for reaching a breadth of study participants. Their patience and help was much appreciated.
Author Contributions
Conceived and designed the experiments: LB MB NB RS. Performed the experiments: RS CP. Analyzed the data: RS NB MB. Contributed reagents/materials/analysis tools: LB NB RS. Wrote the paper: LB NB MB RS LW CP.
References
1. Pi-Sunyer FX. Medical Hazards of Obesity. Annals of Internal Medicine. 1993;119(7: Part 2):655–60. doi:10.1059/0003-4819-119-7_Part_2-199310011-00006
2. Colditz GA. Economic costs of obesity and inactivity. Medicine & Science in Sports & Exercise. 1999; 31(11):S663.
3. Finkelstein EA, Fiebelkorn IC, Wang G. National medical expenditures attributable to overweight and obesity: How much, and who's paying? Bethesda, MD, ETATS-UNIS: Project Hope; 2003. 1 p.
4. Wolf MA, Colditz AG. Current Estimates Of The Economic Cost Of Obesity In The United States. Silver Spring, MD, ETATS-UNIS: North American Association for the Study of Obesity; 1998. 10 p.
5. European Food Information Council. Global update on nutrition labelling: Executive Summary Brussels, Belguim: European Food Information Council; 2013 [Accessed 15 August 2014]. February 2013:[Avail-able:http://www.eufic.org/upl/1/default/doc/GlobalUpdateExecSumFeb2013_FINAL.pdf.
6. Hodgkins C, Barnett J, Wasowicz-Kirylo G, Stysko-Kunkowska M, Gulcan Y, Kustepeli Y, et al. Under-standing how consumers categorise nutritional labels: A consumer derived typology for front-of-pack nutrition labels. Appetite. 2012; 59:806–17. doi:10.1016/j.appet.2012.08.014PMID:22918174
7. Grocery Manufacturers' Association. Facts-up-front: Overview 2014 [Accessed 27 May 2015]. Avail-able:http://www.factsupfront.org.
8. Gray N. Healthy logo: Netherlands 'Choices' logo confirmed as first government-backed scheme in EU foodnavigator.com2013 [Accessed 27 May 2015]. Available:http://www.foodnavigator.com/Policy/ Healthy-logo-Netherlands-Choices-logo-confirmed-as-first-government-backed-scheme-in-EU.
9. Swedish National Food Administration. About the Keyhole 2015 [Accessed 27 May 2015]. Available: http://www.norden.org/en/nordic-council-of-ministers/council-of-ministers/nordic-council-of-ministers-for-fisheries-and-aquaculture-agriculture-foodstuffs-and-forestry-mr-fjls/keyhole-nutrition-label.
10. Smart Choices Program. Smart Choices Program: Helping Guide Smart Food and Beverage Choices 2015 [Accessed 27 May 2015]. Available:http://www.smartchoicesprogram.com/.
11. Alexander D, Hazel J. Front-of-pack nutritional labeling: Perspectives of the New Zealand Food Indus-try. New Zealand Food Authority. 2008.
12. Feunekes G. Front-of-pack nutrition labelling: Testing effectiveness of different labelling formats front-of-pack in four European countries. Appetite. 2008; 40:57–70.
14. Wansink B. How do front and back package labels influence beliefs about health claims? The Journal of Consumer Affairs. 2003; 37(2): 305–31.
15. Kelly B, Hughes C, Chapman K, Louie J, Dixon H, Crawford J, et al. Consumter testing of the accept-ability and effectiveness of front-of-pack food labelling systems for the Australian grocery market. Halth Promotion International. 2009; 24:120–9.
16. US Food and Drug Administration. Front-of-Package Labeling Initiative 2014 [updated December 9, 2014; Accessed 28 May 2015]. Available:http://www.fda.gov/Food/IngredientsPackagingLabeling/ LabelingNutrition/ucm202726.htm.
17. Rensink RA, O'Regan KJ, Clark JJ. To see or not to see:The need for attention to perceive changes in scenes. Psychological Science. 1997; 8:368–73.
18. Becker M, Pashler H. Volatile visual representations: Failing to detect changes in recently processed information. Psychonomics Bulletin and Review. 2002; 9(): 744–50.
19. Daehaene S, Changeux J, Naccache L, Sackur J, Sergent C. Conscious, preconscious, and subliminal processing: A testable taxonomy Trends in Cognitive Science. 2006:1–8.
20. Mack A, Rock I. Inattentional Blindess: An overview by Adrien Mack and Irvin Rock. MIT Press: 1998.
21. Bialkova S, Grunert KG, Juhl HJ, Wasowicz-Kirylo G, Stysko-Kunkowska M, van Trijp HC. Attention mediates the effect of nutrition label information on consumers’choice. Evidence from a choice experi-ment involving eye-tracking. Appetite. 2014; 76:66–75. doi:10.1016/j.appet.2013.11.021PMID: 24503332
22. Bialkova S, van Trijp HC. An efficient methodology for assessing attention to and effect of nutrition infor-mation displayed front-of-pack. Food Quality and Preference. 2011; 22(6):592–601.
23. Antúnez L, Vidal L, Sapolinski A, Giménez A, Maiche A, Ares G. How do design features influence con-sumer attention when looking for nutritional information on food labels? Results from an eye-tracking study on pan bread labels. International Journal of Food Sciences and Nutrition. 2013; 64(5):515–27. doi:10.3109/09637486.2012.759187PMID:23301795.
24. Ares G, Giménez A, Bruzzone F, Vidal L, Antúnez L, Maiche A. Consumer Visual Processing of Food Labels: Results from an Eye-Tracking Study. Journal of Sensory Studies. 2013; 28(2):138–53. doi:10. 1111/joss.12031
25. Goldberg JH, Probart CK, Zak RE. Visual search of food nutrition labels. Human Factors: The Journal of the Human Factors and Ergonomics Society. 1999; 41(3):425–37.
26. Jones G, Richardson M. An objective examination of consumer perception of nutrition information based on healthiness ratings and eye movements. Public health nutrition. 2007; 10(3):238–44. PMID: 17288620
27. Siegrist M, Leins-Hess R, Keller C. Which front-of-pack nutrition label is the most efficient one? The results of an eye-tracker study. Food Quality and Preference. 2015; 39(0):183–90.http://dx.doi.org/10. 1016/j.foodqual.2014.07.010.
28. Graham DJ, Orquin JL, Visschers VH. Eye tracking and nutrition label use: A review of the literature and recommendations for label enhancement. Food Policy. 2012; 37(4):378–82.
29. Orquin J, Scholderer J. Attention to health cues on product packages. Journal of Eye Tracking, Visual Cognition and Emotion. 2011;(1: ).
30. Turner MM, Skubisz C, Pandya SP, Silverman M, Austin LL. Predicting Visual Attention to Nutrition Information on Food Products: The Influence of Motivation and Ability. Journal of health communica-tion. 2014; 19(9):1017–29. doi:10.1080/10810730.2013.864726PMID:24555542
31. Van Herpen E, Van Trijp HC. Front-of-pack nutrition labels. Their effect on attention and choices when consumers have varying goals and time constraints. Appetite. 2011; 57(1):148–60. doi:10.1016/j. appet.2011.04.011PMID:21554909
32. Visschers VH, Hess R, Siegrist M. Health motivation and product design determine consumers’visual attention to nutrition information on food products. Public health nutrition. 2010; 13(07):1099–106.
33. Corbetta M, Shulman G. Control of goal-directed and stimulus driven attention in the brain. Nature Reviews Neuroscience. 2002; 3(3):201–5. PMID:11994752
34. Koenigstorfer J, Wasowicz-Kirylo G, Kunkowska M, Groeppel-Klein A. Behavioural effects of directive cues on front-of-package nutrition information: The combination matters! Public Health Nutrition. 2013. doi:10.1017/S136898001300219XPMID:23954043
35. Denby N. Dietary Expert's Story: About GDAs: Food and Drink Federation: United Kingdom; 2009 [Accessed 17 June 2014]. Available:http://www.fdf.org.uk/sevenvoices_dietitian.aspx.
37. Bix L, Bello N, Auras R, Ranger J, Lapinski L. Examining the conspicuousness and prominence of two required warnings on OTC pain relievers. Proceedings of the National Academy of Sciences of the United States of America. 2009; 106(16):6550–5. doi:10.1073/pnas.0810665106PMID:19332798
38. Sundar R. The effect of color contrast of text on the legibility and noticeability of prescription drug labels. East Lansing: Michigan State University 2009.
39. Leong S. Consumer decision making for common, repeat-purchase prodcuts: A dual replication. Jour-nal of Consumer Psychology. 1993; 2(2):193–208.
40. Chandon P, Hutchinson J, Bradlow E, Young S. Measuring the value of point-of-purchase marketing with commercial eye-tracking data 2006 [Accessed 2 June 2015]. Available:http://www.insead.edu/ facultyresearch/research/doc.cfm?did=2691.
41. Food Standards Agency. Front-of-pack traffic light signpost labelling technical guidance 2007 Novem-ber. Report No.
42. Food Standards Agency Traffic light labelling 2010 [Accessed 1 November 2010]. Available:http:// www.eatwell.gov.uk/foodlabels/trafficlights/.
43. Langton SRH, Law AS, Burton AM, Schweinberger SR. Attention capture by faces. Cognition. 2008; 107(1):330–42. PMID:17767926
44. Mack A, Pappas Z, Silverman M, Gay R. What we see: Inattention and the capture of attention by meaning. Consciousness and Cognition: An International Journal. 2002; 11(4):488–506.
45. Bishop SJ, Jenkins R, Lawrence AD. Neural processing of fearful faces: Effects of anxiety are gated by perceptual capacity limitations. Cerebral Cortex. 2007; 17(7):1595–603. PMID:16956980
46. de Gelder B, Vroomen J, Pourtois G, Weiskrantz L. Non-conscious recognition of affect in the absence of striate cortex. NeuroReport: For Rapid Communication of Neuroscience Research. 1999; 10 (18):3759–63.
47. Whalen PJ, Rauch SL, Etcoff NL, McInerney SC, Lee MB, Jenike MA. Masked presentations of emo-tional facial expressions modulate amygdala activity without explicit knowledge. The Journal of Neuro-science. 1998; 18(1):411–8. PMID:9412517
48. Bialkova S, Grunert K, Juhl H, Wasowicz-Kirylo, Stysko-Kunkowska M, van Trijp H. Attention medi-cates the effect of nutrition label information on consumers' choice: Evidence from a choice experiment involving eye tracking. Appetite. 2014; 76:66–75. doi:10.1016/j.appet.2013.11.021PMID:24503332
49. Mogg K, Bradley B. Orienting of attention to threatening facial expressions presented under conditions of restricted awareness. Cogn Emotion. 1999; 13:713–40.
50. Fox E, Russo R, Dutton K. Attentional bias for threat: Evidence for delayed disengagement from emo-tional faces. Cognition and Emotion. 2002; 16(3):355–79. PMID:18273395
51. Pratto F, John O. Automatic vigilance: The attention-grabbing power of negative social information. Journal of personality and social psychology. 1991; 61:380–91. PMID:1941510
52. Smith N, Cacioppo J, Larsen J, Chartrand T. I have your attention, please: Eletrocortical responses to positive and negative stimuli. Neuropsychologia. 2003; 41:171–83. PMID:12459215
53. Graham D, Orquin J, Visschers V. Eye tracking an nutrition label use: A review of the literature and rec-ommendations for label enhancement. Food Policy. 2012; 37:378–82.
54. Turner M, Skubisz C, Pandya S, Silverman M, Austin L. Predicting visual attention to nutrition informa-tion on food products: The influence of motivainforma-tion and ability. Journal of Health Communicainforma-tion. 2014. doi:10.1080/10810730.2013.864726PMID:24555542
55. Visschers V, Hess R, Siergrits M. Health motivation and product design determine consumers' visual attention to nutrition information on food products. Public Health Nutrition. 2010; 13(7):1099–106. doi: 10.1017/S1368980009993235PMID:20100390
56. Thorndike A, Riis J, Sonnenberg L, Levy D. Traffic-light labels and choice architecture: Promoting healthy food choices. American Journal of Preventive Medicine. 2014; 46(2):143–9. doi:10.1016/j. amepre.2013.10.002PMID:24439347
57. Centers for Disease Control and Prevention. Preventing Weight Gain 2011 [Accessed August 2014]. Available:http://www.cdc.gov/healthyweight/prevention/.
58. Nestle M, Ludwig D. Front-of-Package Food Labels: Public Health or Propaganda. Journal of the Amer-ican Medical Association. 2010; 303(8):771–2. doi:10.1001/jama.2010.179PMID:20179287
59. Acterberg C, McCullum C. Food shopping and label use behavior among high school-aged adoles-cents. Adolescence. 1997; 32(125). PMID:9105500
61. Levy D, Riis J, Sonnenberg L, Barraclough S, Thorndike A. Food choices of minority and low-income employees: A cafteria intervention. American Journal of Preventive Medicine. 2012; 43(3):240–8. doi: 10.1016/j.amepre.2012.05.004PMID:22898116