53 A program for representing and simulating population genetic phenomena
Genetics and Molecular Biology, 23, 1, 53-60 (2000)
INTRODUCTION
The WinPop program was developed for Windows 3.1 or later versions using the Visual Basic programming language; the version here described was based on earlier programs developed by groups of the Biology Department of the University of São Paulo using BASIC [PopGen (Otto and Matioli, 1987)] and PASCAL [SuperPop (Reis and Matioli, 1994)] programming languages for DOS inter-face. The present version is a slightly modified version of a previously developed (Nuin, 1998) and comprises dif-ferent modules that represent or simulate the following: panmixia, inbreeding, assortative matings (exclusive or in admixture with panmixia), selection, random genetic drift, mutation pressure and gene flow.
RESULTS
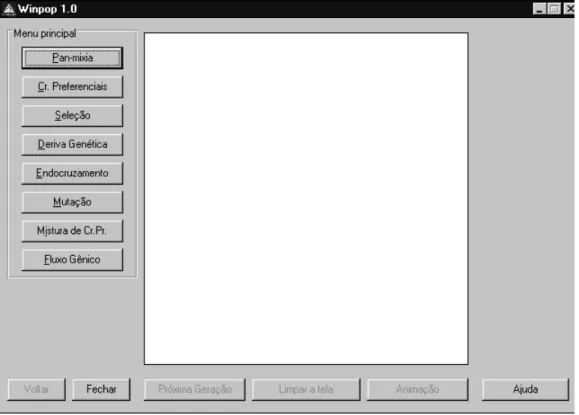
Figure 1 shows the main interface of the program and, like all figures illustrating this article, is a bitmap retrieved from the program running in real time in an IBM PC-compatible computer. As one can see from this and from other illustrations, the present version of the pro-gram shows all legends, explanations, user instructions and text help files in Portuguese. An English version is already under preparation and shall be opportunely announced in this journal.
These phenomena are represented graphically using either the isosceles triangular coordinate system (Otto and Benedetti, 1995; see Figure 2), or the classical Cartesian rectangular system. In the triangular represention, the user can also choose to show De Finetti’s parabola, that repre-sents the set of population points in Hardy-Weinberg pro-portions. Initial conditions of each situation under study must be entered. The points of successive generations can be obtained manually, generation by generation, or auto-matically by animation. Gene and genotype frequencies
are plotted automatically in the graphs for each genera-tion. Their values and other genetic parameters of rel-evance are displayed simultaneously in text-boxes and in small histograms bordering the main graph. All graphs gen-erated can be saved as bitmaps for further printing. Some simulations can be stored as text-files for inspection at a later occasion.
Figures 3 and 4 show that the panmixia module makes it possible to represent the population evolution towards the equilibrium state in the case of autosomal as well as of sex-linked alleles.
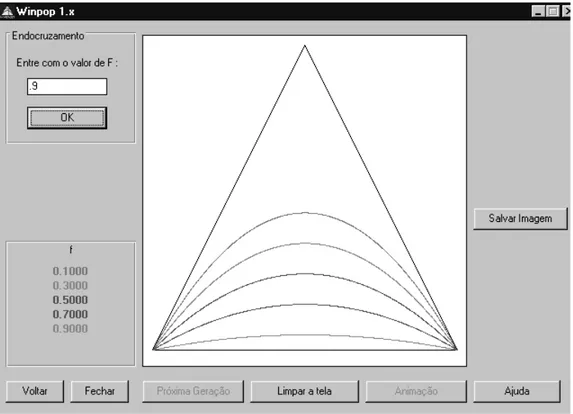
Figure 5 demonstrates that the inbreeding module presents a series of curves representing the equilibrium population points as functions of gene frequencies and the average inbreeding coefficient (or fixation index) F.
Assortative mating systems are comprehensively studied as either forbidden or sterile crossings (14 dif-ferent models of each). Figures 6 and 7 show that this module includes an option that automatically generates typical representations for different initial conditions, displaying the dynamic properties of each model, with population trajectories, domains of attraction and stable and unstable equilibrium points.
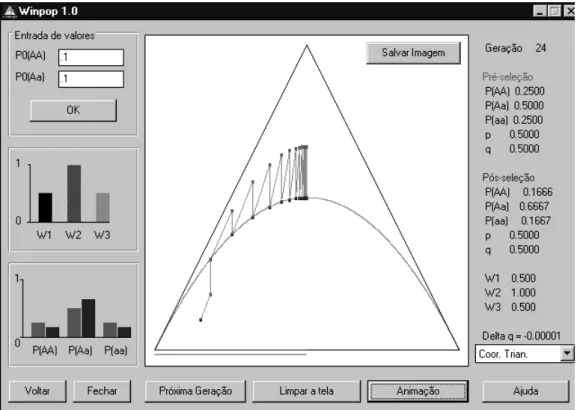
Two different selection models (general and fre-quency-dependent) are presented in the selection module, using the triangular representation system (Figure 8) or the rectangular one, in which the graph plots differences between gene frequencies in two consecutive generations - the delta-q method (Figure 9).
Genetic drift is studied in a two-part module. The first simulates the process with or without soft selection (replacement). It enables the simultaneous study of hun-dreds of different populations starting with the same ini-tial gene frequencies and the same population number. The results can be viewed either in the triangular or in the rec-tangular systems (Figure 10); the first system shows the genotypic frequencies as well as the parabola
represent-METHODOLOGY
A program for representing and simulating population genetic phenomena
Paulo A.S. Nuin and P.A. Otto
Abstract
The paper describes a computer program for representing and simulating population genetic phenomena, such as the distribution of gene and genotype frequencies under different mating systems (panmixia, inbreeding and assortative mating systems) and under influence of evolution factors (mutation, selection, gene flow and genetic drift). The program was written in Visual Basic (Microsoft, Inc.) and is able to run in any IBM-PC compatible computer running Windows 3.1 or later versions.
54 Nuin and Otto
Figure 1 - Main graphic interface of the program, showing the plot area and all simulation and representation options.
Figure 2 - Triangular representation of genotypic and gene frequencies (d = frequency of AA homozygotes, h = frequency of Aa heterozygotes and r = frequency of aa homozygotes; p = d + h/2 = allele A frequency and q = h/2 + r = allele a frequency), using an isosceles triangle of unitary height and base. It is easy to see that d + h + r = 1 and that the projections p and q in the triangle base are not distorted, adding up to one.
ing Hardy-Weinberg proportions. Simulations performed can be saved as a text that includes goodness-of-fit tests for each simulation performed. The second part of the module shows the Markovian representation of the evo-lution of populations of size n, including all elements of the vector of states and the transition matrix of dimen-sions (2n + 1) x (2n + 1), an example of which is shown in Figure 11.
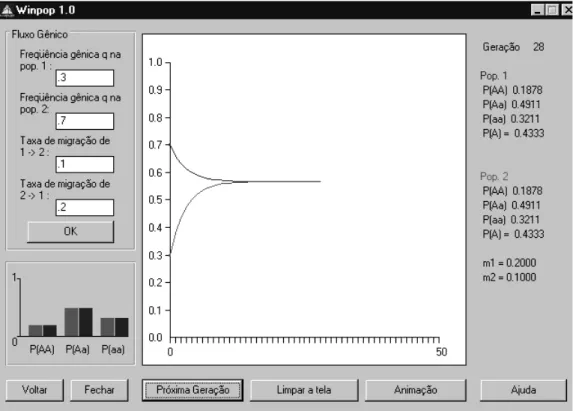
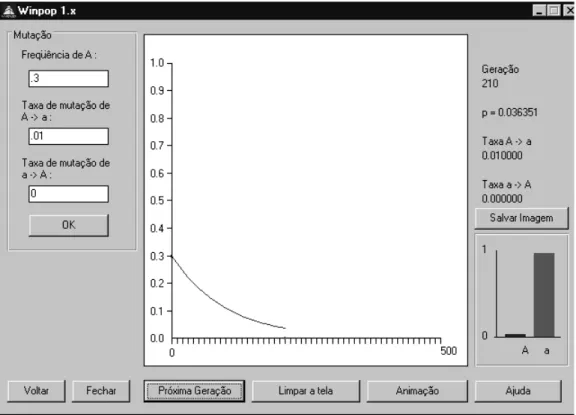
The effects of uni- or bidirectional mutation or mi-gration rates are also considered by two other modules of the program (Figures 12 and 13).
The program also contains help and text sections, the latter describing all the formulae and elementary back-ground used to develop the program code.
REQUESTS FOR THE PROGRAM AND COMMENTS ON ITS USE
The executable program (including its non-compiled code, that can be of interest to programmers) can be or-dered at no cost from Paulo A.S. Nuin (e-mail address, [email protected]). A copy of the executable file - winpop.exe
-will be sent via e-mail in answer to requests, together with updated auxiliary files - cmdialog.vbx, gauge.vbx, grid.vbx and threed.vbx, a copy of vbrun300.dll and a help file - winpop.hlp. All library files (with extensions .dll
55 A program for representing and simulating population genetic phenomena
Figure 3 - Population trajectory towards panmictic equilibrium in the case of an autosomal locus: in one generation the population point is above the Hardy-Weinberg parabola.
56 Nuin and Otto
Figure 5 - Equilibrium population genotypic frequencies under inbreeding; five examples are shown, for values of F = 0.1, 0.3, 0.5, 0.7 and 0.9.
57 A program for representing and simulating population genetic phenomena
Figure 7 - Dynamical properties of an assortative mating system, showing equilibrium points and domains of attraction, automatically generated by option “pontos de equilíbrio”.
58 Nuin and Otto
Figure 9 - The same model as in Figure 8, shown as a delta-q graphics.
59 A program for representing and simulating population genetic phenomena
Figure 11 - Markovian representation of the fate of a population of size 3. The figure shows, in this case, the 7 x 7 transition matrix and the vector of population state probabilities at generation 5.
60 Nuin and Otto
Figure 13 - Results of mutation pressure, as represented by the program, using the parameters shown in the text-boxes at left.
root C directory (e.g., c:\winpop) of the hard disk. Al-though it has already been tested at Evolution and Popula-tion Genetics classes at the Biology Department of the University of São Paulo, the program probably still con-tains some minor bugs. Comments on these and on the program itself are most welcome at the electronic address above.
ACKNOWLEDGMENTS
Research and publication supported by FAPESP.
RESUMO
O artigo descreve o funcionamento de um programa capaz de representar e simular vários fenômenos de pertinência em genética de populações, como a distribuição de freqüências gênicas e genotípicas sob regime de diversos tipos de sistemas de
cruzamentos, como pan-mixia, endogamia e cruzamentos prefe-renciais e sob influência de fatores evolutivos como mutação, sele-ção, fluxo gênico e deriva genética. O programa foi desenvolvido em Visual Basic (Microsoft, Inc.) e pode ser executado em qualquer computador IBM-PC compatível, em ambiente Win-dows 3.1 ou versões posteriores.
REFERENCES
Nuin, P.A.S. (1998). Desenvolvimento de um programa de genética de populações com aplicações didáticas e de pesquisa. Master’s thesis, Departamento de Biologia do Instituto de Biociências da USP, São Paulo, SP.
Otto, P.A. and Benedetti, L.A. (1995). A note on the graphical representation of genotype frequencies in population genetics. J. Hered. 86: 163-164. Otto, P.A. and Matioli, S.R. (1987). PopGen. Population Genetics Program using the BASIC language. Complete listing in Nuin (1998), pp. 1-10. Reis, E.A. and Matioli, S.R. (1994). SuperPop. Population Genetics Program
using the PASCAL language. Complete listing in Nuin (1998), pp. 14-29.