45
Sampling effort and fish species richness in small
terra firme
forest streams
of central Amazonia, Brazil
Maeda Batista dos Anjos* and Jansen Zuanon**
Small streams are important components of the landscape in terra firme forests in central Amazonia and harbor a large number of fish species. Nevertheless, the lack of a common sampling protocol in studies of this ichthyofauna hinders comparisons among available results. This study evaluates how the length of stream reach sampled affects estimates of local fish species density in 1st, 2nd, and 3rd order streams, and proposes a mean minimum sampling length that best approximates the absolute number of species in a given stream segment. We sampled three streams in the Biological Dynamics of Forest Fragments Project’s study sites, between May and August 2004. At each stream, one 1storder, one 2nd order, and one 3rd order segment was sampled. We sampled five 20-m reaches in each stream segment. Three to four people collected along each reach for 45 to 60 minutes. We used Jaccard’s coefficient to estimate the similarity of species composition among stream reaches and segments. Estimates of species richness were obtained with Jackknife 1 and Bootstrap algorithms and species accumulation curves. We used simple linear regressions to look for relationships between species density and fish abundance and between species density and the volume of 100-m stream segments. Species density in 1st order stream reaches was slightly higher than in 2nd and 3rd order stream reaches, whereas fish abundance was apparently higher in 3rd order reaches. Similarity in fish species composition between 20-m reaches was low for all studied streams. Species density values in pooled 100-m stream segments represented 71.4% to 94.1% of the estimated values for these streams. Species density showed a direct relationship both with volume of the sampled stream segment and fish abundance. It seems plausible that larger streams contain a higher number of microhabitat types, which allow for the presence of more fish species per stream length. Based on the values of asymptotes and equations for species accumulation curves, the mean minimum sampling length that best estimates the absolute number of species in a stream segment is 180 m ± 20 sd for 1st order segments; 213 m ± 23 sd for 2nd order segments, and 253 m ± 30 sd for 3rd order stream segments.
Pequenos igarapés são componentes importantes da paisagem das florestas de terra firme da Amazônia Central e abrigam um grande número de espécies de peixes. Contudo, a falta de um protocolo de amostragem comum em estudos desta ictiofauna dificulta a comparação dos resultados obtidos. Este estudo avalia como o comprimento dos trechos amostrados afeta as estimativas de densidade local de espécies de peixes em riachos de 1a, 2a e 3a ordens e propõe um comprimento mínimo médio de amostragem que melhor estima o número absoluto de espécies em um dado segmento de riacho. Nós amostramos três sistemas de riachos nas áreas de estudo do Projeto Dinâmica Biológica de Fragmentos Florestais, entre maio e agosto de 2004. Em cada riacho, foi amostrado um segmento de 1aordem, um de 2a ordem e um de 3aordem. Amostramos cinco trechos de 20-m em cada segmento de riacho. Três a quatro pessoas coletaram ao longo de cada trecho durante 45 a 60 min. Usamos o coeficiente de Jaccard para estimar a similaridade da composição de espécies entre trechos e entre segmentos de riachos. Estimativas de riqueza de espécies foram obtidas com uso dos algoritmos de Jackknife 1 e Bootstrap e de curvas de acumulação de espécies. Usamos regressões lineares simples para verificar relações entre a densidade de espécies e a abundância de peixes e entre densidade de espécies e o volume de segmentos de 100-m de riacho. A densidade de espécies foi um pouco maior nos trechos de riacho de 1a ordem do que nos de 2a e 3a ordens, contudo a abundância de peixes foi aparentemente maior nos trechos de 3a ordem. A similaridade na composição de espécies de peixes entre trechos de 20-m foi baixa para todos os riachos estudados. Valores de densidade de espécies para segmentos de 100-m representaram de 71,4% a 94,1% dos valores estimados para esses riachos. A densidade de espécies mostrou uma relação direta tanto com o volume do segmento de riacho amostrado, como com a abundância de peixes. Parece plausível que riachos maiores contenham um número maior de tipos de microhábitats, que permitiriam a presença de mais espécies de peixes por trecho de riacho. Baseado nos valores das assíntotas e nas equações das curvas de acumulação de espécies, o comprimento mínimo médio de amostragem que melhor estima o número absoluto de espécies em um segmento de riacho é 180m ± 20 dp para segmentos de 1a ordem; 213 m ± 23 dp para os segmentos de 2a ordem e 253 m ± 30 dp para os segmentos de 3a ordem.
Key words: fish diversity, fish abundance, stream size, species composition, species accumulation curves.
*Programa de Pós-Graduação em Biologia Tropical e Recursos Naturais, Instituto Nacional de Pesquisas da Amazônia /Universidade Federal do Amazonas, Manaus, AM, Brazil. [email protected]
Introduction
Small water courses are important components of the land-scape in terra firme (i.e., non-flooding) forests in central Amazonia. Canopies of adjacent trees cover a large propor-tion of these streams’ beds, known regionally as igarapés. The aquatic fauna is largely dependent on organic matter from the surrounding terrestrial system, in the form of flow-ers, fruits, leaves, and invertebrates (Goulding, 1980; Walker, 1991; Lowe-McConnell, 1999). These small streams shelter a large number of fish species, mainly small Characiformes (Sabino & Zuanon, 1998; Lowe-McConnell, 1999; Buhrnheim, 2002; Buhrnheim & Cox-Fernandes, 2003).
Although widespread in the Amazon basin, this ichthyo-fauna is still poorly known. The majority of published works have focused on activity periods, feeding habits, and com-munity structure of these fishes (Silva, 1993, 1995; Sabino & Zuanon, 1998; Araújo-Lima et al., 1999; Buhrnheim & Fernandes, 2001; Buhrnheim, 2002; Buhrnheim & Cox-Fernandes, 2003; Zuanon & Sazima, 2004; Mendonça et al., 2005). These studies applied diverse sampling techniques and fishing gears, and differed in stream reach sampling length, sampling effort, sampling period (day/night), and use of auxiliary sampling techniques, such as underwater obser-vation by snorkeling. The lack of a common sampling proto-col in studies of this ichthyofauna hinders comparisons among available results. Uncertainty about the effectiveness of sampling techniques in these streams raises doubts about the patterns of species occurrence and distribution revealed in such studies. Small sample sizes may not include rare spe-cies that are important in the composition of fish communi-ties, resulting in misleading estimates of species richness (Angemeier & Smogor, 1995; Cao et al., 1998). Also, poorly outlined sampling protocols may generate an underestimate of alpha diversity, while at the same time overestimating beta diversity (Santos, 2003), which could impair efforts to estab-lish conservation strategies for this ichthyofauna (Mendonça
et al., 2005).
This study evaluates the effect of the length of stream reach sampled on estimates of local fish species richness (i.e.
species density; Gotelli & Cowell, 2001), and proposes a mean minimum sampling length that best estimates the absolute number of species in a stream segment.
Material and Methods
Study area and collection methods
Sampled streams are located in the study areas of the Biological Dynamics of Forest Fragments Project (BDFFP, INPA/Smithsonian Institute). The BDFFP is situated about 80 km north of Manaus (20°25’S, 60°W) and encompasses approximately 3,500 ha of forest made up of 1, 10, and 100 ha forest fragments, as well as large extensions of continuous forest (Gascon & Bierregaard, 2001). These areas are classi-fied as humid tropical forest with mean annual precipitation of 1900-2500 mm, a rainy season from December to May, and a dry season from June until November. Vegetation coverage has an average height of 30-37 m, with emergent trees reach-ing 45-50 m and an understory with abundant palms (Gascon & Bierregaard, 2001).
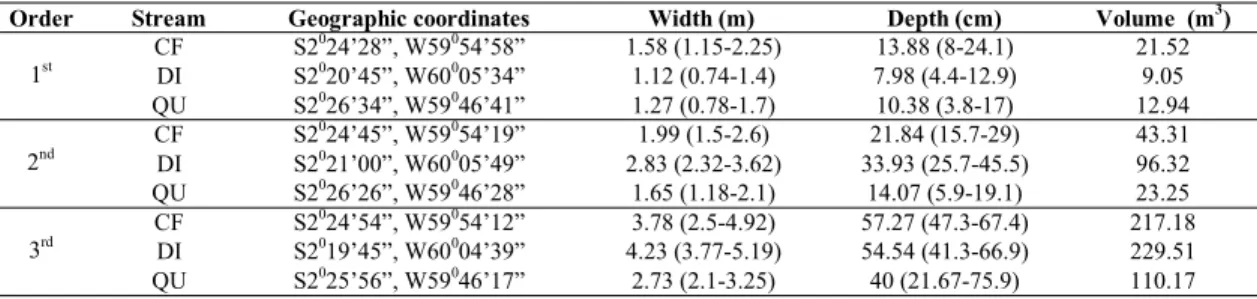
We sampled three streams in the Cabo Frio, Fazenda Dimona, and Km 41 BDFFP study sites. The streams are con-nected to basins of the Preto da Eva (Cabo Frio) and Urubu (Km 41) rivers, both tributaries of the Amazon River, and to Cuieiras River (Fazenda Dimona), a tributary of the Negro River. Samplings were conducted between May and August 2004, which corresponds to the early dry season in the cen-tral Amazonia. At each locality, one 1storder, one 2nd order, and one 3rd order stream segment was sampled a single time. Stream order was determined in loco according to Horton’s scale modified by Strahler (Petts, 1994), where the junction of two first order streams form a second order stream and two sec-ond order streams form a third order stream. Table 1 shows the geographic coordinates for sampled streams. In this study, we refer to streams by their locality, Cabo Frio (CF), Dimona (DI), or Km 41 (QU), and segment order, 1st, 2nd, or 3rd. All streams are located in continuous forest, with the exception of DI 1st order segment, which is partially located in a forest fragment of 100 ha. Distances between segments of each stream (1st to 3rd) ranged 0.35-3.17 km, and between 14.3 and 37.3 km among different streams. Stream substrate was com-posed mainly of coarse litter and sand patches, with a few submerged trunks and tree branches. In some reaches of 3rd order segments there were some bog plants (Thurnia
sphaerocephala, Thurniaceae) partially covering the stream
bottom.
Order Stream Geographic coordinates Width (m) Depth (cm) Volume (m3)
CF S2024’28”, W59054’58” 1.58 (1.15-2.25) 13.88 (8-24.1) 21.52
DI S2020’45”, W60005’34” 1.12 (0.74-1.4) 7.98 (4.4-12.9) 9.05
1st
QU S2026’34”, W59046’41” 1.27 (0.78-1.7) 10.38 (3.8-17) 12.94
CF S2024’45”, W59054’19” 1.99 (1.5-2.6) 21.84 (15.7-29) 43.31 DI S2021’00”, W60005’49” 2.83 (2.32-3.62) 33.93 (25.7-45.5) 96.32 2nd
QU S2026’26”, W59046’28” 1.65 (1.18-2.1) 14.07 (5.9-19.1) 23.25
CF S2024’54”, W59054’12” 3.78 (2.5-4.92) 57.27 (47.3-67.4) 217.18 DI S2019’45”, W60004’39” 4.23 (3.77-5.19) 54.54 (41.3-66.9) 229.51 3rd
QU S2025’56”, W59046’17” 2.73 (2.1-3.25) 40 (21.67-75.9) 110.17
Fish sampling
Our sampling design consisted of five 20-m reaches sampled in each stream segment, in three segments (1st, 2nd, and 3rd order) of three streams (Cabo Frio, Dimona, and Camp 41). We randomly chose five 20-m reaches along each stream segment and each reach was separated by a 15-m section of stream. Prior to the samplings the ends of each 20-m reach were blocked with fine meshed (5 mm stretched mesh) nets to avoid fish escapes. We sampled the five reaches in the up-stream direction to minimize effects of drifting materials and other disturbances on the other stream reaches. We employed hand nets, metallic sieves (50 cm diameter, 3.5 mm mesh), and small fine-meshed seine nets to collect fishes. All fish sam-pling took place during the morning and early afternoon. Collecting effort at each reach was conducted by the same team in all streams, and consisted of the activity of three people during 45 min in 1st order stream segments, three per-sons and 60 minutes in 2ndorder stream segments, and four persons and 60 minutes in 3rd order stream segments. Collect-ing at each stream segment was completed on the same day and each reach sample was preserved in separate containers for analysis. Fish samples were preserved in 10% formalin and vouchers were deposited in the Fish Collection of the National Institute for Amazonian Research in Manaus (INPA 25308 to INPA 25496).
Stream dimensions and physical variables
In order to explore relationships between stream size and fish species density, we measured stream width (m) and depth (cm) across the streambed, in 10-cm intervals beginning 10 cm from the stream margin. Each set of measurements was taken at two points within each 20-m stream reach. To esti-mate the volume of water (m3) in each stream reach, we used the measured values of length, width, and depth, and as-sumed a trapezoidal form for the channel section. These vari-ables are represented by mean values along the text.
Data analysis
We recorded species density (number of species) and abundance (number of individuals) for each stream reach. To evaluate differences among reaches within each stream seg-ment and among stream segseg-ments of the same order, we used the mean (X), standard deviation (sd), minimum (min),
maxi-mum (max), and range values of species density and fish abun-dance. We used the Jaccard’s coefficient (Krebs, 1989) to estimate the similarity of species composition among stream reaches and segments. Subsequently we pooled the samples of the five 20-m reaches of each segment (then representing a 100-m segment) and generated estimates of species richness with Jackknife 1 and Bootstrap algorithms using the software EstimateS 7.5 (Colwell, 2005). Then we compared these re-sults with the actual accumulated species density values of each 100-m stream segment.
To obtain the asymptote for the species accumulation curve in each segment, we generated average values of the number of accumulated species in function of the random
addition of samples (five 20-m stream reaches), adjusted to a growth function type: y= a(b-e-cx) using the software Curve Expert 1.3 (Hyams, 2001). These values (hereafter referred to as Sass) were also used as species richness estimates. Based on asymptote values and species accumulation curves equa-tions, we then estimated the mean minimum sampling length that best estimates the absolute number of species in a stream segment.
We used simple linear regression (Zar, 1996) to look for relationships between species density and fish abundance and between species density and the volume (pooled for the five, 20-m reaches) of each segment. Before these analyses, we tested for homogeneity of variances, normality, and lin-earity of the data, assumptions for the application of regres-sion (Zar, 1996).
Results
Studied streams segments were generally narrow, with mean width varying between 1.12 and 4.23 m (X = 2.35 ± 1.11 sd), and mean depth varying between 7.98 and 57.27 cm (X=
28.20 ± 18.97 sd). The volume of the pooled five 20-m reaches of each segment varied widely from 9.05 to 229.51 m3(X= 84.81 ± 86.35 sd) (Table 1).
Overall, 61 species and 2200 individuals were caught in the nine surveyed stream segments. Captures per 20-m reach varied in both species density and fish abundance. These variations occurred both between reaches within the same segment and within streams segments of the same order.
Species density values did not exceed a difference of six species between reaches of each segment, and nine species among reaches of segments of the same order. There was a slightly higher variation between 1st order reaches, whereas fish abundance was apparently higher in 3rd order reaches (as shown by sd values in Table 2). Similarity in fish species composition among 20-m reaches was low for all studied streams, but 3rd order segments showed slightly lower values when compared with 1st and 2nd order segments (as demon-strated by mean values in Table 3). Overall fish assemblage similarity among segments of Cabo Frio and Km 41 streams varied between 0.66 and 0.68, whereas similarity values in-volving Dimona stream segments were somewhat lower and ranged 0.55-0.59.
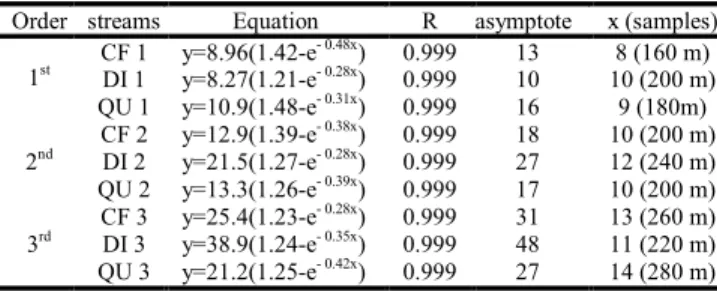
Species richness values observed for accumulated cap-tures in five 20-m reaches (corresponding to a 100-m stream segment) represented 71.4% to 94.1% of the estimated num-ber of species for these stream segments. Values calculated with Bootstrap and species accumulation curves were similar to each other and lower than those generated by the Jack-knife 1 method (Table 4). We estimate that the mean minimum sampling length to best estimate the absolute number of spe-cies in a stream segment is 180 m ± 20 sd for a 1st order seg-ment; 213 m ± 23 sd for a 2nd order segment, and 253 m ± 30 sd for a 3rd order stream segment (Table 5, Fig. 1).
Abundance data showed homogeneity of variances (Levene’s= F(2,6) = 2.85; p= 0.134), and species density data were logarithmically transformed to fit this assumption (Levene’s= F(2,6) = 0.53; p= 0.61). Species density showed a direct relationship both with stream segment volume (F(1,7) = 25.76; r2= 0.79; p = 0.001; n = 9; Fig. 2a) and abundance of individuals (F(1,7)= 6.86; r2= 0.5; p = 0.03; n = 9; Fig. 2b).
Discussion
Species richness has been used as an important measure of biodiversity, for both defining conservation strategies and comparative ecological analyses (Wilson, 1997; Primack & Rodrigues, 2002; Melo, 2003; Santos, 2003). However, spe-cies richness and abundance values, attributes typically used to characterize the structure of fish communities, are known to be very sensitive to sampling effort. Angermeier & Smogor (1995) observed discontinuities in the distribution of fish spe-cies within and among streams, and found that such discontinuities bear strongly on the sampling effort that is necessary for a characterization of the community structure. As such, the choice of a sample size that permits the genera-tion of reliable estimates of these attributes is a central ques-tion in studies of ecological communities (Cao et al., 2002). Table 2. Fish abundance and species density in 20-m reaches of 1st, 2nd, and 3rd order streams segments located in the study areas of Biological Dynamics of Forest Fragments Project, Manaus, Amazonas State. Total= pooled values for five 20-m stream reaches. General= mean values by stream order.
Species density Abundance
Order Stream mean sd min max range total mean sd min max range total
CF 7.2 2.2 4 10 6 12 23.8 8.3 14 37 23 119
DI 3.8 1.3 2 5 3 8 43.8 10.9 36 63 27 219
QU 8.2 1.6 7 11 4 14 57.0 10.9 44 74 30 285
1st
General 6.4 2.5 2 11 9 20 41.5 16.9 14 74 60 623
CF 9.4 2.1 6 11 5 16 30.8 8.4 22 42 20 154
DI 11 1.2 9 12 3 22 53.0 15.5 35 75 40 265
QU 7.8 2.4 5 11 6 15 34.8 10.9 16 44 28 174
2nd
General 9.4 2.2 5 12 7 34 39.5 14.9 16 75 59 593
CF 11.8 2.4 9 15 6 25 51.0 19.4 23 77 54 255
DI 21.0 3.8 17 25 8 42 102.4 35.1 59 154 95 512
QU 12.6 2.3 9 15 6 24 43.4 22.3 21 71 50 217
3rd
General 15.1 5.1 9 25 16 58 65.6 36.6 21 154 133 984
Streams
CF DI QU CF DI QU CF DI QU
Order 1st 1st 1st 2nd 2nd 2nd 3rd 3rd 3rd
Sobs 12 8 14 16 22 15 25 42 24
Jackknife (Cl)
14 (±2)
10 (±4)
18 (±7)
21 (±6)
30 (±0)
19 (±6)
35 (±6)
54 (±7)
30 (±4)
Bootstrap 13 9 16 18 26 17 29 48 27
Sass 13 10 16 18 27 17 31 48 27
%Jack 85.7 80 77.8 76.2 73.3 78.9 71.4 77.8 80 %Boots 92.3 88.9 87.5 94.1 84.6 88.2 86.2 87.5 88.9 %Sass 92.3 80 87.5 94.1 81.5 88.2 80.7 87.5 88.9 Table 4. Species richness in 100-m segments of 1st, 2nd, and 3rd order streams, estimated by the methods of Jackknife 1, Boot-strap and by extrapolation from species accumulation curves. Cl= confidence limits of methods of Jackknife 1; Sobs= observed richness; Sass= richness estimated by extrapolation from cies accumulation curves; %Jack= percent of observed spe-cies richness in relation to that estimated by the Jackknife method; %Boots= percent of observed species richness in re-lation to that estimated by the Bootstrap method; %Sass= per-cent of observed species richness in relation to that estimated by extrapolation from species accumulation curves.
Table 3. Similarity values (Jaccard’s coefficient) of species composition among samples of 20-m reaches of 1st, 2nd, and 3rd order stream segments located in the study areas of Biologi-cal Dynamics of Forest Fragments Project, Manaus, Amazonas State. General= mean values by stream order.
Similarity
Order Stream mean sd min max range
CF 0.54 0.17 0.36 0.87 0.51
DI 0.45 0.16 0.29 0.80 0.51
QU 0.57 0.14 0.38 0.78 0.20 1st
General 0.32 0.17 0.08 0.87 0.79
CF 0.57 0.10 0.43 0.75 0.32
DI 0.47 0.09 0.33 0.60 0.27
QU 0.46 0.10 0.33 0.63 0.30 2nd
General 0.30 0.19 0 0.75 0.75
CF 0.41 0.09 0.29 0.58 0.29
DI 0.42 0.05 0.35 0.51 0.16
QU 0.44 0.09 0.32 0.65 0.33 3rd
If a sample actually represents the community from which it was collected, it is expected that subsequent samples col-lected under the same conditions will produce similar values of species density and composition. In the present study, data obtained for the 20-m reaches of the nine stream seg-ments were extremely variable with respect to composition and species density. This suggests that estimates based on samples of this size may not provide a good enough repre-sentation of those fish communities. We do not believe that the high variability in species density and assemblage com-1storder streams
Number of samples (20-m stream reaches )
0 5 10 15 20
Nu
mb
er of spec
ie s 0 2 4 6 8 10 12 14 16 18 Cabo Frio Dimona Camp 41
a
Number of samples (20-m stream reaches )
0 5 10 15 20
Nu mber of spec ies 0 4 8 12 16 20 24 28 Cabo Frio Dimona Camp 41
2nd order streams
b
3rd orders streams
Number of samples (20-m stream reaches )
0 5 10 15 20
Number of spe cies 0 5 10 15 20 25 30 35 40 45 50 Cabo Frio Dimona Camp 41
c
Fig. 1. Fish species accumulation curves estimated from samples obtained in 1st, 2nd, and 3rd order streams reaches lo-cated in the study areas of Biological Dynamics of Forest Fragments Project, Manaus, Amazonas State. The curves rep-resent extrapolations from five reaches sampled in each stream segment.
Order streams Equation R asymptote x (samples)
CF 1 y=8.96(1.42-e- 0.48x) 0.999 13 8 (160 m)
DI 1 y=8.27(1.21-e- 0.28x) 0.999 10 10 (200 m)
1st
QU 1 y=10.9(1.48-e- 0.31x) 0.999 16 9 (180m)
CF 2 y=12.9(1.39-e- 0.38x) 0.999 18 10 (200 m)
DI 2 y=21.5(1.27-e- 0.28x) 0.999 27 12 (240 m)
2nd
QU 2 y=13.3(1.26-e- 0.39x) 0.999 17 10 (200 m)
CF 3 y=25.4(1.23-e- 0.28x) 0.999 31 13 (260 m)
DI 3 y=38.9(1.24-e- 0.35x) 0.999 48 11 (220 m)
3rd
QU 3 y=21.2(1.25-e- 0.42x) 0.999 27 14 (280 m)
Table 5. Summary of equations of species accumulation curves, linear regression parameters, asymptote values (= estimated number of species) and length of stream segment estimated to result in a complete survey of species at each site. x= num-ber of samples (20-m reaches) necessary to the curve to reach an asymptote.
Fig. 2. Relation between fish species density (a), fish abun-dance (b) and water volume (m3) in 100-m stream segments of 1st, 2nd, and 3rd order located in the study areas of Biological Dynamics of Forest Fragments Project, Manaus, Amazonas State. The numbers 1 to 3 refer to the stream order.
Grafico
0 40 80 120 160 200 240
Volume (m3)
2.0 2.2 2.4 2.6 2.8 3.0 3.2 3.4 3.6 3.8 4.0
Species density (log)
a
r2=0.79
1 2 2
2 3 3
3
1
1
Gráfico
100 150 200 250 300 350 400 450 500 550
Abundance 2.0 2.2 2.4 2.6 2.8 3.0 3.2 3.4 3.6 3.8 4.0
Species density (log)
b
r2=0.5
position observed in our study result from inadequate sam-pling effort, since our samsam-pling protocol was established based on a large series of samples obtained in several loca-tions in Brazilian Amazon (unpublished data). The low abun-dance of fish in 20-m reaches also represents a common fea-ture of central Amazonian streams. Furthermore, the very low catches observed at the end of each sampling period indi-cates a near exhaustion of fishes in each stream reach and support the adequacy of our sampling procedure. A possible disturbance effect generated by the collecting team along the stream segment from first to last reach may also be discarded, since there wasn’t any obvious tendency in similarity values obtained along each set of five reaches sampled (data not shown). Finally, the small time interval between samplings (three months) arguably rules out the possible effect of sea-sonal differences among fish assemblages sampled in the three streams, since fish assemblage composition vary little in small-order forest streams in the central Brazilian Amazon (Lowe-McConnell, 1991; Buhrnheim & Cox-Fernandes, 2001). Habitat heterogeneity is known to have a strong effect on the distribution of fish species along streams, both in func-tion of major longitudinal features (e. g. the sequence of riffles and pools) and microhabitat diversity (Angermeier & Karr, 1984; Garutti, 1988; Sabino & Castro, 1990; Taylor, 2000; Buhrnheim, 2002). Mérigoux et al. (1998) showed that fish species richness and composition along coastal streams in French Guiana were related to habitat diversity. Araújo-Lima
et al. (1999) studied the fish fauna in streams at one of our
study sites (Km 41) and also found a direct relation between fish species richness and habitat complexity. In the present study, the sampling points were chosen without previous knowledge about habitat heterogeneity (i.e. microhabitat di-versity) within each stream reach, which may explain (at least in part) the differences observed in species density among reaches and segments. In fact, the lowest species richness was observed in the 1st order stream segment at Fazenda Dimona, which was the smallest of all studied segments and also had a remarkably homogeneous substrate formed mostly by coarse litter.
The relation between sampling effort and species rich-ness (as shown by species accumulation curves) was steeper in larger stream segments, possibly due to species-area rela-tionships and also environmental heterogeneity (Harrel et al., 1967; Gorman & Karr, 1984; Angermeier & Schlosser, 1989). A given length of a higher-order stream segment will have a larger flooded area and a larger volume of water than a similar length of a lower-order stream segment. The observed varia-tions in fish species richness of same-order stream segments in the present study were partially explained by the volume of water in the segment. The 2nd and 3rdorder stream segments at Fazenda Dimona are larger (and seemingly more structurally complex) than similar-order segments in the other two sites, which might explain the higher species richness observed in that stream. It seems plausible that larger streams contain higher number of microhabitat types, which allow for the pres-ence of more fish species per stream length. Thus, a larger
stream length makes it possible to survey a wider variety of habitats and consequently, to collect rare species that oc-cupy uncommon microhabitats, increasing the species rich-ness recorded. For example, Zuanon et al. (2006) showed that there are several sand-dwelling fish species with very patchy distributions along streams. So, the eventual absence of such habitat in a given stream reach or segment would result in the absence of a whole subset of the fish assemblage in that stream section, generating low similarity values among reaches or segments.
Although part of the variation in observed fish species density can be explained by differences in stream dimensions and habitat diversity, we cannot rule out the possible effects of stream connectivity to different basins. The streams lo-cated in the Cabo Frio and Km 41 sites are connected by higher-order tributaries to the Amazon River, whereas the Fazenda Dimona stream connects through the Cuieiras River to the Negro River. Mendonça et al. (2005) found some differ-ences in fish assemblages between streams connected to these two major river basins and argued that low connectiv-ity between the two basins and very different water charac-teristics (pH, suspended solids, and other chemical differ-ences) of the Negro and Amazon rivers may represent an effective barrier to some fish species. This low connectivity (and possible effects of an ecological barrier) may explain part of the low similarity observed between stream segments in the present study, although historical factors can’t be ruled out.
Studying fish assemblages of small temperate and tropi-cal streams, Angermeier & Schlosser (1989) concluded that the number of individuals is often the best predictor of spe-cies richness in a sample. Although we observed this trend in our study, the best predictor of species richness was stream segment volume. However, the low number of streams sur-veyed and presence of outliers (e.g. the Dimona 1st order stream) may also have had an effect on our results.
The extrapolation of species accumulation curves gener-ated reliable estimates of fish species richness in sampled streams. Such supposed reliability is based on the similarity of values obtained with the Bootstrap and Jackknife methods (in fact, a little smaller but within the confidence limits of the Jackknife estimates). It is also known that Jackknife estimates are based on the presence of rare species and tend to overes-timate richness when the number of samples is small (Krebs, 1989; Santos, 2003).
stream size (Simonson et al., 1994). Sampling relatively long stream reaches makes it more likely that a sample may include a wide variety of microhabitats and thus reduces the possible effects of different distribution patterns among fish species in the samples. However, we should emphasize that the use of a variety of sampling devices and techniques, including gill nets and fike net traps, especially in larger streams, can add consistency to the protocol we propose here.
The application of the proposed sampling protocol in a variety of habitats and at a wider regional scale would pro-vide important information about its validity for Amazonian
terra firme forest streams in general. Such data would
gener-ate information about the variation of fish species diversity and provide reference values that could be used in the char-acterization of the Amazonian ichthyofauna and definition of fine-tuned regional strategies for biological conservation.
Acknowledgements
This study was partially financed by the Brazilian Na-tional Research Council (CNPq, Process 130789 / 2003-8), the Biological Dynamics of Forest Fragments Project (BDFFP – INPA / Smithsonian Tropical Research Institute, Panamá), the FAPEAM (Process 899/04) and by Fundação O Boticário de Proteção à Natureza (Process 0630-20042). The authors thank to R. R. de Oliveira, L. N. Carvalho and the technicians of the BDFFP, especially to O. S. Pereira and A. M. dos Reis for all the help during the field work. Contribution 481 of the BDFF Project and contribution 07 of the Ygarapés Project.
Literature Cited
Angermeier, P. L. & J. R. Karr. 1984. Fish communities along
environmental gradients in a system of tropical streams. In:
Zaret, T. M. (Ed.). Evolutionary Ecology of Neotropical Freshwater Fishes. Dr. W. Junk Publishers, The Hague, Netherlands. p. 39-58.
Angermeier, P. L. & I. J. Schlosser. 1989. Species-area relationships for streams fishes. Ecology, 70(5): 1450-1462.
Angermeier, P. L. & R. A. Smogor. 1995. Estimating number of species and relative abundances in stream-fish communities: effects of sampling effort and discontinuous spatial distributions. Canadian Journal of Fisheries and Aquatic Sciences, 52: 936-949.
Araújo-Lima, C. A. R. M., L. F. Jiménez, R. S. Oliveira, P. C. Eterovick, U. Mendonza & A. Jerozolimki. 1999. Relação entre o número de espécies de peixes, complexidade de hábitat e or-dem do riacho nas cabeceiras de um tributário do rio Urubu, Amazônia Central. Acta Limnologica Brasiliensia, 11(2): 127-135.
Buhrnheim, C. M. 2002. Heterogeneidade de habitats: rasos e fun-dos em assembléias de peixes de igarapés de terra firme na Amazônia Central, Brasil. Revista Brasileira de Zoologia, 19(3): 889-905.
Buhrnheim, C. M. & C. Cox-Fernandes. 2001. Low seasonal variation of fish assemblages in Amazonian rain forest streams. Ichthyological Exploration of Freshwaters, 12(1): 65-78. Buhrnheim, C. M. & C. Cox-Fernandes. 2003. Structure of fish
assemblages in Amazonian rain-forest streams: effects of habitats and locality. Copeia, 2: 255-262.
Cao, Y., D. D. Williams & N. E. Williams. 1998. How important are rare species in aquatic community ecology and bioassessment? Limnology and Oceanography, 43(7): 1403-1409.
Cao, Y., D. D. Williams & D. P. Larsen. 2002. Comparison of ecological communities: the problem of sample representativeness. Ecological Monographs, 72(1): 41-56. Colwell, R. K. 2005. EstimateS: Statistical estimation of species
richness and shared species from samples. Version 7.5. http:// viceroy.ebb.uconn.edu/estimates (accessed in 09/2005). Garutti, V. 1988. Distribuição longitudinal da ictiofauna em um
córrego da região noroeste do Estado de São Paulo, bacia do Paraná. Revista Brasileira de Biologia, 48(2): 747-759. Gascon, C. & R. O. Bierregaard. 2001. The Biological Dynamics of
Forest Fragments Project: The Study Site, Experimental Design,
and Research Activity. Pp. 31-42. In: Bierregaard, R. O., C.
Gascon, T. E. Lovejoy & R. Mesquita (Eds.). Lessons from Amazonia–The ecology and conservation of a fragmented forest. Ann Arbor, Yale University Press. 478p.
Gorman, O. T. & J. R. Karr. 1978. Habitat structure and stream fish communities. Ecology, 59:507-515.
Gotelli, N. J. & R. K. Colwell. 2001. Quantifying biodiversity: procedures and pitfalls in the measurement and comparison of species richness. Ecology Letters, 4:379-391.
Goulding, M. 1980. The Fishes and the forest: explorations in Amazonian natural history. California, University of California Press, 280p.
Krebs, C. J. 1989. Ecological Methodology. New York, Harper Collins Publishers, 654p.
Harrel, R. C., B. J. Davis & T. C. Dorris. 1967. Stream order and species diversity of fishes in an intermittent stream. American Midland Naturalist, 78: 428-436.
Hyams, D. 2001. Curve expert 1.38: A curve fitting system for Windows. http://curveexpert.webhop.biz/ (accessed in 09/ 2005).
Lyons, J. 1992. The length of stream to sample with a towed electrofishing unit when fish species richness is estimated. North American Journal of Fisheries Management, 12: 198-203. Lowe-McConnel, R. H. 1999. Estudos Ecológicos de Comunidades
de Peixes Tropicais. São Paulo, EDUSP, 536p.
Lowe-McConnel, R. H. 1991. Natural history of fishes in Araguaia and Xingu Amazonian tributaries, Serra do Roncador, Mato Grosso, Brazil. Ichthyological Exploration of Freshwaters, 2: 63-82.
Melo, A. S. 2003. Diversidade de macroinvertebrados em riachos.
Pp. 69-90. In: Cullen-Jr., L., C. Valladares-Pádua & R. Rudran
(Eds.). Métodos de estudos em biologia da conservação e mane-jo da vida silvestre. Londrina, Editora da UFPR, 665p. Mendonça, F. P., W. E. Magnusson & J. Zuanon. 2005. Relationships
between habitat characteristics and fish assemblages in small streams of Central Amazonia. Copeia, 4: 750-763.
Mérigoux, S., D. Ponton & B. Mérona, 1998. Fish richness and species-habitat relationships in two coastal streams of French Guiana, South America. Environmental Biology of Fishes, 51: 25-39.
Petts, G. E. 1994. Rivers: Dynamic components of catchments
ecosystem. Pp. 3-22. In: Calow, P. & G. E. Petts (Eds.). The
River Handbook: The science and management of rivers environments. Oxford, Blackwell Scientific, 536p.
Sabino, J. & R. M. C. Castro. 1990. Alimentação, período de ativi-dade e distribuição espacial dos peixes de um riacho da floresta Atlântica (Sudeste do Brasil). Revista Brasileira de Biologia, 50: 23-26.
Sabino, J. & J. Zuanon. 1998. A stream fish assemblage in Central Amazonia: distribution, activity patterns and feeding behavior. Ichthyological Exploration of Freshwaters, 8(3): 201-210. Santos, A. J. 2003. Estimativas de riqueza em espécies. Pp. 19-41.
In: Cullen-Jr., L., C. Valladares-Pádua & R. Rudran (Eds.).
Métodos de estudos em biologia da conservação e manejo da vida silvestre. Londrina, Editora da UFPR, 665p.
Silva, C. P. D. 1993. Alimentação e distribuição espacial de algumas espécies de peixes do igarapé do Candirú, Amazonas, Brasil. Acta Amazonica, 23: 271-285.
Silva, C. P. D. 1995. Community structure of fish in urban and natural streams in Central Amazon. Amazoniana, 13 (3/4): 221-236.
Simonson, T. D., J. Lyons & P. D. Kanehl. 1994. Quantifying fish habitat in streams: transect spacing, sample size, and proposed framework. North American Journal of Fisheries Management, 14: 607-615.
Taylor, C. M. 2000. A large-scale comparative analysis of riffle and pool fish communities in an upland stream system. Environmental Biology of Fishes, 58: 89-95.
Walker, I. 1991. Algumas considerações sobre um programa de zoneamento da Amazônia. Pp. 37-46. In: Val, A. L., R. Figliuolo & E. Feldberg (Eds.). Bases Científicas para Estratégias de Pre-servação e Desenvolvimento da Amazônia. Manaus, INPA, 440p.
Wilson, E. O. 1997. A situação atual da diversidade biológica. Pp.
3-24.In: Wilson, E. O. (Ed.). Biodiversidade. Rio de Janeiro,
Nova Fronteira, 657p.
Zar, J. H. 1996. Biostatistical analysis. 4th edition. New Jersey,
Prentice-Hall, 663p.
Zuanon, J., F. A. Bockmann & I. Sazima. 2006. A remarkable sand-dwelling fish assemblage from central Amazonia, with comments on the evolution of psammophily in South American freshwater fishes. Neotropical Ichthyology, 4(1): 107-118.
Zuanon, J. & I. Sazima. 2004. Natural history of Stauroglanis
gouldingi(Siluriformes: Trichomycteridae), a miniature sand-dwelling candiru from central Amazonian streamlets. Ichthyological Exploration of Freshwaters, 15(3): 201-208.