A QCAR model for predicting antioxidant activity of wild mushrooms
H.J.C. Froufea, R.M.V. Abreua,band I.C.F.R. Ferreiraa*a
CIMO/Escola Superior Agra´ria, Instituto Polite´cnico de Braganc¸a, Campus de Santa Apolo´nia, Apartado 1172, 5301-855 Braganc¸a, Portugal;bInstituto de Biotecnologia e Bioengenharia, Centro de Geno´mica e Biotecnologia, Universidade de Tra´s-os-Montes e Alto Douro (CGB-UTAD/IBB), 5001-801, Vila Real, Portugal
Wild mushrooms have been described as sources of natural antioxidants, particularly phenolic compounds. However, many other compounds present in wild mushrooms can also act as antioxidants (reducers), so whole extracts from a wide range of species need to be examined. To gain further knowledge in this area, the relationship between the antioxidant potential (scavenging effect and reducing power) and chemical composition of twenty three samples from seventeen Portuguese wild mushroom species was investigated. A wide range of analytical parameters reported by our research group (including ash, carbohydrates, proteins, fat, monounsaturated fatty acids, polyunsaturated fatty acids, saturated fatty acids, phenolics, flavonoids, ascorbic acid and
-carotene) were studied and the data were analysed by partial least squares (PLS) regression analysis to allow correlation of all the parameters. Antioxidant activity correlated well with phenolic and flavonoid contents. A QCAR (Quantitative Composition-Activity Relationships) model was constructed, using the PLS method, and its robustness and predictability were verified by internal and external cross-validation methods. Finally, this model proved to be a useful tool in the prediction of mushrooms’ reducing power.
Keywords: wild mushrooms; chemical composition; antioxidant activity; QCAR; PLS
1. Introduction
Free radicals play important roles in many physiological and pathological conditions [1]. In general, excess of free radicals caused by the imbalance between free radical generation and scavenging may contribute to disease development. Free radicals can damage membranes, proteins, enzymes and DNA, increasing the risk of diseases such as cancer, Alzheimer’s, Parkinson’s, angiocardiopathy, arthritis, asthma, diabetes, and degenerative eye disease [1,2].
substances in mushrooms including proteins, carbohydrates, vitamins and fibres could also contribute to the antioxidant capacity [12].
Our recent investigation provided an insight to the chemical composition, nutritional value and antioxidant properties of several wild mushroom species from the northeast of Portugal, one of the European regions with a higher diversity of wild edible mushrooms, valorising mushrooms as a source of nutrients and nutraceuticals [13–17]. The analysis of nutrients included determination of proteins, fats, ash, and carbohydrates, particularly sugars by high performance liquid chromatography coupled to a refraction index detector (HPLC-RI). The analysis of nutraceuticals included determination of fatty acids by gas-chromatography with a flame ionisation detector (GC-FID), and other phytochemicals such as phenolic compounds by HPLC coupled to a diode array detector and mass spectrometry (HPLC/DAD-ESI/MS), carotenoids and ascorbic acid, by spectrophoto-metric techniques. The antioxidant activity was screened through chemical and biochem-ical assays [15,16,18–20]. Numerous tests have been used for measuring the antioxidant capacity of food and biological samples. However, there is no universal method that can measure the antioxidant capacity of all samples accurately and quantitatively [21]. 2,2-Diphenyl-1-picrylhydrazyl (DPPH) radical scavenging activity (RSA) and reducing power (RP) assays are two of the most widely used methods for antioxidant activity screening.
The relationship between chemical substances including phenolic compounds and antioxidant properties may be complex, and there are very little data to elucidate the relationship between chemical composition and antioxidant capacity of wild mushrooms. Herein, the antioxidant potential (RSA and RP) and chemical composition of some Portuguese wild mushrooms were evaluated using linear regression analysis (partial least squares, PLS), in order to find possible relationships between those parameters. Furthermore, a quantitative composition-activity relationships (QCAR) model was constructed in order to predict the reducing power of mushrooms.
2. Materials and methods 2.1 Data set
A total of 23 samples from 17 Portuguese wild mushroom species were used in this study (Table 1). The samples were selected using the following criteria: wild mushrooms studied by our research group using the same methodologies; results of chemical composition and antioxidant activity available on the same sample. In some species, results considering different stages of fruiting body growth (SI, SII, and SIII) and different conservation conditions (frozen and dehydrated) were available, and therefore used in this study.
The samples were collected in Braganc¸a (in the northeast of Portugal), in the autumns of 2005 and 2006. Different chemical parameters (ash, carbohydrates, proteins, fat, monounsaturated fatty acids (MUFA), polyunsaturated fatty acids (PUFA), saturated fatty acids (SFA), phenolics, flavonoids, ascorbic acid and-carotene), radical scavenging activity (RSA) and reducing power (RP) values were obtained from previous reports of our research group [13–20].
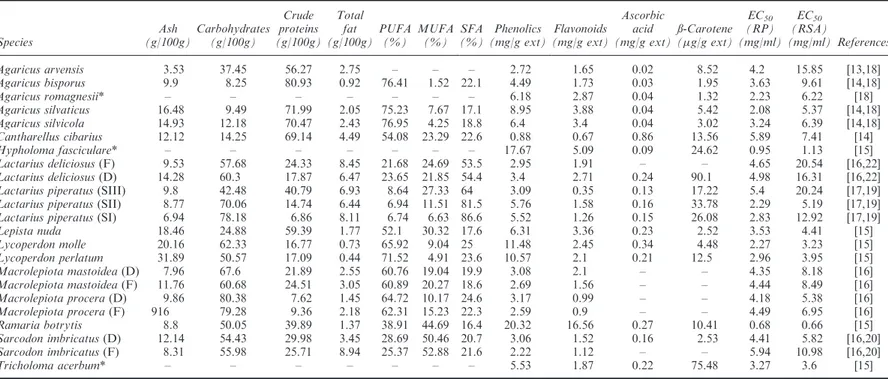
Table 1. Chemical composition and antioxidant activity (reduction power, RP and radical scavenging activity, RSA) values of Portuguese wild mushrooms.
Species
Ash (g/100g)
Carbohydrates (g/100g)
Crude proteins (g/100g)
Total fat (g/100g)
PUFA (%)
MUFA (%)
SFA (%)
Phenolics (mg/g ext)
Flavonoids (mg/g ext)
Ascorbic acid (mg/g ext)
ß-Carotene (g/g ext)
EC50 (RP) (mg/ml)
EC50 (RSA)
(mg/ml) References
Agaricus arvensis 3.53 37.45 56.27 2.75 – – – 2.72 1.65 0.02 8.52 4.2 15.85 [13,18]
Agaricus bisporus 9.9 8.25 80.93 0.92 76.41 1.52 22.1 4.49 1.73 0.03 1.95 3.63 9.61 [14,18]
Agaricus romagnesii* – – – – – – – 6.18 2.87 0.04 1.32 2.23 6.22 [18]
Agaricus silvaticus 16.48 9.49 71.99 2.05 75.23 7.67 17.1 8.95 3.88 0.04 5.42 2.08 5.37 [14,18]
Agaricus silvicola 14.93 12.18 70.47 2.43 76.95 4.25 18.8 6.4 3.4 0.04 3.02 3.24 6.39 [14,18]
Cantharellus cibarius 12.12 14.25 69.14 4.49 54.08 23.29 22.6 0.88 0.67 0.86 13.56 5.89 7.41 [14]
Hypholoma fasciculare* – – – – – – – 17.67 5.09 0.09 24.62 0.95 1.13 [15]
Lactarius deliciosus(F) 9.53 57.68 24.33 8.45 21.68 24.69 53.5 2.95 1.91 – – 4.65 20.54 [16,22]
Lactarius deliciosus(D) 14.28 60.3 17.87 6.47 23.65 21.85 54.4 3.4 2.71 0.24 90.1 4.98 16.31 [16,22]
Lactarius piperatus(SIII) 9.8 42.48 40.79 6.93 8.64 27.33 64 3.09 0.35 0.13 17.22 5.4 20.24 [17,19]
Lactarius piperatus(SII) 8.77 70.06 14.74 6.44 6.94 11.51 81.5 5.76 1.58 0.16 33.78 2.29 5.19 [17,19]
Lactarius piperatus(SI) 6.94 78.18 6.86 8.11 6.74 6.63 86.6 5.52 1.26 0.15 26.08 2.83 12.92 [17,19]
Lepista nuda 18.46 24.88 59.39 1.77 52.1 30.32 17.6 6.31 3.36 0.23 2.52 3.53 4.41 [15]
Lycoperdon molle 20.16 62.33 16.77 0.73 65.92 9.04 25 11.48 2.45 0.34 4.48 2.27 3.23 [15]
Lycoperdon perlatum 31.89 50.57 17.09 0.44 71.52 4.91 23.6 10.57 2.1 0.21 12.5 2.96 3.95 [15]
Macrolepiota mastoidea(D) 7.96 67.6 21.89 2.55 60.76 19.04 19.9 3.08 2.1 – – 4.35 8.18 [16]
Macrolepiota mastoidea(F) 11.76 60.68 24.51 3.05 60.89 20.27 18.6 2.69 1.56 – – 4.44 8.49 [16]
Macrolepiota procera(D) 9.86 80.38 7.62 1.45 64.72 10.17 24.6 3.17 0.99 – – 4.18 5.38 [16]
Macrolepiota procera(F) 916 79.28 9.36 2.18 62.31 15.23 22.3 2.59 0.9 – – 4.49 6.95 [16]
Ramaria botrytis 8.8 50.05 39.89 1.37 38.91 44.69 16.4 20.32 16.56 0.27 10.41 0.68 0.66 [15]
Sarcodon imbricatus(D) 12.14 54.43 29.98 3.45 28.69 50.46 20.7 3.06 1.52 0.16 2.53 4.41 5.82 [16,20]
Sarcodon imbricatus(F) 8.31 55.98 25.71 8.94 25.37 52.88 21.6 2.22 1.12 – – 5.94 10.98 [16,20]
Tricholoma acerbum* – – – – – – – 5.53 1.87 0.22 75.48 3.27 3.6 [15]
monounsaturated fatty acids (MUFA) and polyunsaturated fatty acids (PUFA) were determined by GC-FID after a trans-esterification procedure. Phenolics, flavonoids, ascorbic acid and -carotene were determined by spectrophotometer assays. These phytochemicals are frequently analysed in mushrooms and reported in literature.
For antioxidant activity data we used the results of two in vitro chemical assays, previously reported by us: reducing power (RP [measuring the conversion of a Fe3þ/ ferricyanide complex to the ferrous form]) and scavenging activity on DPPH radicals (RSA [measuring the decrease in DPPH radical absorption after exposure to radical scavengers]). These assays are the most commonly used methods for assessment of the antioxidant properties of natural products. Both assays are suitable for solvent extracts and as rapid assays, they can be applied for monitoring the activity of numerous samples over a limited period of time [12,23]. Moreover, they are reproducible and strongly correlated with phenolic compounds [12]. The RSA was calculated as a percentage of DPPH discoloration using the equation:
%RSA¼ ½ðADPPHASÞ=ADPPH 100, ð1Þ where AS is the absorbance of the solution when the sample extract has been added at a particular level, and ADPPHis the absorbance of the DPPH solution. The RP was obtained by measuring the absorbance of the product obtained by the reduction of the ferric ion to the ferrous form; a higher absorbance indicates higher RP.
To make the RSA and RP data homogenous and directly comparable, all the values were reported as EC50 (expressed in mg/mL, concentration required to achieve 50% of RSA or 0.5 of absorbance in RP).
2.2 Statistical analysis
The relationships between antioxidant activity (RP and RSA) and the different chemical composition parameters were studied using the PLS [24] method implemented in SIMCA-P v12 statistics software [25], and using NISIMCA-PALS algorithm for missing data [26]. Because
Agaricus romagnesii,Hypholoma fasciculare, andTricholoma acerbumhad more than 50% of missing data, these observations were not used in the models.
The statistical parameters for this study are described in Table 1. The goodness of fit of the model was evaluated using the following statistical parameters: squared correlation coefficient (r2), standard deviation of regression (s), significance of the model () and Fisher ratio value (F).
The predictive stability and robustness of the model was first verified by internal cross-validation by calculating the following parameters: Q2LOO (‘‘Leave-One-Out’’; 1-PRESS/ TSS were PRESS is the predictive error sum of squares and TSS the total sum of squares) and RMSE(training set) (root mean squared errors for the training set) [27,28].
2.3 QCAR model
The division was made to cover the entire antioxidant activity scale [29,30] and the samples included in the training set were randomly selected within each group [31].
The goodness of fit of the models was evaluated using r2, s,, and F. The predictive stability and robustness of the model was first verified by internal cross-validation calculating the following parameters: Q2LOO, permutation test of SIMCA-p software and RMSE(training set) [27,28,32]. Using the test set, the model was further checked by external cross-validation by calculating parameters: Q2ext (External, 1-PRESS/SD) and RMSE(test set)(root mean squared errors for the test set). PRESS is defined as the sum of the squared difference between the observed value and the predicted value for each compound in the test set, and SD is defined as the sum of the squared deviation between the observed value and the mean measured value of the training test [27].
3. Results and discussion
3.1 Relationships between antioxidant activity and chemical composition
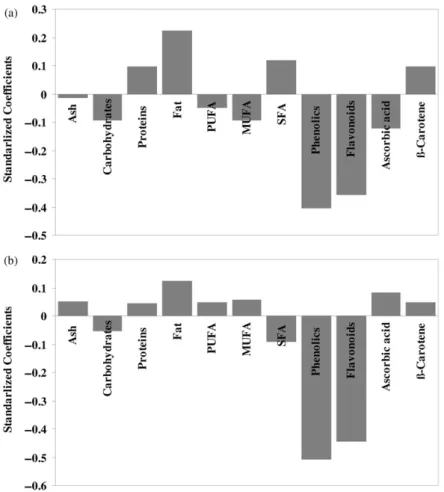
The relationships between antioxidant activity (RP and RSA) and several chemical components from various species of Portuguese wild mushrooms were evaluated using PLS regression (Figure 1). This approach has been adopted because PLS can predict possible relationships using the chemical variables as explicative ones. PLS extracts a few linear combinations (PLS factors) of the chemical and antioxidant data that predict as much of the systematic variation in the sample data as possible. Standardized regression coefficients for the relationships between variables revealed by the PLS were estimated by cross-validation and were used to evaluate the importance of each chemical component on antioxidant activity (Figure 1).
This analysis presented good statistical parameters for both RP and RSA, as summarized in Table 2. Information about some chemical compounds was not available (Table 1). To overcome this lack of information, we used a specific statistic algorithm available in SIMCA-P [26]. This algorithm dynamically selects samples with more than 50% of the chemical compound results. From the data set available, four mushroom species did not meet this criterion and were not considered in this initial analysis.
A similar relationship between chemical composition and antioxidant activity was observed for RSA (Figure 1a) and RP (Figure 1b), with the exception of fatty acids and ascorbic acid. A close observation of the standardized coefficients of the analysed chemical parameters shows that antioxidant activity is strongly positively related to phenolics and flavonoids contents (Figure 1). This is in agreement with several manuscripts reporting phenolic compounds as the main antioxidant substances in mushrooms, particularly phenolic acids and flavonoids [33]. Phenolic substances (ArOH) serve as oxidation terminators by scavenging radicals to form resonance stabilized radicals [34], according to:
RO2þArOH!ROOHþArO
Figure 1. Standardized coefficients of the chemicals compounds, Ash, Carbohydrates, crude protein (Proteins), total fat (Fat), polyunsaturated fatty acids (PUFA), monounsaturated fatty acids (MUFA), saturated fatty acids (SFA), total phenols (Phenolics), Flavonoids, Ascorbic acid and
-Carotene, used in the approached model for radical scavenging activity (a) and reducing power (b).
Table 2. Statistical parameters of the models, radical scavenging activity (RSA) and reducing power (RP), using the PLS method.
Parameter RSA RP
n 20 20
s 2.985 0.488
r2 0.84 0.92
0.011 0.023
F 4.74 3.87
Q2
LOO 0.59 0.70
RMSE 3.1942 0.5162
aqueous phase before the latter can initiate lipid peroxidation [35]. Carbohydrates gave a small positive contribution possibly due to the presence of mannitol (reducing sugar), a very abundant sugar in mushrooms which functions to provide support and expansion of the fruit body [13–17]. Unsaturated fatty acids (MUFA and PUFA) also show a small positive contribution to RSA but a negative contribution to RP; the presence of double bonds make them susceptible to oxidation – they can react with free radicals and become radicals themselves. Therefore, they act mostly as free radical scavengers. Particularly, oleic (C18:1) and linoleic acid (C18:2), abundant in mushrooms [13–17], proved to have more than 80% of RSA [36]. Nevertheless, it should be noted that fatty acids exist in mushrooms at very low concentrations.
Surprisingly,-carotene gave a small negative contribution to the antioxidant activity. This can be explained by the fact that this compound is present in mushrooms only in vestigial amounts [33]. The negative correlation between the fat and the antioxidant properties was expected since total fat obtained by soxhlet extraction includes linked compounds without reducing antioxidant properties and no free fatty acids. To obtain fatty acids, a derivatization process should be done. Saturated fatty acids (SFA) are not antioxidants and therefore, seem not to contribute to the scavenging effects. Stearic acid (C18:0), a fatty acid abundant in mushrooms, proved to have less than 20% of RSA [36]. Surprisingly, SFA show a slightly positive contribution to the RP of samples, probably through the reducing properties of the carboxylic moiety. The biosynthesis of phenolic compounds is derived from some amino acids, including tyrosine and tryptophan, in the shikimic acid pathway. A possible explanation for the negative contribution of proteins to the antioxidant properties is that they might be used as a source of amino acids to obtain phenolics, decreasing proteins content. The negative correlation between the ash and the reducing properties can also be explained as ash contains minerals and heavy metals (including iron) which can act as pro-oxidants [12].
3.2 QCAR model
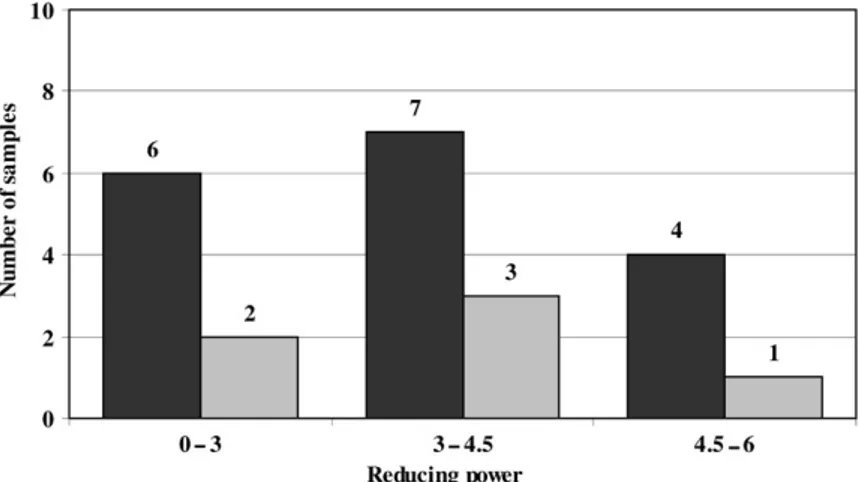
Based on the preliminary analysis we then set out to develop a QCAR model that could be used for predictive purposes. As phenolic and flavonoid contents were the parameters that better correlated to antioxidant activity they were chosen to build the model. Also RP analysis consistently gave better statistical parameters when compared to RSA analysis (Table 2) and thus we selected RP values to build the predictive QCAR model (Table 3). Figure 2 shows the number of samples assigned to the three groups of antioxidant activity: 0–3, 3–4.5 and 4.5–6 according to EC50values.
The QCAR model equation obtained and the statistical parameters was the following:
EC50RP¼10ð0:0239517Phenolicsðmg=g extÞ0:027891Flavonoidsðmg=g extÞþ0:740363Þ ð2Þ
n¼17, r2¼0.84, s¼0.8114, F¼37.53, ¼2.37106, Q2LOO¼0.83, RMSE(training set)¼
0.7507, Q2ext¼0.95, RMSE(test set)¼0.4979
wheren is the number of samples used,r2is the squared correlation coefficient,is the significance parameter of the model, F is the Fisher ratio, Q2LOO is the ‘‘Leave-One-Out’’ correlation coefficient and RMSE(training set) and RMSE(test set) are root mean squared errors for the training and test sets, respectively.
Table 3. Phenolics, flavonoids, experimental and predicted EC50 reducing power values of Portuguese wild mushrooms.
Species
Phenolics (mg/g ext)
Flavonoids (mg/g ext)
Experimental EC50RP
Predicted
EC50RP Residues
Agaricus arvensis 2.72 1.65 4.20 4.26 0.06
Agaricus bisporus 4.49 1.73 3.63 3.84 0.21
Agaricus romagnesii 6.18 2.87 2.23 3.25 1.02
Agaricus silvaticus 8.95 3.88 2.08 2.62 0.54
Agaricus silvicola* 6.40 3.40 3.24 3.11 0.13
Cantharellus cibarius 0.88 0.67 5.89 5.02 0.87
Hypholoma fasciculare* 17.67 5.09 0.95 1.50 0.55
Lactarius deliciosusF 2.95 1.91 4.65 3.83 0.82
Lactarius deliciosusD 3.40 2.71 4.98 4.13 0.85
Lactarius piperatus(SIII)* 3.09 0.35 5.40 3.74 1.66
Lactarius piperatus(SII) 5.76 1.58 2.29 3.62 1.33
Lactarius piperatus(SI) 5.52 1.26 2.83 4.54 1.71
Lepista nuda 6.31 3.36 3.53 3.13 0.40
Lycoperdon molle 11.48 2.45 2.27 2.49 0.22
Lycoperdon perlatum 10.57 2.10 2.96 2.68 0.28
Macrolepiota mastoideaD* 3.08 2.10 4.35 4.06 0.29
Macrolepiota mastoideaF* 2.69 1.56 4.44 4.29 0.15
Macrolepiota proceraD 3.17 0.99 4.18 4.33 0.15
Macrolepiota proceraF 2.59 0.90 4.49 4.50 0.01
Ramaria botrytis 20.32 16.56 0.68 0.62 0.06
Sarcodon imbricatusD 3.06 1.52 4.41 4.21 0.20
Sarcodon imbricatusF 2.22 1.12 5.94 4.53 1.41
Tricholoma acerbum* 5.53 1.87 3.27 3.60 0.33
Notes: *Test set observations; F, frozen mushrooms; D, dehydrated mushrooms; SI, immature (cap diameter less than 4.5 cm); SII, mature (cap diameter between 4.5 and 7 cm) with immature spores; SIII, mature (cap diameter higher than 7 cm) with mature spores. All the other samples were lyophilised and in SII.
as demonstrated by the Q2extvalue. Also RMSE values, for both the training and test sets, validate the model by presenting low and similar values. External validation is acknowledged to be the best method to validate a model as it is usually immune to over-fitness and over-prediction.
To validate the model even further, a permutation test was performed [27]. In this test the model is recalculated for randomly reordered response data (EC50 RP) and these permuted EC50RP values are related to intact predictor data by refitting the model and including cross-validation. Whenr2
permutation testand Q 2
permutation testare plotted as a function of the correlation coefficient between the original values and the predicted values, the intercept with the Y axis expresses to which degree these values rely on chance. Figure 3 shows the results obtained from 100 permutations for each of the samples under study. The intercepts of the two regression lines (forr2
permutation testand Q 2
permutation test) indicate the degree of overfitting and overprediction. Intercepts for r2permutation test and Q2permutation test below 0.30 indicate a valid model, as is the case.
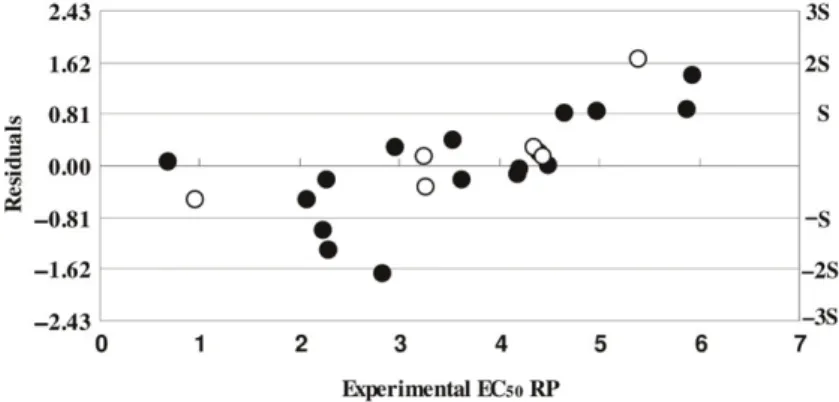
A plot of predicted EC50RP versus experimental EC50RP values, for both the training and test sets, is shown in Figure 4. The agreement observed between the predicted and experimental values confirms the predictability of this QCAR model. A plot of the residuals (predicted EC50 RP–experimental EC50 RP) versus experimental EC50 RP, for both the training and test sets is shown in Figure 5. A random distribution of the residuals about zero was observed for both sets. Because of this, no sample was considered a possible outlier as residuals were all within the standard deviation interval (3s to 3s) usually considered the limit line for spotting outliers. The relation between RP and phenolic and flavonoids content was not linear, but rather exponential. This is an indication that higher contents of these compounds will elevate by order of magnitudes RP (lower RP values means better antioxidant activity). Overall, as far as we know, this is the Figure 3. Results of the permutation test. The r2 and Q2 values were obtained from 100 permutations for the four developed PLS models. Intercepts: (r2) r2
permutation test¼0, 0.0818; (Q 2
first report of a QCAR model to predict reducing power using the chemical composition of mushrooms.
4. Conclusion
Several relationships were established between antioxidant activity and chemical compo-sition that provide a better understanding of the complex mechanisms of antioxidant activity of wild mushrooms. The positive effect of flavonoids and phenolic compounds was clearly established and other possible correlations with different composition parameters were discussed. This information allowed the development of a predictive QCAR model using mushroom flavonoid and phenolic composition. Several internal and external validation protocols were used and confirm the predictive power of the QCAR model. External validation is acknowledged to be the best rational protocol to avoid over- prediction and over-fitting. This model will be a useful tool in the study and prediction of antioxidant activity of more mushroom species.
Figure 4. Predicted versus experimental EC50RP for the training () and test sets (*).
Acknowledgements
The authors are grateful to the Foundation for Science and Technology (PTDC/AGR/56661/2004 project and BD/27430/2006 grant) for financial support of this work.
References
[1] M. Valko, D. Leibfritz, J. Moncol, M.T. Cronin, M. Mazur, and J. Telser, Free radicals and antioxidants in normal physiological functions and human disease, Int. J. Biochem. Cell. Biol. 39 (2007), pp. 44–84.
[2] L.J. Machlin and A. Bendich,Free radical tissue damage: Protective role of antioxidant nutrients, FASEB J 1 (1987), pp. 441–445.
[3] S.P. Wasser,Medicinal properties of substances occurring in higher Basidiomycete mushrooms: Current perspective (review), Int. J. Med. Mushrooms 1 (1999), pp. 31–62.
[4] U. Lindequist, T.H.J. Niedermeyer, and W.D. Julich, The pharmacological potential of mushrooms, eCAM 2 (2005), pp. 285–299.
[5] Y.L. Lee, S.Y. Jian, P.Y. Lian, and J.L. Mau,Antioxidant properties of extracts from a white mutant of the mushroomHypsizigus marmoreus, J. Food Comp. Anal. 21 (2008), pp. 116–124. [6] L.M. Cheung, P.C.K. Cheung, and V.E.C. Ooi,Antioxidant activity and total phenolics of edible
mushroom extracts, Food Chem. 81 (2003), pp. 249–255.
[7] J.L. Mau, C.-N. Chang, S.J. Huang, and C.-C Chen, Antioxidant properties of methanolic extracts from Grifola frondosa,Morchella esculenta andTermitomyces albuminosusmycelia, Food Chem. 87 (2004), pp. 111–118.
[8] M. Elmastas, O. Isildak, I. Turkekul, and N. Temur,Determination of antioxidant activity and antioxidant compounds in wild edible mushrooms, J. Food Comp. Anal. 20 (2007), pp. 337–345. [9] S.Y. Tsai, H.L. Tsai, and J.L. Mau, Antioxidant properties of Agaricus blazei, Agrocybe
cylindracea, andBoletus edulis, LWT-Food Sci. Technol. 40 (2007), pp. 1392–1402.
[10] M.Y. Kim, P. Seguin, J.K. Ahn, J.J. Kim, S.C. Chun, E.H. Kim, S.H. Seo, E.Y. Kang, S.L. Kim, Y.J. Park, H.M. Ro, and I.M. Chung, Phenolic compound concentration and antioxidant activities of edible and medicinal mushrooms from Korea, J. Agric. Food Chem. 56 (2008), pp. 7265–7270.
[11] A.A. Soares, C.G.M. Souza, F.M. Daniel, G.P. Ferrari, S.M.G. Costa, and R.M. Peralta, Antioxidant activity and total phenolic content ofAgaricus brasiliensis(Agaricus blazeiMurril) in two stages of maturity, Food Chem. 112 (2009), pp. 775–781.
[12] P. Maisuthisakul, S. Pasuk, and P. Ritthiruangdej,Relationship between antioxidant properties and chemical composition of some Thai plants, J. Food Comp. Anal. 21 (2008), pp. 229–240. [13] L. Barros, P. Baptista, D.M. Correia, S. Casal, B. Oliveira, and I.C.F.R. Ferreira,Fatty acid and
sugar compositions, and nutritional value of five wild edible mushrooms from northeast Portugal, Food Chem. 105 (2007), pp. 140–145.
[14] L. Barros, T. Cruz, P. Baptista, L.M. Estevinho, and I.C.F.R. Ferreira,Wild and commercial mushrooms as source of nutrients and nutraceuticals, Food Chem. Toxicol. 46 (2008), pp. 2742–2747.
[15] L. Barros, B.A. Venturini, P. Baptista, L.M. Estevinho, and I.C.F.R. Ferreira, Chemical composition and biological properties of portuguese wild mushrooms: A comprehensive study, J. Agric. Food Chem. 56 (2008), pp. 3856–3862.
[16] L. Barros, P. Baptista, D.M. Correia, J.S. Morais, and I.C.F.R. Ferreira,Effects of conservation treatment and cooking on the chemical composition and antioxidant activity of Portuguese wild edible mushrooms, J. Agric. Food Chem. 55 (2007), pp. 4781–4788.
[18] L. Barros, S. Falca˜o, P. Baptista, C. Freire, M. Vilas-Boas, and I.C.F.R. Ferreira,Antioxidant activity ofAgaricus sp. mushrooms by chemical, biochemical and electrochemical assays, Food Chem. 111 (2008), pp. 61–66.
[19] L. Barros, P. Baptista, and I.C.F.R. Ferreira, Effect of Lactarius piperatus fruiting body maturity stage on antioxidant activity measured by several biochemical assays, Food Chem. Toxicol. 45 (2007), pp. 1731–1737.
[20] L. Barros, M.-J. Ferreira, B. Queiro´s, I.C.F.R. Ferreira, and P. Baptista,Total phenols, ascorbic acid,-carotene and lycopene in Portuguese wild edible mushrooms and their antioxidant activities, Food Chem. 103 (2007), pp. 413–419.
[21] R.L. Prior, X.L. Wu, and K. Schaich,Standardized methods for the determination of antioxidant capacity and phenolics in foods and dietary supplements, J. Agric. Food Chem. 53 (2005), pp. 4290–4302.
[22] L. Barros, R.C. Calhelha, J.A. Vaz, I.C.F.R. Ferreira, P. Baptista, and L.M. Estevinho, Antimicrobial activity and bioactive compounds of Portuguese wild edible mushrooms methanolic extracts, Eur. Food Res. Technol. 225 (2007), pp. 151–156.
[23] R. Amarowicz, R.B. Pegg, P. Rahimi-Moghaddam, B. Barl, and J.A. Weil, Free-radical scavenging capacity and antioxidant activity of selected plant species from the Canadian prairies, Food Chem. 84 (2004), pp. 551–562.
[24] S. Wold, M. Sjostrom, and L. Eriksson,PLS-regression: A basic tool of chemometrics, Chemom. Intell. Lab. Syst. 58 (2001), pp. 109–130.
[25] M. Fernandez, J. Caballero, A.M. Helguera, E.A. Castro, and M.P. Gonzalez, Quantitative structure-activity relationship to predict differential inhibition of aldose reductase by flavonoid compounds, Bioorg. Med. Chem. 13 (2005), pp. 3269–3277.
[26] A.B. Umetrics, SIMCA-P 12þ, User Guide. Umetrics Inc, 17 Kiel Ave, Kinnelon NJ 07405, USA, 2008.
[27] P. Gramatica,Principles of QSAR models validation: Internal and external, QSAR Comb. Sci. 26 (2007), pp. 694–701.
[28] P. Gramatica and E. Papa,An update of the BCF QSAR model based on theoretical molecular descriptors, QSAR Comb. Sci. 24 (2005), pp. 953–960.
[29] O. Farkas, J. Jakus, and K. Heberger,Quantitative structure – antioxidant activity relationships of flavonoid compounds, Molecules 9 (2004), pp. 1079–1088.
[30] L. Saı´z-Urra, M.P. Gonza´lez, and M. Teijeira, 2D-autocorrelation descriptors for predicting cytotoxicity of naphthoquinone ester derivatives against oral human epidermoid carcinoma, Bioorg. Med. Chem. 15 (2007), pp. 3565–3571.
[31] A.C. Durand, A. Farce, P. Carato, S. Dilly, S. Yous, P. Berthelot, and P. Chavatte,Quantitative structure-activity relationships studies of antioxidant hexahydropyridoindoles and flavonoid derivatives, J. Enzyme Inhib. Med. Chem. 22 (2007), pp. 556–562.
[32] L. Eriksson, E. Johansson, M. Muller, and S. Wold, Cluster-based design in environmental QSAR, Quant. Struct.-Act. Relat. 16 (1997), pp. 383–390.
[33] I.C.F.R. Ferreira, L. Barros, and R.M.V. Abreu,Antioxidants in wild mushrooms, Curr. Med. Chem. 16 (2009), pp. 1543–1560.
[34] C.A. Rice-Evans, N.J. Miller, and G. Paganga, Antioxidant properties of plant-derived compounds, Trends Plant Sci. 2 (1997), pp. 152–159.
[35] M.W. Davey, M. Van Montagu, D. Inze, M. Sanmartin, A. Kanellis, N. Smirnoff, I.J.J. Benzie, J.J. Strain, D. Favell, and J. Fletcher, Plant L-ascorbic acid: Chemistry, function, metabolism, bioavailability and effects of processing, J. Sci. Food Agric. 80 (2000), pp. 825–860.