“NOTICE: this is the author’s version of a work that was accepted for publication in the Journal Biomicrofluidics. Changes resulting from the publishing process, such as peer review, editing, corrections, structural formatting, and other quality control mechanisms may not be reflected in this document. A definitive version is available in Biomicrofluidics 7, 054110, 2013.
Human Red Blood Cell Behavior under Homogeneous Extensional Flow in a
Hyperbolic-Shaped Microchannel
T. Yaginuma1, M. S. N. Oliveira2,3, R. Lima1,3, T. Ishikawa4 and T. Yamaguchi5
1
Polytechnic Institute of Bragança, ESTiG/IPB, Portugal, tyaginuma09@gmail.com, ruimec@ipb.pt 2
Department of Mechanical and Aerospace Engineering, University of Strathclyde, Glasgow G1 1XJ, UK, monica.oliveira@strath.ac.uk
3
Centro de Estudos de Fenómenos de Transporte, Faculdade de Engenharia, Universidade do Porto, Rua Dr. Roberto Frias, 4200-465 Porto, Portugal
4
Department of Bioengineering and Robotics, Graduate School of Engineering, Tohoku University, Japan, ishikawa@pfsl.mech.tohoku.ac.jp
5
Department of Biomedical Engineering, Graduate School of Engineering, Tohoku University, Japan, takami@pfsl.mech.tohoku.ac.jp
ABSTRACT
It is well known that certain pathological conditions result in a decrease of red blood cells (RBCs) deformability and subsequently can significantly alter the blood flow in microcirculation, which may block capillaries and cause ischemia in the tissues. Microfluidic systems able to obtain reliable quantitative measurements of RBC deformability hold the key to understand and diagnose RBC related diseases. In this work, a microfluidic system composed of a microchannel with a hyperbolic-shaped contraction followed by a sudden expansion is presented. We provide a detailed quantitative description of the degree of deformation of human RBCs under a controlled homogeneous extensional flow field. We measured the deformation index (DI) as well as the velocity of the RBCs travelling along the centerline of the channel for four different flow rates and analyze the impact of the particle Reynolds number. The results show that human RBC deformation tends to reach a plateau value in the region of constant extensional rate, the value of which depends on the extension rate. Additionally, we observe that the presence of a sudden expansion downstream of the hyperbolic contraction modifies the spatial distribution of cells and substantially increases the cell free layer (CFL) downstream the expansion plane similarly to what is seen in other expansion flows. Beyond a certain value of flow rate, there is only a weak effect of inlet flow rates on the enhancement of the downstream CFL. These in vitro experiments show the potential of using microfluidic systems with hyperbolic-shaped microchannels for both the separation of the RBCs from plasma and to assess changes in RBC deformability in physiological and pathological situations for clinical purposes. However, the selection of the geometry and the identification of the most suitable region to evaluate the changes on the RBC deformability under extensional flows are crucial if to be used as an in vitro clinical methodology to detect circulatory diseases.
Keywords: Extensional flows, red blood cells, hyperbolic microchannel, deformation index.
1 INTRODUCTION
and its cytoskeleton and intracellular viscosity. For example, RBCs elongate significantly when they pass through capillaries, the diameter of which is smaller than the diameter of the RBCs at rest [1-5]. The deformability (usually reported as a deformation index, DI) is an important property for the delivery of oxygen to the body and a decrease in RBC deformability can have serious consequences leading to health problems [5]. There are several studies examining the behaviour of RBCs in response to a deforming force (or stress) and demonstrating the clinical relevance of this phenomenon in several blood cells related diseases, such as malaria [4, 6], and diabetes mellitus (DM) [5, 7, 8] in which the deformability is significantly reduced. The capability of the cells to deform has, therefore, the potential to be used as a biophysical marker, without requiring the costly labeling and sample preparation typical of most common biochemical markers [9].
During the last decade, the deformation capability of RBCs and its associate effects such as Fahraeus effect, margination and plasma skimming have been applied to develop microfluidic systems for blood cells separation and analysis [10]. Faivre et al. [11] showed that varying geometrical parameters such as the width and length of a constriction can promote a dramatic enhancement of the cell-free layer (CFL) downstream of the constriction region. More recently, Leble et al. [12] have also demonstrated the formation of a CFL around the apex of a confluence and its propagation in a straight line downstream of this region. Additionally, Fujiwara et al. [13] have determined the motion of both normal and hardened RBCs in a microchannel with a stenosis using a confocal system. This study has shown evidence that not only it is possible to create an artificial CFL under appropriate hemodynamic and geometrical conditions but also the CFL thickness is strongly influenced by the RBC deformability. These findings have been promoting the design of new alternative biomedical microdevices able to separate blood cells from plasma and also to detect cellular-scale changes, which can be insightful for medical diagnosis. In particular Yang et al. [14] and Shevkoplyas et al. [15] used biomimetic approaches to separate blood cells from plasma, and leukocytes from whole blood, respectively. Additionally, Shevkoplyas et al. [16] also proposed a microfluidic device for assessing RBC deformability in a microchannel network with a topology similar to that of the real microcirculation and showed the ability to detect small changes of RBC deformability on the blood flow in a microchannel network may prove a viable clinical instrument in early detection of blood diseases. More recently, Hou et al. [6] have proposed a biomimetic separation device to separate normal and malaria infected RBCs.
Investigations on human RBC deformability have been performed using a variety of techniques, including optical tweezers, micropipette aspiration, rheoscope and ektacytometer [17, 18]. These and other techniques were thoroughly reviewed by Kim et al. [19] and are useful in measuring the RBC deformation under shear flow or the rheological properties of the RBC membrane, but are generally labor intensive, time consuming and involve a typically difficult process of manipulation. Among these methods, the micropipette aspiration is the most popular single-cell technique to measure the mechanical properties of the RBC membrane [18]. Briefly, the RBC membrane is aspirated by a negative pressure through a glass micropipette, having inner diameter much smaller than the RBC average size, forcing the micropipetted RBCs to adopt an extended “tongue” shape where its length is measured under a microscope. A major drawback of this technique is that direct contact between the cell surface and the wall cannot be avoided and the extensional rate is not constant in space and time. Hence, the mechanical properties of the RBCs measured with this method are affected, for example, by the pipette shape, pressure difference and viscosity ratio.
[8, 10, 13, 16, 20-22]. However, most of the proposed devices focus mainly on the effect of shear flow alone. Some examples are the measurement of the RBC cellular trajectories and deformation under a transient high shear stress in microchannels with a rectangular cross-section [21, 22] and the determination of cell deformability of a single RBC flowing in a microfluidic device with a microchannel thickness comparable to the RBC size [20]. Studies focusing on the effect of extensional flow field on the RBC flow and deformability are scarce despite extensional flow often being present in the microcirculation, particularly when there is a sudden change in geometry, e.g. in stenosis and in microvascular networks composed of short irregular vessel segments linked by numerous bifurcations. In converging flows such as those found in microstenoses, extensional flow can be generated due to the dramatic change of velocity when the fluid flows from a wide to a narrow region of the channel. The behavior of an RBC under extensional flow is known to be different from that under shear flow. For instance, in the case of extensional flow, an RBC does not show tumbling motion as in shear flow [23]. However, details of these differences have not been clarified fully in former studies.
In the present work, we use a microfluidic hyperbolic-shaped contraction to achieve an extensional flow, in which RBCs are submitted to high strains and a range of strain-rates. The rationale behind the use of hyperbolic contractions is their ability to impose a nominally constant strain rate
dux /dxconstant 0
along the centerline as discussed by James [24] for an axisymmetric configuration. Relevant works in the context of blood flow are those of Sousa et al. [25] and Lee at al. [26] who studied the effect of the extensional flow in hyperbolic converging microchannels using artificial polymer-based blood analog fluids and in vitro rabbit blood, respectively. Sousa et al. [25] used hyperbolic contractions of different Hencky strains to show that two well-established blood analogue fluids with identical steady-shear viscosity, but different extensional rheology, behave very differently when submitted to conditions equivalent to the microcirculation. The blood analog fluids considered in that study were polymeric solutions and therefore no study on the effect of RBC deformability under extensionalflow was undertaken. Lee at al. [26] has shown, using rabbit RBCs, that the extensional flow was more efficient in inducing deformation than shear flow. Moreover, Lee at al. [26] have only performed RBC deformability measurements in one single region around the middle of the hyperbolic contraction and assumed that the nominal strain rate was achieved in this region. However, Oliveira et al [27] have shown that in planar microchannels the strain rate along the contraction is not truly homogeneous. The authors examined the flow kinematics in detail using micro-particle image velocimetry (PIV) and showed that the velocity profile in the contraction region deviates from linear due to wall, entrance and end effects resulting from the low aspect ratios typical of microfluidic devices and from the sharp transitions to and from the contraction region. Moreover, the cell flow behavior may be affected by variables such as cell shape, particle Reynolds number (ratio of inertial to viscous forces), Peclet number (ratio of advection rate and diffusion rate) and Stokes number (ratio of the relaxation time of the cell to the characteristic time of the flow), and depending on these conditions cells may no longer follow the fluid streamlines [28]. Therefore, to be able to use this type of experiment as a biophysical marker in a diagnostic context it is crucial that the actual flow field is well understood. In the present paper we examine the evolution of RBC deformability, quantified in terms of DI values, along the full length of the hyperbolic converging microchannel, including upstream and a sudden expansion release plane downstream, and simultaneously evaluate the cell velocity, quantify the extension rate and identify the region of homogeneous strain-rate. This study is important not only to understand the RBC motion and mechanical properties under the effect of extensional flows but also to help clinicians decide in which region to perform analysis of RBC deformability under pathological conditions, for which reliable quantitative techniques are still lacking.microchannel, with a hyperbolic-shaped contraction followed by a sudden expansion, for a range of imposed volumetric flow rates. By using a high-speed video microscopy system combined with image analysis technique, we were able to provide detailed quantitative description of the RBC DI for a range of imposed volumetric flow rates. Additionally, cell tracking was performed to quantify the velocity of the cells along the channel and evaluate the geometrical effect of the hyperbolic contraction-sudden expansion on the spatial distribution of RBCs and the size of the cell-free layer (CFL). Finally, we also show the benefits and the potential applications of this unique approach to assess RBC deformability and how it can be integrated into a diagnostic microfluidic system to simultaneously deform and separate cells.
2 MATERIALS AND METHODS
2.1 Working Fluids and Microchannel Geometry
The working fluid used in the present study was composed of Dextran 40 (Dx40) containing ~1% of human RBCs (i.e., hematocrit, Hct = 1%). The density and viscosity of Dextran 40 are 1046 kg m-3 and 4.5×10⁻³ Pa s, respectively. Blood was collected from a healthy adult volunteer, and EDTA (ethylenediaminetetraacetic acid) was added to the collected samples to prevent coagulation. The blood samples were submitted to washing and centrifuging processes to separate the RBCs from the plasma and buffy coat. The RBCs were then added to Dx40 to make up a suspension with the required RBC concentration, and were subsequently stored hermetically at 4ºC until the experiments were performed. All procedures in this work were carried out in compliance with the Ethics Committee on Clinical Investigation of Tohoku University.
The microchannels containing the hyperbolic contraction were produced in polydimethylsiloxane (PDMS) using standard soft-lithography techniques from a SU-8 photoresist mold. The molds were prepared in a clean room facility by photo-lithography using a high-resolution chrome mask. The geometry and real dimensions of the micro-fabricated channels are shown in Figure 1.
Figure 1. Schematics of the hyperbolic contraction geometry used in the experiments. The channel depth, d,was 60 µm and the width of the upstream and downstream channels were the same, W1 = 406 µm. The minimum width in the contraction region was W2 = 17 µm, defining a total Hencky strain of
εH = ln(W1/W2) = 23.9.
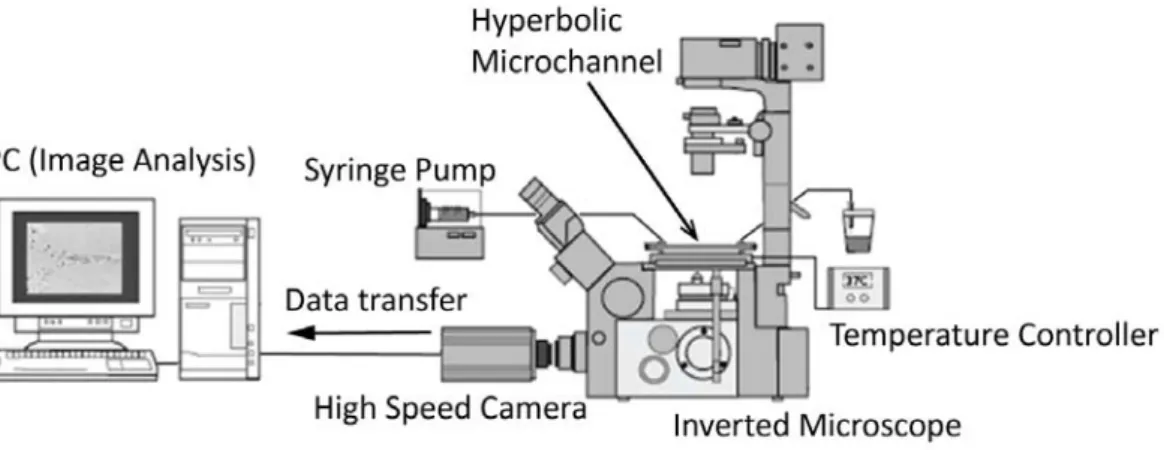
images were transferred to a computer to be analyzed. An illustration of the experimental set-up is shown in Figure 2 and relevant experimental parameters are summarized in Table 1.
Figure 2: Experimental set-up consisting of an inverted microscope (IX71, Olympus, Japan), a high speed camera (Phantom v7.1, Vision Research, USA), a syringe pump (KD Scientific Inc., USA) and a thermo plate controller (Tokai Hit, Japan).
Table 1. Summary of experimental parameters
Experimental parameters
Width of microchannel upstream and
downstream 406 µm
Minimum width of contraction 17 µm
Length of contraction region 780 µm
Depth of microchannel 60 µm
Inlet flow rate 0.11, 1.11, 2.27 and 4.2 ml/h
Mean velocity of the fluid 1.56, 1.56, 31.5 and 58.2 mm/s
Mean diameter of human RBC at rest 8 m
Shear viscosity of Dextran 40 4.5 × 10⁻³ Pa s
Density of Dextran 40 1046 kg/m3
Hematocrit of working fluid 1 %
Temperature 37 ᵒC
Magnification (M) 20× (Optical zoom 1.6×)
Frame rate of camera 4800 - 13000 frames/s
Exposure time 2 µs
Frame interval 77 – 208 µs
2.2 Image Analysis
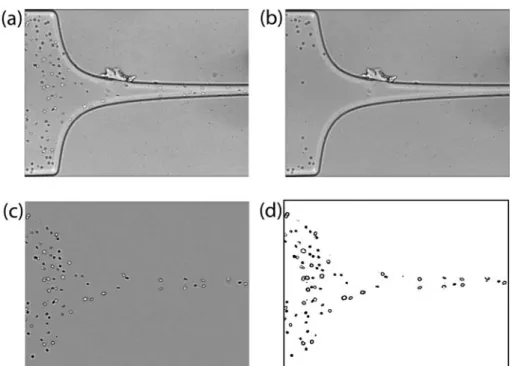
the contraction part images and expansion plane images, and a resolution of 800 × 200 pixels at frame intervals of 77 µs for the ending part of the contraction region images. A typical image obtained is shown in Figure 3a. Then, in order to reduce the dust and static artifacts in the images, a background image (Figure 3b) was created from the original stack images by averaging each pixel over the sequence of static images using an image handling software ImageJ (NIH) function called Z project, and then subtracted from the stack images [29]. This process eliminates all the static objects from the original images including the microchannel walls, which resulted in images having only the flowing RBCs visible (Figure 3c). To enhance the image quality, image filtering such as Median operation with a mask size of 3×3 pixels, and Brightness/Contrast adjustment was also applied. Finally, the greyscale images were converted to binary images adjusting the threshold level (Figure 3d). In this study, Otsu threshold method was applied first and when required the level was refined manually for optimal binarization. In general, the pixels with intensity levels in the range of 0-70 were set to be 0 (black) and the pixels with intensity levels greater than 70 were set to be 255 (white); although the level was slightly adjusted depending on the quality of each image stack, the differences are minimal. This segmentation process yields regions of interest (RBCs) as black ellipsoidal objects against a white background. Next, the flowing cells in the binary images were measured frame by frame automatically by Analyze Particles function in ImageJ. Various measurement parameters, such as Area and Circularity of the cells, were appropriately pre-set to ignore the apparent deviant objects (eg. out-of-focus cells, aggregated cells, etc.). The major output results of this measurement are the major and minor axis lengths of the RBCs and the x-y coordinates of their centroid.
Figure 3. Images analysis sequence: a) original image in which moving cells as well as microchannel boundaries and other static objects are visible, b) background image containing only static objects, c) original image after background subtraction showing only moving objects, and d) final binary image.
Figure 4: Definition of the deformation index, DI=|(L1−Udt)−L2)|/ =(L1−Udt)+L2), where L1 and L2are the major (primary) and minor (secondary) axis lengths of the ellipse best fitted to the cell, Udt is the traveling length of RBC that is calculated by the RBC velocity (U) times the exposure times of high speed
camera (dt).
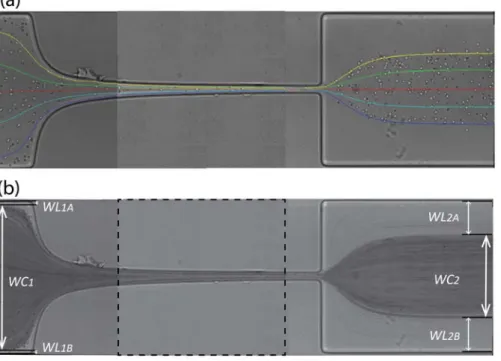
For each flow rate, the trajectories of about 30 individual RBCs were tracked manually using ImageJ plug-in, MTrackJ, in order to examine the actual velocity of the flowing cells [30-32]. Sample cells were selected at various positions in the y-axis in the upstream region of the microchannel to obtain a representative illustration of the trajectories as shown in Figure 5. We should note that the same cell cannot be tracked all the away from upstream to downstream of the contraction region, and Figure 5 is a combination of three separate sets of images corresponding to different axial regions. However, careful superposition and selection of the cells to match the same position in consecutive images allow us to show nearly full cell path lines.
Figure 5. a) RBC trajectories manually tracked by MTrackJ plug-in from ImageJ. b) Image obtained after post-processing using the minimum intensity level option in ImageJ, Zproject operation for the measurement of the cell free layer and relevant variables: WC1 and WC2 are the widths of RBC core upstream and
downstream of the hyperbolic region, respectively. WL1A and WL1B are the widths of CFL upstream of the contraction region, and WL2A and WL2B are the widths of CFL downstream of the contraction region. Each image is a combination of three separate images covering different parts of the channel. The dashed
lines indicate the boundaries between images.
CFLs as shown in Figure 5b. The width of the CFLs and core regions can then be easily evaluated. In our study, the same process was applied for four different flow rates (0.11ml/h, 1.11ml/h, 2.27ml/h and 4.2ml/h) and each CFL and core widths were manually measured using ImageJ. The relevant variables are the widths of RBC core upstream and downstream of the hyperbolic region (WC1 and WC2 respectively), the widths of CFL upstream of the contraction region (WL1A and WL1B) and the widths of CFL downstream of the contraction region (WL2A and WL2B) (cf. Figure 5b).
3 RESULTS AND DISCUSSION
3.1 Cell velocity and strain rate
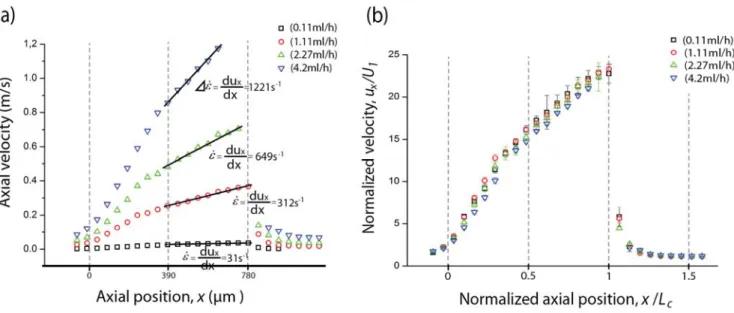
The cells traveling along the centerline of the microchannel were manually tracked and their local velocity was determined for four different volumetric flow rates. Figure 6 shows the averaged cell velocity for each 50µm axial region throughout the central region of the microchannel for the four flow rates. The overall trend for all flow rates is similar. As the cells approach the contraction (x/Lc = 0), a cell acceleration is observed due to entrance effects. Within the contraction region, as the width of the channel gets smaller, the cell velocity increases significantly, attaining a maximum value just before the expansion plane (x/Lc = 1). The maximum velocity measured is, in most cases, slightly below the actual fully developed value expected for single phase flows. It is clear from the velocity profiles in Figure 6 that the strain rate is not constant for the whole length of the contraction. However, there is a region where the velocity increases almost linearly with the axial position and consequently we can define a constant extension rate in this region. For this region, we can thus define a single characteristic strain rate
that can be calculated as the slope dux/dx, where ux refers to the cell axial velocity. The values ofstrain rate obtained in this way are comparable (within 10%) to the nominal strain rate values calculated
for single fluid flow by 1 1
1
c c
nom
c
U U w w
Q
L Lhw w
. However, it should be noted that when high particle
Figure 6. a) Axial velocity profiles of flowing RBCs along the centerline for four flow rates (Q=0.11ml/h, Q=1.11ml/h, Q=2.27ml/h and Q=4.2ml/h). The solid lines represent the fit used to determine the strain rate in the linear region, calculated from the slope dux/dx. b) Normalized axial velocity profile ux/U1,
where ux refers to an instantaneous cell velocity average, and U1 is the cross-section overall mean velocity based on the large channel, U1= Q/(dW1). The dashed lines indicate the start (x/Lc = 0), mid (x/Lc = 0.5) and end (x/Lc = 1) of the contraction region.
3.2 Deformation Index
In this section, we focus on the deformation of the RBCs travelling near the microchannel centerline (y
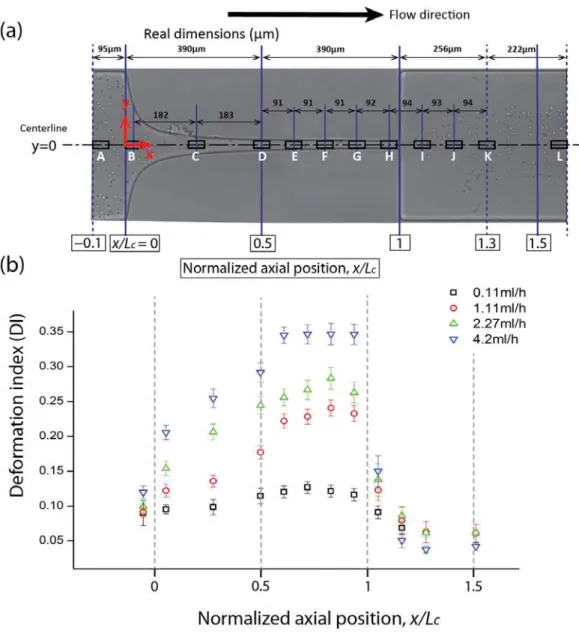
= 0). As illustrated in Figure 7(a), 12 regions were pre-defined in order to analyze the degree of DI along the centerline. Each rectangular region is 50µm long and 20µm high and all the cells captured in each region were measured and the averaged DI was calculated as described in section 2.2.
Far upstream of the contraction region, the orientation of the RBCs is affected mainly by shear stress induced by the out-of-plane walls (top and bottom walls on the z-direction). According to Omori et al. [33, 34], the RBC orientation tends to converge to a certain direction when the cells are submitted to strong shear for a sufficiently long-time. Therefore, in the present case, most of the RBCs tend to direct parallel to the out-of-plane walls, showing a nearly circular shape, which is desirable for two-dimensional measurements of RBC DI, as the errors caused by the RBC orientation are minimized. Moreover, the shear caused by these nearby walls may induce the RBC to show tank-treading motion with its flattened plane parallel to the out-of-plane walls. To examine whether or not the RBCs are actually in the tank-treading regime, it is relevant to know if the RBCs are travelling steadily with a similar orientation. There are two important dimensionless numbers that need to be considered in this context, the viscosity ratio of
inside to outside fluid
cell
and the capillary number, Ca, defined as the ratio of the fluid viscous
forces causing the deformation and the membrane elastic forces that resist deformation:
s
G
a
where µ is the shear viscosity of Dextran 40 solution, is the shear rate, a is the characteristic length of the undeformed RBC and Gs is the shear elastic modulus [33, 34]. The shear rate was estimated as 2ux/H,
where ux is the average axial velocity at the centerline of the defined region and H is min (W, h) where W
is the width of the microchannel and h is the distance between upper and lower walls. The Ca values were calculated for several regions along the centerline of the microchannel as a function of flow rate and are presented in Table 2 assuming a=2.82µm [35] and Gs=4µN/m [36]. It is generally agreed that in shear
flow, suspended RBCs show smooth tank-treading motion when Ca is larger than about 1 [33, 34] and the suspending medium viscosity is sufficiently high, with the viscosity ratio of inside to outside fluid being about unity [37]. In the present study, we use Dextran 40, which yields a viscosity ratio about 1.0-1.5. However, it is not been clarified in previous studies how the above criterion for tank-treading motion changes with flow type (recall that the flow at the centerline of the contraction is extensionally-, rather than shear-dominated). Nevertheless, we believe the instantaneous Capillary number (cf. Table.2), is still insightful for a broad understanding of the RBCs motion. Except for the lowest flow rate (Q = 1.11ml/h), the results obtained from these examined regions show sufficiently high Ca values, in particular for x/Lc 0.5.
Table 2. Capillary number, Ca, for three regions at the microchannel for different flow rates.
Flow rates
Regions* Q= 0.11ml/h Q= 1.11ml/h Q= 2.27ml/h Q= 4.2ml/h
A 0.29 3.12 6.14 9.94
C 3.13 33.94 59.34 98.02
F 11.00 110.08 211.63 383.67
*Note that the regions correspond to those depicted in Fig.7.
Figure 7. Evaluation of the deformation of the flowing RBCs at the centerline of the hyperbolic microchannel. (a) Illustration of the 12 regions used to analyze the RBCs deformation index. (b) Average DI in the 12 regions at four different volumetric flow rates: Q = 0.11ml/h, Q = 1.11ml/h, Q = 2.27ml/h and Q = 4.2ml/h. The measured values are expressed as the means ± standard deviation according to a t-test analysis at a 95% confidence interval.
rabbit RBCs. Hence, in contrast with the study performed by Lee at al. [19], here we provide a detailed quantitative description of human RBC DI along the whole hyperbolic microchannel and we were able to observe that the human RBCs tend to reach a converged DI value in the region just after the contraction mid-point.
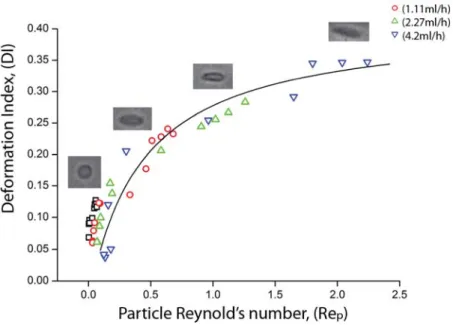
In order to get further insight into the RBC behavior under flow at the centerline of the hyperbolic microchannel, DI is plotted as a function of the particle Reynolds number (see Fig 8). The DI values are those used for Figure 7b, that is, the average DIs of 12 regions at four different flow rates. The particle Reynolds number (Rep) is useful to assess the behavior of flowing cells suspended in the working fluid taking into account the inertial and viscous forces occurring by interactions of the cells and the fluid. Rep can be expressed by the following equation:
Re
RBCp
UD
(2)
where U is the average velocity of the RBCs flowing at the centerline of the hyperbolic microchannel,
RBC
D
is the undeformed diameter of a human RBC [1], µ and
are the shear viscosity and density of Dextran 40 solution, respectively. It is interesting to note that the DI values initially increase monotonically with Rep, but start converging for Rep˃ 1, possibly indicating the existence of a maximum value above which the cells could not deform any further.Figure 8. RBCs DI as a function of Rep at the centerline of the hyperbolic microchannel for different volumetric flow rates: Q = 0.11ml/h, Q = 1.11ml/h, Q = 2.27ml/h and Q = 4.2ml/h. The Rep was calculated by assuming the average diameter of a human RBC (DRBC ) = 8 µm [1].
3.3 Cell free layer
as human RBCs. To the best of our knowledge, we report for the first time the effect of the flow rate on spatial distribution of the deformable human RBCs downstream of a hyperbolic-shaped contraction. Our results are compared with past results [10, 11] obtained in microchannels having sudden contractions.
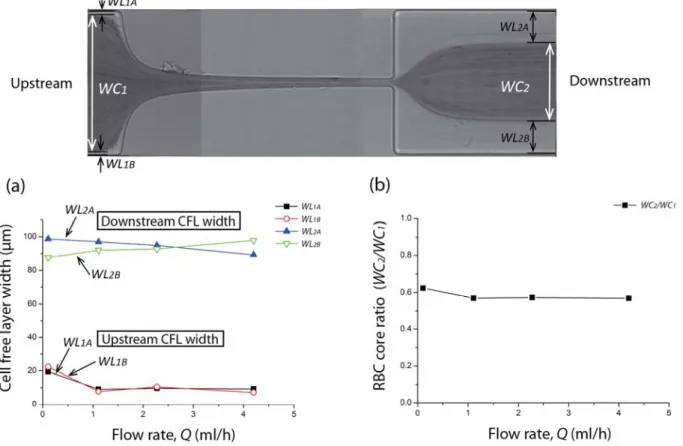
The widths of cell depleted region, also known as cell free layer (CFL), as well as the widths of the core RBC region were measured upstream and downstream of the hyperbolic contraction region as shown in Figure 9.
Figure 9 Cell free layer measurements. (a) Width of CFLs upstream and downstream as a function of the flow rate: Q = 0.11ml/h, Q = 1.11ml/h, Q = 2.27ml/h and Q = 4.2ml/h. (b) Effect of the flow rate on the ratio of the core RBC widths downstream and upstream of the contraction.
a function of the flow rate. A slightly higher ratio is observed only for the lowest flow rate due to the wider upstream CFL. A possible explanation for this phenomenon is that the CFL tends to increase both with the strain rate and with the time that RBCs spend within the hyperbolic contraction, and as a result by increasing the flow rate these two effects tend to cancel. Additionally, our results corroborate the study performed by Faivre et al. [11] where by using a sudden contraction-expansion they showed that not only that the CFL is enhanced by the presence of a contraction but also that the flow rate has a weak effect on the thickness of the downstream CFL, for the range of flow rates and Reynolds tested.
4 CONCLUSIONS, POTENTIAL BENEFITS AND FUTURE DIRECTIONS
The understanding of RBC deformability has become important ever since the clinical relevance of this hemorheological parameter has been recognized. The use of microfluidic devices, as proposed in this study, has the great advantage of being suitable to deal with single cell deformability while probing large numbers of cells in one single run. This high throughput capability together with the ability to achieve a controlled flow, make it possible to detect small changes of RBC deformability potentially in a more efficient and less time-consuming way than in conventional deformability measurements, having the potential to become a valuable approach for routine cell screening and early detection of several diseases related to RBC deformability. In this study, we focus on the effect of extensional flow, rather than shear flow, using a microfluidic device with a hyperbolic-shaped contraction in which the RBCs experience a strong extensional flow with a region of homogeneous strain rate along the centerline, as shown by our velocity measurements using particle tracking. Our measurements show that the RBCs are highly deformable under strong extensional flows, with the degree of deformability being highly dependent on the flow rate and exhibiting a DI that seems to be converging to a maximum plateau value as Rep is increased. For the range of conditions tested here, RBC rupture was never observed. The proposed strategy to assess RBC deformability can be easily transformed into a simple, inexpensive and convenient tool suitable to detect and diagnose RBC related diseases. However, the viability to convert the proposed microfluidic device into a viable clinical instrument and the potential clinical significance of our measurements still requires further research.
Acknowledgment
The authors acknowledge the financial support provided by 2007 Global COE Program “Global Nano-Biomedical Engineering Education and Research Network”, Japan and grant-in-Aid for Science and Technology PTDC/SAU-BEB/108728/2008, PTDC/SAU-BEB/105650/2008, PTDC/EME-MFE/099109/2008 and PTDC/SAU-ENB/116929/2010 from FCT (Science and Technology Foundation), COMPETE, QREN and European Union (FEDER).
References
1 C. Caro, T. Pedley, R. Schroter, and W. Seed, The mechanics of the circulation (Oxford University Press, 1978) 2 R. Skalak and P-I Branemark, Science 164, 717-719 (1969).
3 M. Abkarian, M. Faivre, R. Horton, K. Smistrup, C. A. Best-Popescu, and H. A. Stone, Biomed. Mater. 3, 034011 (2008). 4 M. R. Hardeman and C. Ince, Clin. Hemorheol. Micro. 21, 277–284 (1999).
5 Y. I. Cho, M. P. Mooney, and D. J. Cho, J. Diabetes. Sci. Technol. 2, 1130- 1138 (2008).
6 H. W. Hou, A: A. Bhagat, A. G. Chong, P. Mao, K. S. Tan, J. Han and C. T. Lim, 10, 2605–2613 (2010) 7 K. Tsukada, E. Sekizuka, C Oshio, and H. Minamitani, Microvasc. Res. 61, 231-239 (2001).
8 S. Shin, Y. Ku, J. Ho, Y. Kim, J. Suh, and M. Singh, Clin. Hemorheol. Micro. 36, 253–261 (2007).
9 D.R. Gossett, H. T. K. Tse, S. A. Lee, Y. Ying, A. G. Lindgren, O. O. Yang, J. Rao, A. T. Clark, and D. Di Carlo.
Proceedings of the National Academy of Sciences of United States of America, 109 (20), pp. 7630–7635 (2012).
10 M. Abkarian, M. Faivre, R. Horton, K. Smistrup, C. A. Best-Popescu, and H. A. Stone, Biomed. Mater. 3, 034011 (2008). 11 M. Faivre, M. Abkarian, K. Bickraj and H. A. Stone. Biorheology 43 (2), 147 (2006).
12 V. Leble, R. Lima, R. P. Dias, C. S. Fernandes, T. Ishikawa, Y. Imai, and T. Yamaguchi, Biomicrofluidics 5, 044120 (2011). 13 H. Fujiwara, T. Ishikawa, R. Lima, N. Matsuki, Y. Imai, H. Kaji, M. Nishizawa, and T. Yamaguchi, J. Biomech. 42, 838 (2009).
14 S. Yang, A. Undar, and J. D. Zahn, Lab Chip 6, 914 (2006).
15 S. S. Shevkoplyas, T. Yoshida, L. L. Munn, and M. W. Bitensky, Anal. Chem. 77, 933 (2005).
16 S. S. Shevkoplyas, T. Yoshida, S. C. Gifford, and M. W. Bitensky, Lab Chip 6, 914 (2006). 17 M. Musielak. Clin. Hemorheol. Micro. 42, 47–64 (2009).
18 T. Shiga, N. Maeda, and K. Kon, Crit. Rev. Oncol. Hemat. 10 (1) 9-48 (1990).
19 D. H. Kim, P. K. Wong, J. Park, A. Levchenko and Y. Sun, Annu. Rev. Biomed. Eng. 11, 203 (2009). 20 G. Tomaiuolo, M. Barra,V. Preziosi, A. Cassinese, B. Rotoli and S. Guido, Lab Chip, 11, 449–454 (2011). 21 R. Zhao, J. F. Antaki, T. Naik, T. N. Bachman, M. V. Kameneva, and Z. J. Wu, Biorheology 43 (6) 747-65 (2006). 22 M. Kang, H. S. Ji, and K. C. Kim, Int. J. Biol. Bio-med. Eng. 1 (2) 1-8 (2008).
23 H. A. Barnes, A handbook of elementary rheology, (The University of Wales Institute of Non-Newtonian Fluid Mechanics, 2000).
24 D. F. James, G. M. Chandler, and S. J. Arnour, J. Non-Newton. Fluid. 35, 421-443 (1990). 25 P. C. Sousa, F. T. Pinho, M. S. N. Oliveira, and M. Alves, Biomicrofluidics 5, 014108 (2011). 26 S. S. Lee, Y. Yim, K. H. Ahn, and S. J. Lee, Biomed. Microdevices. 11, 1021 (2009).
27 M. S. N. Oliveira, M. A. Alves, F. T. Pinho, and G. H. McKinley, Exp. Fluids. 43, 437-451 (2007). 28 J. S. Park and H. I. Jung Anal. Chem. 81(20), 8280-8288 (2009).
29 M. D. Abramoff, P. J. Magalhães, and S. J. Ram, Biophotonics International 11, 36-42 (2004).
30 R. Lima, M. S. N. Oliveira, T. Ishikawa, H. Kaji, S. Tanaka, M. Nishizawa, and T. Yamaguchi, Biofabrication 1, 035005 (2009).
31 R. Lima, T. Ishikawa, Y. Imai, M. Takeda, S. Wada, and T. Yamaguchi, Ann. Biomed. Eng. 37, 1546 (2009). 32 E. Meijering, I. Smal, and G. Danuser, IEEE Signal Proc. Mag. 3, 46 (2006).
33 T. Omori, T. Ishikawa, Y. Imai, and T. Yamaguchi, J Biomech. 46 (3) 548-553 (2013). 34 T. Omori, Y. Imai, T. Yamaguchi, and T. Ishikawa, Phys. Rev. Lett. 108 138102 (2012). 35 E. A. Evans and Y.C. Fung, Microvasc. Res. 4 335-347 (1972).
36 R. M. Hochmuth and R.E. Waugh, Annu. Rev. Physiol. 49 209-219 (1987). 37 S. R. Keller and R. Skalak, J. Fluid. Mech. 120, 27-47 (1982).
38 J. G. G. Dobbe, M. R. Hardeman, G. J: Streekstra, J. Strackee, C. Ince, and C. A. Grimbergen, Blood. Cells. Mol. Dis. 28, 373-384 (2002).

