DIMENSIONAL STABILITY OF WOOD IN PRESENCE OF WATER
Débora Ferreira1(*), Cristiana Pinto1, Paula Borges1, Elza Fonseca1 1
Polytechnic Institute of Bragança (IPB), Bragança, Portugal (*)
ABSTRACT
An experimental program was defined aiming to evaluate the dimensional stability of hardwood and softwood species. The maritime pine softwood (Pinus pinaster) and the ash hardwood of the North-east region of Portugal are analysed. A group of thirty specimens were made for each species of wood. The experimental procedure has been conducted according to NP EN 614 and NP EN 615. For each wood species, one half of the specimens were previously dried while the other one half was prior saturated. Two main variables were studied in normal environmental conditions: mass and dimensional variation. Tests were conducted at 20ºC environment temperature and 60% of relative humidity. Measurements were taken allowing to quantify the dimensional variation suffered during the dry/saturation process for both species. The properties that define the behaviour of wood against temperature and moisture actions are assessed in this work. Hygroscopicity and shrinkage are given special attention.
hygroscopic, shrinkage, experimental evaluation, dimensional changes.
INTRODUCTION
Wood is the most significant raw material. It is important not only because it is used for literally hundreds of products, but also because it is a renewable natural resource. Through a careful and planned use, forests could provide a perpetual supply of wood. All wood in growing trees contains a considerable amount of water due to both photosynthesis and growing processes. This water is commonly called sap. In the wood’s drying process after harvest, the removal of free-water occurs first, with no change either in dimension or in physical and mechanical properties. At the state where no free-water is presented in the cell cavity and the cell wall is fully saturated with bounded water, the cell reaches the fiber-saturation point (MCfs). For practical purposes, this level of moisture content is generally considered around 25-30%, but it may be significantly different among wood species, (Simpson et. al., 1999). Wood is dimensionally stable when moisture content is greater than the fibre saturation point. Below MCfs, wood dimensions changes and it gains moisture (swells) or loses moisture (shrinks) in the form of bounded water. The level of MCfs depends on the relative humidity and temperature of the surrounding air. Shrinkage and swelling are the cause of many of the problems that can occur in wood both during drying and in use; therefore, a deep knowledge will help to minimize such problems. Splitting, warping, and open joints are examples of problems that can occur due to uneven shrinkage.
! "
dimension stability caused by variation of the relative humidity of the surrounding air. The moisture content relationship has an important influence on wood properties and performance (White et. al., 1999).
The main goal of this work is to study the water movement in wood: first of all, the drying process, which occurs before the manufacture and use as finished wood products, and secondly the gain and the loss of water in response to the changes in environmental conditions that surround the wood.
EXPERIMENTAL SETUP
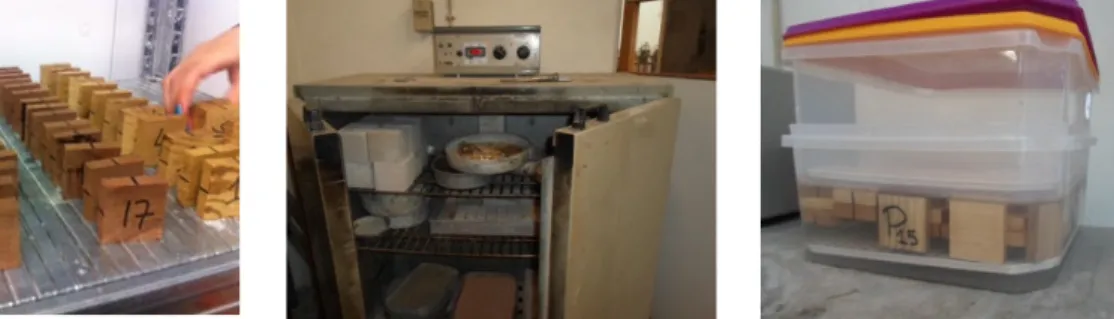
A total of 60 specimens were tested in order to assess shrinkage and swelling behaviours of the two woods species. The assumed geometry for the specimens is 40x40x10 mm (Fig.1), based on NP EN 614 recommendations. Before running the tests, one half of the specimens of each species were dried in an oven at 103ºC +/- 2ºC (Fig. 2), while the other one half was saturated in a water tank (Fig. 3) until a constant mass is attained. Mass is considered constant when the difference between two consecutive weight measurements, delayed 2 hours, is less than 0.5%. Table 1 resumes the specimens distribution and its denomination.
Fig. 1 – Specimens wood sections Fig. 2 - Dried specimens Fig. 3 – Saturated specimens
Table 1 - Specimens distribution and its denomination.
Wood species N. of Specimen Dried Denomination Saturate Denomination Softwood specie
Maritime Pine 30 15 DP 15 SP
Hardwood specie
Ash 30 15 DA 15 SA
Note: DP – Dried Pine; DA – Dried Ash; SP – Saturated Pine; SA – Saturated Ash
0 0,4 0,8 1,2 1,6 2 2,4
0 4 8 12 16 20 24
2
t
[%]
hours
1º DA 1º DP 2º DP 2º DA 3º DP 3º DA b)
-3,5 -3 -2,5 -2 -1,5 -1 -0,5 0 0,5
0 4 8 12 16 20 24
2
r[
%]
hours
1º SA 1º SP 2º SP
2º SA 3º SP 3º SA
c) -3 -2,5 -2 -1,5 -1 -0,5 0 0,5
0 4 8 12 16 20 24
2
t
[%]
hours
1º SA 1º SP 2º SP
2º SA 3º SP 3º SA
d) 0 0,4 0,8 1,2 1,6 2 2,4
0 4 8 12 16 20 24
2
r
[%]
hours
1º DA 1º DP 2º DP
2º DA 3º DP 3º DA a)
For all measurements, a calibrated dial gauge coupled to a steel base with a precision equal to 0,001 mm was used.
TEST RESULTS AND DISCUSSION
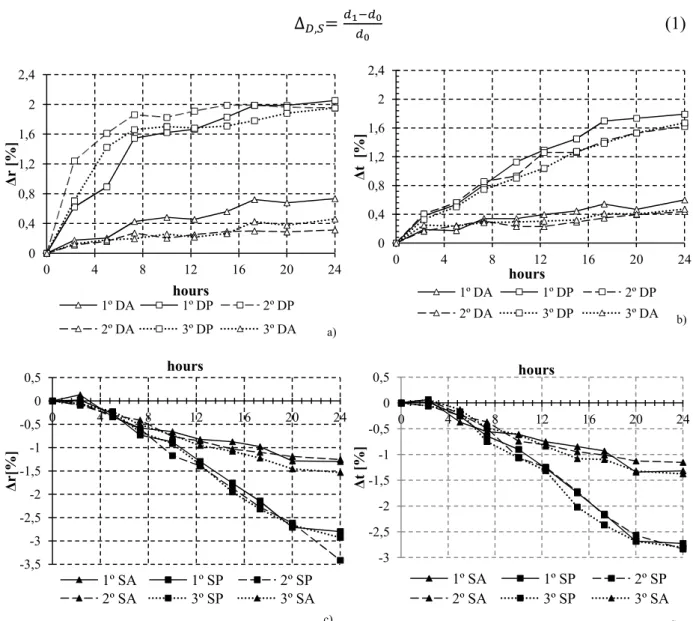
Fig. 4 illustrates the average dimensions variation values of shrinkage/swelling for saturated and dried specimens in radial and tangential directions (Dr and Dt, respectively) obtained in
the experimental program. The variation values were calculated from the equation 1, where d1
is the dried or saturated specimen dimension in radial or tangential direction at reading time,
and d0 is the radial or tangential dimension at the beginning of the test cycle.
∆ , = (1)
Fig. 4 - Dimensional variation in time in radial and tangential directions: a) dried specimens in radial direction; b) dried specimens in tangential direction; c) saturated specimens in radial direction; d) saturated specimens in tangential direction.
! "
-40 -30 -20 -10 0
0 4 8 12 16 20 24
2
W
[%]
hours
1º W SA 1º W SP 2º W SA
2º W SP 3º W SA 3º W SP
b) 0
2 4 6 8
0 4 8 12 16 20 24
2
W
[%]
hours
1º W DA 1º W DP 2º W DA
2º W DP 3º W DA 3º W DP
a)
show the same trend to being stable after the first 24 hours. Fig. 4 also shows that Maritime Pine demonstrates an oscillation at the end of stabilization period.
Also, for dried specimens, the ash wood presents a most stable behaviour (0,4%) when compared to pine wood specimens (about 2,0%), both in radial and tangential directions. Same conclusions can be drawn for saturated specimens. As shown, is identified a most stable behaviour for ash wood, which stabilizes at 1% while pine becomes stable at about 3%.
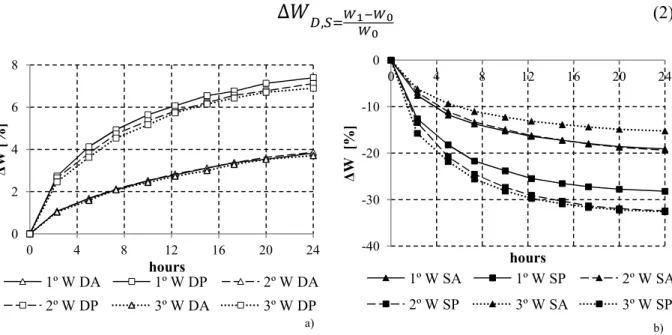
Therefore, it is possible to assess the weight loss of each specimen for the two wood species. Fig. 5 shows the average weight variation (DW) of saturated and dried specimens obtained in current experimental program. The variation values were calculated from the equation 2,
where W1 is the dried or saturated specimen weight at reading time and W0 is the weight at
the beginning of the test cycle.
∆
, (2)
Fig. 5 - Weight variation: a) dried specimens; b) saturated specimens.
From the analysis of Fig. 5 one can observe that for both dried species the mass has a linear behaviour, in the three cycles. The ash wood shows a most stable behaviour (4%) when compared to pine wood specimens (about 7,0%) and the mass stabilized after 20 hours. Similar conclusions can be drawn for saturated specimens, since ash wood exhibits a most stable behaviour (20%) when compared with pine (30%).
REFERENCES
NP-614:1973. Madeiras — Determinação do teor em água.
NP-615:1973. Madeiras — Determinação da retração.
Simpson, W., & TenWold, A. (1999). Physical properties and moisture relations. In F. P. Laboratory, Wood handbook—Wood as an engineering material (p. 463). Madison, WI: U.S: Department of Agriculture, Forest Service, Forest Products Laboratory.