Comparison of ibuprofen release from minitablets and capsules
containing ibuprofen:β-cyclodextrin complex
P.J. Salústio
a, H.M. Cabral-Marques
a, P.C. Costa
b, J.F. Pinto
a*a
Departamento de Tecnologia Farmacêutica, Faculdade de Farmácia da Universidade de Lisboa, Av. Prof. Gama Pinto, P-1649-003 Lisboa, Portugal
b Departamento de Tecnologia Farmacêutica, Faculdade de Farmácia da Universidade do Porto, Rua Aníbal Cunha
164, P-4050-047 Porto, Portugal
Running head: IB release from IBβCD complexes in solid dosage forms
*Corresponding author.
Faculdade de Farmácia da Universidade de Lisboa Av. Prof. Gama Pinto
P-1649 – 003 Lisboa
E-mail address: [email protected] Tel.: +351217946427
Abstract
Mixtures containing ibuprofen (IB) complexed with β-cyclodextrin (βCD) obtained by two complexation methods [suspension/solution (with water removed by air stream, spray- and freeze-drying) and kneading technique] were processed into pharmaceutical dosage forms (minitablets and capsules). Powders (IB, βCD and IBβCD) were characterized for moisture content, densities (true and bulk), angle of repose and Carr’s index, X-ray and NMR. 2.5 mm diameter minitablets and capsules were prepared from physical mixtures and IBβCD complexes without other excipients. Minitablets were characterized for the energy of compaction, tensile strength, friability, density and IB release (at pH 1.0 and 7.2), whereby capsules were characterized for IB release. The results from the release of IB were analyzed using different parameters, namely, the similarity factor (f2), the dissolution efficiency (DE) and the amounts released at a certain time (30, 60 and 180 min) and compared statistically (α = 0.05). The release of IB from the minitablets showed no dependency on the amount of water used in the formation of the complexes. Differences were due to the compaction force used or the presence of a shell, for the capsules. The differences observed were mostly due to the characteristics of the particles (dependent on the method considered on the formation of the complexes) and neither to the dosage form nor to the complex of the IB.
1. Introduction
Drugs to be therapeutically active must dissolve in body fluids and permeate membranes to travel to other body compartments. These processes are complex in nature and become even more complex when drugs present poor solubility in water. The biopharmaceutical classification system (BCS) [1] presents a systematic organization of drugs based on both solubility and permeability. For instance, ibuprofen, a common non-steroidal and anti-inflammatory drug (NSAD) belongs to the class II, i.e., permeate membranes but poorly soluble in water drug [2,3]. It follows that, an increase on the solubility in water is paramount to increase the dissolution rate of ibuprofen from solid dosage forms ‘transforming’ a class II into a class I drug presenting improved properties to be formulated thus, an easier and more obvious relationship between the drug’s properties and its therapeutic activity becomes possible.
There is a panoply of available techniques to improve the solubility of a drug, many of them by physical modification of particulate material. For instance, particle size reduction by milling [4] or micronisation [5] increase the specific surface area; modification of the structure of the particles by increasing the amorphous fraction [6] or modification of the polymorph type [7], promote a faster dissolution. The use of excipients such as surfactants [8], formation of physical complexes (e.g. use cyclodextrins) [9,10], dispersion of the drug in carriers (e.g. formation of enteric mixtures [11], solid dispersions [12]) and chemical modification (e.g. soluble prodrugs or salts [13]), also promote the dissolution of the drugs through their solubilisation.
The literature describes several techniques to form IB
β
CD complexes, namely co-precipitation [14], complexation in a slurry [15] complexation in paste [16], extrusion [17] and dry mixing [18]. In a previous study [19] it was described and characterised the formation of IBβ
CD complexes by two methods of preparation, followed by drying the materials by different techniques.The present study aims to study the compressibility and compactability of the different mixtures containing βCD complexes without the use of any additional excipient, to evaluate the influence of the compaction force on the release of the drug, to evaluate the influence of the characteristics of particles produced (which were dependent on both preparation and drying methods) on the release of the drug and to confirm that the amount of water used on the process of complexation did not affect the complex (by monitoring the release of the drug).
2. Materials and methods
2.1. Materials
The model drug chosen for this study was (±)-Ibuprofen 20/35, (racemic α-methyl-4-[2-methylpropyl] benzeneacetic acid, pKa 4.4, IB) (supplied by Capsifar, Portugal). For the preparation
of the solid dosage forms β-cyclodextrin (Wacker, Germany, βCD), lactose (Granulac 200 Meggle, Germany, LAC) and microcrystalline cellulose (Avicel PH 101, FMC Biopolymer, Ireland, MCC) were used. Hydroxypropylmethyl cellulose capsule shells (HPMC, nº3 shells, Qualicaps Europe, Spain) were considered instead of gelatine shells to prevent interferences of the later on ibuprofen quantification. Hydrochloric acid (pH 1.0) and phosphate buffer (pH 7.2) solutions were used as dissolution media [3].
2.2. Methods
In general, mixtures of powders containing the inclusion complexes were obtained by two methods of preparation of the complexes: (a) suspension/dissolution with different processes of drying (air stream [AS], spray-drying [SD], freeze-drying [FD] and (b) kneading [K]) [19].
2.2.1. Preparation and characterization of mixtures and inclusion complexes
All raw-materials used, were, if necessary, grounded in a mortar with a pestle and sieved (Resch, Germany): only fractions with particles below 250 µm were used. Table 1 summarizes the formulations for the mixtures considered in this study.
Table 1
Mixtures of powders containing ibuprofen.
Ibuprofen Preparation method Drying technique
IBLAC powder mix not applicable
IBMCC powder mix not applicable
IBβCD PM powder mix not applicable
IBβCD AS suspension/solution air stream
IBβCD K30 kneading (30% of water) stirring evaporation
IBβCD K70 kneading (70% of water) stirring evaporation
IBβCD SD suspension/solution spray-drying
IBβCD FD suspension/solution freeze-drying
2.2.1.1. Preparation of complexes from solutions/suspensions
The βCD was dissolved in an amount of water equivalent to its solubility (1.63 x 10⁻² M, at 25 ºC) and IB was added in a 1:1 stoichiometric ratio to βCD to produce 100 g of mixture [19]. The IB:βCD (suspension/solution) was shacken (250 rpm, magnetic stirrer) at 25 ± 1 ºC for a pre-determined time (10 h) [19]. The water of the each suspension/solution was removed by spray-drying (SD) (Büchi MiniSpray Dryer B-191, Switzerland: inlet air temperature 125 ºC, outlet air temperature 98 ºC, aspirator set at 100% and flow rate set at 2.3 ml/min), by freeze-drying (FD) (Christ Alpha 1-4, B. Braun Biotech International, Germany: samples were previously frozen at -20 ºC and then dried at 4.5-7.0 µbar for 48 hours) and drying by stream of air (AS) (room temperature, 21 ºC, for 7 days).
2.2.1.2. Preparation of complexes by kneading
The IB and βCD mixtures were mixed in a 1:1 stoichiometric ratio in flasks for 10 min (Fisher-Kendall Scientific Co, USA). Kneading (K) followed by addition of either 30% (K30) or 70% (K70) (w/w) of the water to the mixtures of the powders (at 4 ml/min) in a mortar and gridding the mass with a pestle. The water was removed by evaporation from the mixture by continuous agitation.
2.2.1.3. References mixtures
Physical mixture (PM) containing IB and βCD and the mixtures with diluents (LAC or MCC instead of βCD) were produced in tumble mixer for 10 min (Fisher-Kendall Scientific Co, USA).
All dried binary mixtures obtained in different processes were also sieved (250 µm, Resch, Germany) and, if necessary, gridded in a mortar with a pestle for the production of particles with less than 250 µm in diameter.
2.2.1.4. Characterization of the mixtures of powders
The physical mixture and mixtures of powders containing inclusion complexes have been characterized as in a previous study by nuclear magnetic resonance (NMR) and X-ray diffraction (XRPD) (see below) [19].
Quantification of the moisture content was performed on all mixtures and raw-materials in a moisture analyzer (Sartorius GmbH, Germany, at 100 ºC). A measuring cylinder (50 cm3) were used for the assessment of the bulk and tap densities (Stampfvolumeter, Germany) [20]. The Carr index (ICr) [21] was determined using the following equation:
100 0 × − = f f r D D D IC eq. 1
where, D0 is the initial bulk density and Df is the tap bulk density. The true density was determined by helium pycnometry (AccuPyc 1330, Micromeritics, USA). The flow properties of the powders were examined with an Erweka GT Granule tester (Erweka, Germany): powders were poured into a funnel and then allowed to pass through a nozzle of 15 mm diameter onto plate for 10 s. The angle of repose was found as the angle of the powder’s cone to the plate.
2.2.2. Preparation and characterization of the minitablets
Biconvex, 2.5 mm diameter minitablets (10 mg containing 1.54 mg IB) were prepared manually according to the formulations shown in Table I. The minitablets were produced at compaction forces of 3.0, 6.5 and 10.0 kN with an upper punch speed of 10 mm/min, using a universal mechanical press (Lloyd Instruments LR 50K, UK): both force and displacement of the punch were recorded for each run.
The minitablets were stored at room temperature (21 ºC) and 65% relative humidity, before characterization, after 1, 2 hours and 7 days after production. The height and diameter of the minitablets were determined using a micrometer (Thumb Clamp Vernier Calipers, China). Tensile
strength of the minitablets (
σ
t) was measured in a crushing tester (CT5, Engineering systems, UK) at a loading rate of 6.9 mm/min until they crushed. The tensile strength was calculated according to Fell and Newton [22]:Dh P
t
π
σ = 2 eq. 2
where, P is the force required to crush the minitablets (N), D and h (m) are the diameter and thickness of the minitablets, respectively. Friability was measured in a friabilator (Erweka-Apparatebau, GmbH, Germany) [3]. To assess the effect of pressure on the complexes at the molecular level, minitablets were evaluated by both NMR (solid state) and XRPD techniques.
The proton chemical shifts of internal βCD in the form of complex from powder mixtures (IBβCD AS and IBβCD FD) and their counterparts resulting from the grinding of the minitablets was recorded at 300 MHz (Bruker AVANCE Spectrometer III, Germany) with a high power emission (HP – 1 kW) and rotation magic angle (MAS – 15 kHz) in a high-resolution solid probe CP HPD-MAS-80 mm.
The particles crystal structure of the powder mixtures (IBβCD AS and IBβCD FD) and their counterparts resulting from the grinding of the minitablets was performed using a X-ray diffractometer (X-INEL) with a variable-geometry device equipped with a Max-Flux Optic graded multilayer monocromator (CuKα radiation) and a gas curved counter “INEL CPS 590” connected to a data acquisition computer-controlled system. The measurements were performed at room temperature (21 ºC).
In vitro dissolution tests were performed in a dissolution apparatus (Sotax model AT7, Switzerland) according to the paddle method (50 rpm) in a 1000 ml of hydrochloric acid solution (pH 1.0) or phosphate buffer (pH 7.2) at 37 ± 0.5 ºC [3]. The ibuprofen released was quantified spectrophotometrically with a UV/Vis spectrophotometer (U-2000, Hitachi, Japan) set at 221 nm, at predetermined times (10, 20, 30, 40, 60, 90, 120, 180 and 1440 min). The cumulative fraction of the drug released was calculated from the total amount of ibuprofen in the dissolution vessel and
plotted as a function of time. For the dissolution studies under sink conditions five weighted minitablets (50 mg, i.e., 7.69 mg IB) were placed in each vessel.
The data from the release of ibuprofen were analyzed using different dissolution parameters, namely, comparison of the amounts released at determined times (Mtmin), the dissolution efficiency (DE), the similarity factor (f2) [23] by considering the physical mixture (PM) as reference and the percentages of drug released at some time intervals. Dissolution data, at some time points (Mtmin) (30, 60 and 180 min) was compared statistically by ANOVA and by post-hoc Tukey test (SPSS Statistics 17.0, SPSS Inc., Chicago, USA), at α = 0.05 significance level.
2.2.3. Preparation and characterization of HPMC capsules
An accurate amount (50 mg, i.e., 7.69 mg IB) of each powder mixture (Table 1) was manually filled into the capsule body. The filled capsules were submitted to the dissolution test at 50 rpm under the same conditions as described above (one per vessel).
3. Results and discussion
3.1. Properties of the powders and references mixtures
The moisture content of the raw-materials varied significantly between them (Table 2, upper part) and, consequently, the binary mixtures reflected these differences, but without proportionality pattern showing that the product end-point was more related to the processes of drying and less to the raw-material water content (Table 2, middle part). The results have also shown that different drying techniques yielded different products with different moisture contents (Table 2, lower part). This should be taken into consideration because the residual water may affect the formation of the complex and tabletting of the mixtures of materials, as shown by Frӧmming and Szejtli [24] who identified the optimal βCD compressibility for a moisture content around 14% and suggested that this water can be regarded as little bounded to the solid raw materials. As discussed elsewhere, freeze- and spray-drying techniques were more efficient on drying than the others, but the residual water seems to be useful to improve the powders flow ability and compressibility (Table 2, ICr and
angle repose).
The morphology of the particles was also considered, as in a previous work [19]. The physical mixtures produced particles with sizes and shapes identical to the ones observed for the raw materials (electronic micrographs not shown). As an example, the physical mixture (IBβCD PM) is composed of rod-shaped particles (IB) and rectangular shaped (βCD) particles. For the other physical mixtures containing LAC or MCC, instead of βCD, the powders were composed of rod-shaped particles (IB), rough irregular particles (LAC) and irregular rod-shaped particles (MCC). On the other hand, the shape of the particles of powders produced in the presence of water became more spherical by opposition to the rod-shaped original particles, suggesting that new particles, such as complexes, were produced.
The bulk (D0) and tap (Df) densities (Table 2) have shown that the raw-materials IB and LAC exhibit higher inter-particle porosity than βCD and MCC. The values of βCD are largely in line with those presented in the literature (0.42-0.49 and 0.74-0.76 g/cm3 for the bulk and tapped densities, respectively) [24]. Looking at the powders processed, the formulations with a high inter-particle porosity were observed for powders prepared by FD followed by AS and SD. These observations reflect more the properties of the powders produced by these techniques, than due to the production of complexes themselves. As a consequence, the analysis of the results for the Carr’s index shows that low moisture contents produced higher compressibility and higher angles of repose of the materials. This suggests that the water had a binding effect by approaching particles (higher bulk and tap densities) and provided some lubrication (lower Carr’s index and angle of repose) to the particles, as their size was kept constant. Nevertheless, all materials have shown poor flow properties (Table 2). The Carr’s index and angle of repose observations were confirmed on the preparation of the minitablets and capsules: would their preparation had been different from manual and a glidant had to be added to the formulations. This was particularly relevant for the powders produced by spray or freeze-drying, which are described as amorphous with small and porous particles [24,25]. Looking at the true densities (expected and measured) the values for the raw materials are in agreement with the literature [19,26]. When the densities were considered for the processed materials, the measured true density is normally lower than the expected, reflecting some degree of porosity in the new structures. However, the IBβCD SD and IBβCD FD have shown higher densities suggesting new particles have been formed which were different from the original (Table 2, lower part). This must be related to the process of drying the materials, whereby the removal of water must have contributed to approaching particles and promoting the formation of bonds between them.
Table 2
Moisture content, bulk and tap densities, compressibility index, porosity, angle of repose and true density (expected and experimental) for all mixtures a).
3.2. Minitablets
3.2.1. Compaction profiles
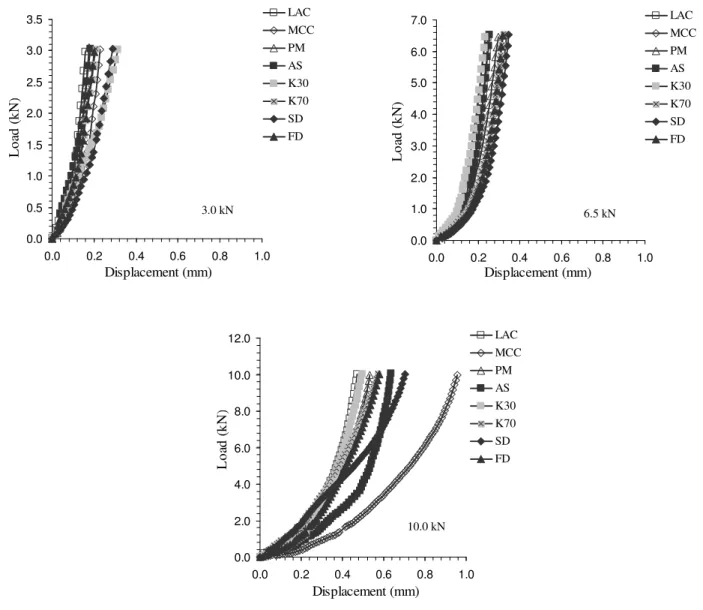
The compaction profiles obtained when low forces were applied to the mixtures (3.0 and 6.5 kN) did not show significant differences although a slight shift for higher displacements was observed for the 6.5 kN load. This shift was further emphasized when the materials were compacted at 10.0 kN (Table 3, upper part and Fig. 1). As anticipated, higher the compaction forces applied, higher the energies absorbed by the materials, although differently. For instance, IBMCC has shown a delayed increase in force due to a higher repacking and plastic deformation of MCC. The IBβCD AS, IBβCD SD and IBβCD FD approached the IBMCC profile suggesting that these materials properties resemble the later one [27]. Fragmentation on repacking of particles under pressure can also be considered on explaining the higher energy absorbed [28] (Table 3).
Moisture (%) D0 (g/cm3) Df (g/cm3) ICr (%) Angle of repose (º) ρ (g/cm3) expected ρ (g/cm3) measured Raw-materials IB 1.55 0.29 0.51 43.0 57.17 - 1.12 βCD 16.46 0.54 0.75 28.0 47.80 - 1.48 LAC 2.95 0.53 0.89 41.0 51.53 - 1.55 MCC 10.07 0.33 0.47 31.0 47.43 - 1.56 Mixtures with IB IBLAC 5.93 0.55 0.85 36.0 49.40 1.46 1.46 IBMCC 8.34 0.35 0.51 31.0 54.50 1.49 1.50 IBβCD PM 13.59 0.55 0.51 26.0 44.70 1.42 1.41 IBβCD AS 9.66 0.37 0.59 38.0 51.77 1.42 1.42 IBβCD K30 15.38 0.54 0.78 31.0 44.97 1.42 1.40 IBβCD K70 15.64 0.51 0.74 31.0 49.93 1.42 1.41 IBβCD SD 7.81 0.29 0.47 37.0 56.30 1.42 1.44 IBβCD FD 6.78 0.22 0.39 44.0 58.47 1.42 1.48
a)results are the mean of 3 measurements (n = 3). The coefficient of variation to the mean was below 1% for all cases.
Fig. 1. Compaction profiles for each force applied.
3.2.2. Elastic recovery
All minitablets produced from the different mixtures failed to show significant axial recovery throughout the period of the test, i.e., elastic recovery of the materials was either inexistent or negligible emphasizing the fact that modifications under compaction were mostly due to repacking, breakage and plastic deformation of the materials.
3.2.3. Tensile strength and friability
The Table 3 (middle part, tensile strength) shows the influence of the compaction force and formulation on the tensile strength of the minitablets. It is clear that an increase in the force was reflected on an increase on the tensile strength. However, the increase was not continuous and a threshold must exist between 3.0 and 6.5 kN, since the tensile strength for the lowest force is low. Considering the binary mixtures, minitablets made MCC have shown the highest tensile strength as suspected, but minitablets made from spray or freeze-dried materials have also shown high tensile strengths. One can find different explanations to these observations. On one hand, MCC is one of the best tabletting materials, on the other hand the SD and FD materials are the ones showing the largest ratio between the true and bulk densities suggesting a porous structure due to the process of drying, which under pressure can deform, allowing particles to bind to each other in a stronger way than particles prepared differently.
6.5 kN 0.0 1.0 2.0 3.0 4.0 5.0 6.0 7.0 0.0 0.2 0.4 0.6 0.8 1.0 Displacement (mm) L o ad ( k N ) LAC MCC PM AS K30 K70 SD FD 10.0 kN 0.0 2.0 4.0 6.0 8.0 10.0 12.0 0.0 0.2 0.4 0.6 0.8 1.0 Displacement (mm) L o ad ( k N ) LAC MCC PM AS K30 K70 SD FD 3.0 kN 0.0 0.5 1.0 1.5 2.0 2.5 3.0 3.5 0.0 0.2 0.4 0.6 0.8 1.0 Displacement (mm) L o ad ( k N ) LAC MCC PM AS K30 K70 SD FD
The increase in compaction force promotes a higher deformation and fragmentation of particles leading to an increase in their surface areas, thus providing a greater contact between them with the establishment of a larger number and stronger bonds resulting in minitablets with high tensile strengths [25,29]. In the present work, this principle was not observed for all systems, suggesting that some can accommodate the force without increasing the bonds (number and strength) between the particles due to differences on their surfaces. In general, the powders produced in the presence of water have provided minitablets with higher strength, particularly when compared with IBβCD PM. Again, this suggests that residual water or new particles formed made a contribution to this outcome.
Table 3 (lower part, friability) shows the results for the friability of the different minitablets. High differences are observed and often difficult to explain, even when we assume that friability is difficult to correlate with other properties. The various moisture contents, the different compaction forces and absence of any additional excipient will be the likely explanation for these random values. In general, the increase of the compaction force produced less friable minitablets, although, this increase in load also caused capping or lamination to some minitablets, which influenced the results.
Table 3
Physical properties of minitablets a)
Work of compaction AUC (J)
3.0 kN 6.5 kN 10.0 kN IBLAC 0.16 0.45 1.41 IBMCC 0.24 0.62 2.85 IBβCD PM 0.17 0.60 1.67 IBβCD AS 0.23 0.50 1.79 IBβCD K30 0.39 0.51 1.41 IBβCD K70 0.24 0.59 2.05 IBβCD SD 0.27 0.63 2.82 IBβCD FD 0.26 0.54 1.94 Friability f (%) 3.0 kN 6.5 kN 10.0 kN IBLAC 17.31 14.74 14.82 IBMCC 4.73 5.52 0.28 IBβCD PM 9.43 1.33 2.84 IBβCD AS 3.62 4.55 3.69 IBβCD K30 16.26 8.59 2.75 IBβCD K70 4.08 6.21 8.94 IBβCD SD 4.92 10.69 5.05
Tensile strength σt (MPa)
3.0 kN 6.5 kN 10.0 kN IBLAC 0.14 0.41 0.56 IBMCC 0.24 3.37 3.42 IBβCD PM 0.19 1.77 1.77 IBβCD AS 0.17 1.87 1.99 IBβCD K30 0.16 1.72 1.46 IBβCD K70 0.15 1.53 2.27 IBβCD SD 0.21 2.96 3.87 IBβCD FD 0.25 2.71 2.72
3.2.4. Solid state nuclear magnetic resonance (MAS-HP-NMR)
Fig. 2 shows the different spectra obtained from the different powder mixtures and minitablets. The results have shown that the process compaction did not cause any changes in the molecular structures of the components of the powders mixtures analysed, as observed by the absence of chemical shifts in the proton. In fact, the spectra for the various mixtures was identical to the one of the respective raw materials. The differences observed in the height of the peak at the centre are related to the residual water in the existing powder; the powder mixture obtained by removing water by air stream showed a much more pronounced peak (related to water protons) than the mixtures obtained by removing water by freeze-drying. This difference proved the existence of different moisture contents in the mixture as mentioned previously [30].
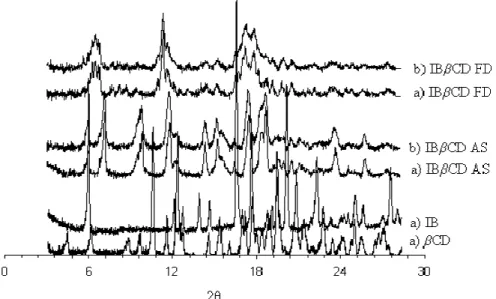
Fig. 2. Solid state NMR spectra. a) powder mixtures and b) grounded minitablets.
3.2.5. X – Ray diffractometry (XRD)
Fig. 3 shows the X-ray diffraction patterns obtained from mixtures of raw materials and minitablets. Comparison of the two diffraction patterns (a) and (b) for each formulation, shows their similarity with almost complete overlapping. These results demonstrate that compaction of mixtures did not alter the materials crystallinity. The diffraction patterns of the two formulations showed a new peak when compared to the diffraction patterns of the raw materials, which suggests the presence of a new entity, inclusion complex IBβCD, as described previously [19].
3.2.6. Dissolution tests
3.2.6.1. pH 1.0
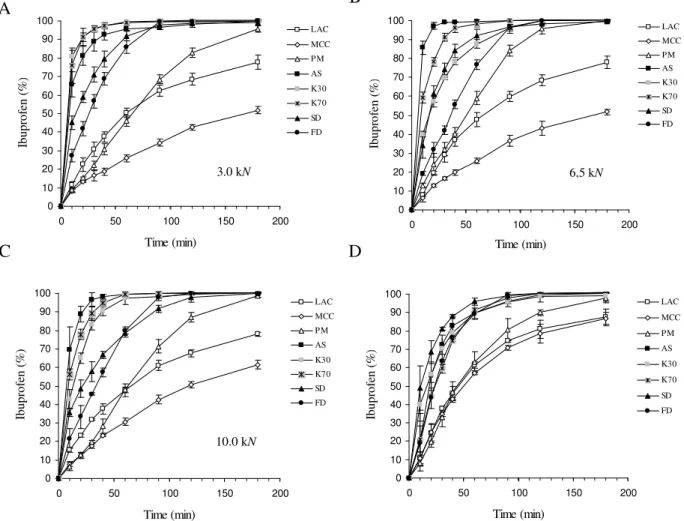
At pH 1, different compaction forces applied to the powders did not affect the release of IB for the same formulations (Fig. 4), suggesting that the materials were able to accommodate the increasing forces applied. On the other hand, a distinctive difference on IB release between minitablets prepared by mixing the components (LAC, MCC, βCD) and those produced from IBβCD complexes can be observed. A faster release of IB from minitablets was due to the presence of IBβCD complexes. A finer analysis of the results shows that, when low forces were applied to the complexes (3.0 kN to the minitablets or filling the capsules) a difference between the complexed and no complexed IB was observed. However, when the force applied to the powders increased, complexes produced from FD and SD powders have shown a delay on releasing the drug. This might have been done to the structure of the particles, namely, specific surface area, porosity or balance between amorphous and crystalline fractions of materials, as discussed by other authors [25,27,28] and, consequently, different behaviours upon compaction.
Fig. 4. Dissolution profiles of IB (at pH 1.0) released from minitablets prepared under different compaction forces (A-C) and from capsules (D).
Table 4 resumes the data produced from the dissolution tests when analysed for Mtmin, DE and
f2 for minitablets (compacted at 3.0 and 10.0 kN) and capsules. The fractions of IB released at certain times (M) (30, 60 and 180 min) from the various formulations of minitablets showed higher
10.0 kN 0 10 20 30 40 50 60 70 80 90 100 0 50 100 150 200 Time (min) Ib u p ro fe n ( % ) LAC MCC PM AS K30 K70 SD FD 6,5 kN 0 10 20 30 40 50 60 70 80 90 100 0 50 100 150 200 Time (min) Ib u p ro fe n ( % ) LAC MCC PM AS K30 K70 SD FD 3.0 kN 0 10 20 30 40 50 60 70 80 90 100 0 50 100 150 200 Time (min) Ib u p ro fe n ( % ) LAC MCC PM AS K30 K70 SD FD C 0 10 20 30 40 50 60 70 80 90 100 0 50 100 150 200 Time (min) Ib u p ro fe n ( % ) LAC MCC PM AS K30 K70 SD FD D B A
can be explained based on the fact that complexation also might have occurred during the test of dissolution which is acceptable due the existence of free βCD and IB and consequently a higher solubility is obtained for the drug when in a complex form [28]. For the others two references (IBMCC and IBLAC) due to the absence of the βCD in the dissolution medium, the dissolution of IB was low, particularly when MCC was present, suggesting a controlled release effect over the IB release.
The values for the DE of the minitablets obtained from formulations containing complexes were similar at 180 min. The differences observed at 30 and 60 min for the SD and FD minitablets resulted from the different characteristics of the particles, which were dependent on the complexation methods and various drying processes, as discussed by other authors [27,29]. These minitablets have also shown higher tensile strengths that may also explain this difference [29]. The mechanical properties of the reference minitablets also contributed to the lower values of DE, particularly for the ones containing MCC. Differences between minitablets were emphasized when the f2 test was applied to each profile and compared to the one produced from the PM, where the f2 values were well below 50 for the majority of the cases.
Statistical analysis of the results has shown that IB released from AS, K30, K70 and FD, minitablets and capsules, was not significantly different between them. Other techniques did show differences. This suggests that the amount of water was not relevant for the formation of the complex, i.e., complexes can be formed with small amounts of water present (e.g. kneading). It must be pointed out that at pH 1.0, IB is practically insoluble in water, thus the presence of βCD increases the dissolution rate dramatically. For all cases, the complete release of IB was reached within 1440 min.
Table 4
a) Dissolution parameters from IB minitablets at pH 1.0 (3.0 kN).
b) Dissolution parameters from IB minitablets at pH 1.0 (10.0 kN).
c) Dissolution parameters for IB released from capsules (pH 1.0).
Mtmin (%) ª) DE (%) f2(%) 30 60 180 30 60 180 IBLAC 37.85 ± 1.03 61.47 ± 1.71 87.39 ± 4.39 17.99 33.92 63.66 60.94 IBMCC 34.66 ±1.19 57.24 ± 1.11 86.86 ± 3.11 17.67 31.98 61.33 56.38 IBβCD PM 33.07± 5.02 63.02 ± 5.60 97.88 ± 2.39 14.86 32.36 68.32 (100.00) IBβCD AS 72.69 ± 5.11 89.73 ± 3.01 100.62 ± 0.06 37.37 60.43 85.30 29.31 IBβCD K30 70.25 ± 5.89 89.72 ± 3.46 99.00 ± 2.84 43.80 62.43 85.43 28.52 IBβCD K70 59.52 ± 2.30 91.33 ± 0.81 100.68 ± 0.05 31.81 54.76 84.05 34.02 IBβCD SD 81.09 ± 0.99 95.96 ± 2.09 100.77 ± 0.06 52.68 71.12 90.16 23.01 IBβCD FD 63.51 ± 1.37 89.39 ± 0.82 100.56 ± 0.29 31.48 55.01 84.17 33.52 a) mean ± sd (n = 3) 3.2.6.2. pH 7.2
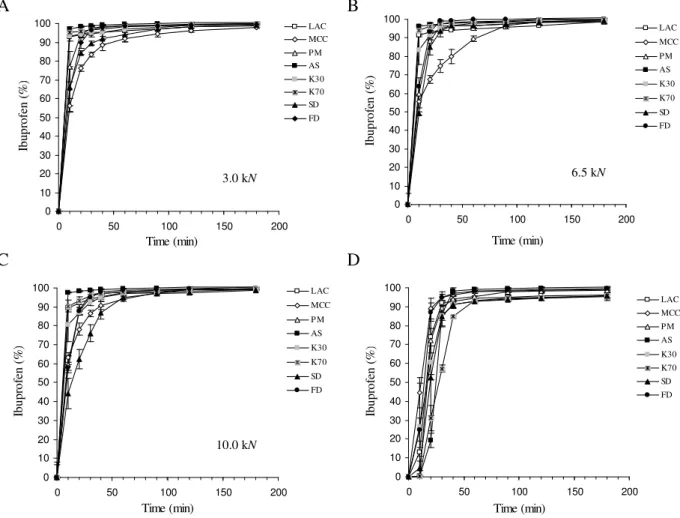
The dissolution profiles for IB released from the minitablets and capsules at pH 7.2 are shown in Fig. 5. At pH 7.2 no significant differences between the releases of IB from the different minitablets were observed due to the high solubility of IB in the dissolution medium with the exception of IBMCC due to a controlled release effect of the later (Table 5, Fig. 5). At this pH, the
Mtmin (%) ª) DE (%) f2 (%) 30 60 180 30 60 180 IB LAC 30.75 ± 3.81 50.57 ± 2.55 77.78 ± 3.71 16.47 28.59 54.26 50.44 IB MCC 16.50 ± 2.67 25.93 ± 2.03 51.89 ± 1.96 10.00 15.37 32.29 29.47 IBβCD PM 22.09 ± 2.24 46.04 ± 2.89 95.58 ± 1.77 11.69 23.04 59.59 (100.00) IBβCD AS 89.07 ± 5.30 95.79 ± 1.45 99.89 ± 0.25 63.91 78.56 91.45 15.33 IBβCD K30 95.79 ± 1.71 99.67 ± 0.09 100.56 ± 0.09 73.33 85.65 95.34 12.60 IBβCD K70 95.81 ± 1.25 99.09 ± 0.45 100.20 ± 0.18 71.71 84.66 94.76 12.96 IBβCD SD 70.99 ± 4.10 92.09 ± 2.78 99.12 ± 1.81 46.47 64.35 86.64 21.31 IBβCD FD 56.67 ± 3.61 85.75 ± 3.39 100.21 ± 0.55 32.56 52.51 82.84 27.17 Mtmin (%) ª) DE (%) f2 (%) 30 60 180 30 60 180 IBLAC 31.87 ± 0.48 47.55 ± 3.41 77.90 ± 1.11 18.21 29.10 53.78 44.39 IBMCC 17.71 ± 1.45 30.66 ± 2.09 61.49 ± 2.30 9.70 17.26 38.32 32.87 IBβCD PM 19.70 ± 0.84 47.96 ± 1.61 98.75 ± 0.98 9.74 21.60 61.30 (100.00) IBβCD AS 96.64 ± 3.70 99.51 ± 0.34 100.39 ± 0.35 68.94 83.67 94.57 12.98 IBβCD K30 83.20 ± 3.08 97.40 ± 3.36 100.40 ± 0.01 49.83 70.77 85.67 17.94 IBβCD K70 89.07 ± 3.56 99.54 ± 0.16 100.53 ± 0.03 59.47 77.51 92.60 15.27 IBβCD SD 57.74 ± 5.30 78.52 ± 2.21 100.21 ± 0.15 37.65 53.41 80.78 27.24 IBβCD FD 45.69 ± 0.60 80.01 ± 1.77 100.50 ± 0.54 25.89 44.42 79.61 32.30
occurred mostly due to the characteristics of the particles which were dependent on both the complexation methods and the different processes of drying [27,28].
Fig. 5. Dissolution profiles of IB (at pH 7.2) released from minitablets prepared under different compaction forces (A-C) and from the capsules (D).
The DE values for minitablets obtained from all formulations are similar at times 30, 60 and 180 min with the value for the last time close to 100%. Some differences observed were caused by a delay on the disintegration of minitablets and/or due to the different characteristic of particles [27,30].
The increase on pH led to a higher similarity between dissolution profiles produced from the different minitablets. That was reflected on the f2 parameter with values close to 50, the threshold for similarity after comparison of the different profiles with the one produced from the physical mixture.The release from all minitablets corresponding to different formulations reached 100% at approximately 180 min. The statistical analysis between the results of the fractions of IB released has shown that no significant differences were observed at the different times.
The release of IB from capsules was mostly dependent on the disintegration of the shell than on the powders (Table 5, Fig. 5), if one disregards the lag time, the release of IB becomes identical between formulations and comparable to the minitablets produced at 3.0 kN. The results for DE and
f2 were in agreement with the results discussed previously. Differences on DE and f2 values are mostly due to the lag time observed for the disintegration of the capsule shell and some adherence of the powder mixture to the internal surface of the shell’s walls, as observed visually.
6.5 kN 0 10 20 30 40 50 60 70 80 90 100 0 50 100 150 200 Time (min) Ib u p ro fe n ( % ) LAC MCC PM AS K30 K70 SD FD 3.0 kN 0 10 20 30 40 50 60 70 80 90 100 0 50 100 150 200 Time (min) Ib u p ro fe n ( % ) LAC MCC PM AS K30 K70 SD FD 10.0 kN 0 10 20 30 40 50 60 70 80 90 100 0 50 100 150 200 Time (min) Ib u p ro fe n ( % ) LAC MCC P M AS K30 K70 SD FD 0 10 20 30 40 50 60 70 80 90 100 0 50 100 150 200 Time (min) Ib u p ro fe n ( % ) LAC MCC PM AS K30 K70 SD FD B C D A
Table 5
a) Dissolution parameters observed for the minitablets at pH 7.2 (3.0 kN).
Mtmin (%) ª) DE (%) f2(%) 30 60 180 30 60 180 IBLAC 94.62 ± 1.87 96.31 ± 2.69 98.73 ± 1.33 78.14 86.81 94.20 60.89 IBMCC 83.34 ± 1.17 91.94 ± 1.89 97.96 ± 0.59 58.07 73.42 88.31 46.12 IBβCD PM 97.51 ± 0.35 98.70 ± 0.98 99.94 ± 0.70 73.33 85.84 94.97 (100.00) IBβCD AS 98.91 ± 0.12 99.60 ± 0.04 100.57 ± 0.14 81.51 90.42 96.94 56.94 IBβCD K30 95.14 ± 2.20 96.93 ± 1.62 99.89 ± 0.07 78.41 87.14 94.81 60.98 IBβCD K70 96.42 ± 1.72 98.28 ± 0.82 99.89 ± 0.09 79.70 88.51 95.54 84.24 IBβCD SD 89.54 ± 1.05 94.24 ± 3.88 99.15 ± 0.47 64.98 78.67 91.38 48.60 IBβCD FD 96.72 ± 1.71 98.58 ± 0.22 99.72 ± 0.20 67.81 82.88 93.75 66.86
b) Dissolution parameters observed for the minitablets at pH 7.2 (10.0 kN).
Mtmin (%) ª) DE (%) f2 (%) 30 60 180 30 60 180 IBLAC 93.90 ± 1.14 97.27 ± 0.99 99.70 ± 0.41 76.13 85.91 94.51 48.32 IBMCC 86.51 ± 1.71 94.29 ± 1.35 99.43 ± 0.28 61.57 76.40 90.86 61.20 IBβCD PM 96.58 ± 1.26 98.10 ± 0.66 99.37 ± 0.62 65.41 81.42 93.08 (100.00) IBβCD AS 98.86 ± 0.27 99.63 ± 0.07 100.52 ± 0.07 81.79 90.57 96.95 42.67 IBβCD K30 92.43 ± 1.73 97.00 ± 0.54 99.02 ± 0.34 71.27 83.22 93.10 55.53 IBβCD K70 95.82 ± 0.75 97.71 ± 0.96 99.65 ± 0.53 77.21 87.13 95.01 47.75 IBβCD SD 76.07 ± 5.04 94.77 ± 3.29 98.79 ± 0.92 48.26 67.99 87.57 48.60 IBβCD FD 94.95 ± 1.95 98.70 ± 0.70 100.39 ± 0.07 64.36 80.96 93.38 92.47
c) Dissolution parameters used Ibuprofen capsules at pH 7.2.
Mtmin (%) ª) DE (%) f2 (%) 30 60 180 30 60 180 IBLAC 92.08 ± 1.32 94.47 ± 1.17 96.19 ± 1.42 44.36 68.86 86.64 65.03 IBMCC 95.01 ± 1.76 97.93 ± 0.81 99.10 ± 1.06 60.32 78.47 91.96 38.67 IBβCD PM 89.62 ± 3.50 95.36 ± 2.02 98.76 ± 1.22 39.17 66.45 87.45 (100.00) IBβCD AS 86.09 ± 6.86 99.04 ± 1.04 100.42 ± 0.21 20.92 58.70 86.19 36.18 IBβCD K30 85.15 ± 5.33 93.02 ± 0.46 95.51 ± 1.05 43.18 66.99 85.35 48.75 IBβCD K70 57.21 ± 1.89 93.38 ± 0.89 95.93 ± 1.61 20.04 51.53 80.43 36.09 IBβCD SD 84.93 ± 2.11 92.81 ± 1.24 95.84 ± 2.74 33.26 61.97 83.60 55.32 IBβCD FD 94.83 ± 3.21 98.24 ± 1.16 99.77 ± 0.63 53.13 75.12 91.04 49.02 a) mean ± sd (n = 3)
4. Conclusions
The work has confirmed that inclusion complexes between a model drug, ibuprofen and β-cyclodextrin was possible and that such complexes remained stable when particles were submitted to compaction forces, namely the crystalline state and the molecular structure of both chemical entities. Particles of the complex have shown a distinctive morphology from the ones observed in the raw materials.
The complex can be formed with different amounts of water: from small amounts (30%, w/w) to a solution, remaining stable after drying. Further, the presence of both drug and cyclodextrin as a physical mixture can produce a complex when placed in a water bath, such as a dissolution medium. All mixtures of powder have shown poor flow abilities (Carr’s index and angle of repose), implying that glidants must be added to these powders to enable their processability. The method of complexation and the final drying were critical to the flow behavior of the powders, because they have affected the characteristics of the particles of the complex, but not the complex itself.
The different powders considered did not show elastic recovery after tabletting, but repacking, breakage and plastic deformation must have occurred in the process of minitablet formation. The particles produced from spray- and freeze-drying techniques did produce minitablets with higher tensile strengths. In fact, it was possible to use cyclodextrin as a diluent (PM) or as a complexforming agent (AS, K30, K70, SD and FD).
Dissolution tests confirmed the increase in the IB dissolution rate. The formation of a complex by the different methods had a higher impact on the dissolution of IB from either minitablets or capsules. Comparison of the dissolution profiles and dissolution parameters (Mtmin, DE and f2) has shown that the effect of the complex on the release of ibuprofen was more evident at low pH (low solubility in water). In this case, fast and complete release of the drug was achieved in few minutes (30 min) compared to the long time release observed with the mixtures of ibuprofen without cyclodextrin.
Acknowledgments
S. Henriques, F. Gonçalves and C. Santos are acknowledged for their technical assistance on this work.
References
[1] G.L. Amidon, H. Lennernas, V.P. Shah, J.R. Crison, A theoretical basis for a biopharmaceutic drug classification: the correlation of in vitro drug product dissolution and in vivo bioavailability, Pharm. Res. 12 (1995) 413–420.
[2] J.M. Custodio, C.-Y. Wu, L.Z. Benet, Predicting drug disposition absorption/ elimination/transporter interplay and the role of food on drug absorption, Adv. Drug Deliv. Rev. 60 (2008) 717–733.
[3] European Pharmacopoeia, Council of Europe, Strasbourg, France, 2008.
[4] W.K. Ng, J.W. Kwek, A. Yuen, C.L. Tan, R. Tan, Effect of milling on DSC thermogram of excipient adipic acid, AAPS PharmSciTech. 11 (2010) 159–167.
[5] R. Talari, J. Varshosaz, S.A. Mostafavi, A. Nokhodchi, Glicazide microcrystals prepared by two methods of in situ micronization: pharmacokinetic studies in diabetic and normal rats, AAPS PharmSciTech. 11 (2010) 786–792.
[6] D. Engers, J. Teng, J. Jimenez-Novoa, P. Gent, S. Hossack, C. Campbell, J. Thomson, I. Ivanisevic, A. Templeton, S. Byrn, A. Newman, A solid-state approach to enable early development compounds: selection and animal bioavailability studies of itraconazole amorphous solid dispersion, J. Pharm. Sci. 99 (2010) 3901–3922.
[7] D. Khamar, L. Seton, I. Bradshaw, Generation and characterization of new anhydrous polymorph of theophylline, J. Pharm. Pharmacol. 62 (2010) 1333–1334.
[8] C. Rupp, H. Steckel, B.W. Muller, Solubilization of poorly water-soluble drugs by mixed micelles based on hydrogenated phosphatidylcholine, Int. J. Pharm.
395 (2010) 272–280.
[9] M.E. Brewster, T. Loftsson, Cyclodextrins as pharmaceutical solubilizers, Adv. Drug Deliv. Rev. 59 (2007) 645– 666.
[10] E.M. Martin Del Valle, Cyclodextrins and their uses: a review, Process Biochem. 39 (2004) 1033–1046.
[11] S. Yamamura, J.A. Rogers, Characterization and dissolution behavior of nifedipine and phosphatidylcholine binary systems, Int. J. Pharm. 130 (1996) 65–73.
[12] J.R.K. Reddy, C.M. Chetty, Enhancement of solubility of nateglinide by solid dispersion technique, J. Pharm. Pharmacol. 62 (2010) 1330–1331.
[13] S.S. Dhareshwar, V.J. Stella, A novel prodrug strategy for beta-dicarbonyl carbon acids: syntheses and evaluation of the physicochemical characteristics of C-phosphoryloxymethyl (POM) and phosphoryloxymethyloxymethyl (POMOM) prodrug derivatives, J. Pharm. Sci. 99 (2010) 2711–2723.
[14] N.P. Sapkal, V.A. Kilor, K.P. Bhusari, A.S. Daud, Evaluation of some methods for preparing glicazide beta-cyclodextrin inclusion complexes, Tropical J. Pharm. Res. 6 (2007) 833–840.
[15] J. Fages, E. Rodier, A. Chamayou, M. Baron, Comparative study of two processes to improve the bioavailability of an active pharmaceutical ingredient: kneading and supercritical technology, Kona-powder part 25 (2007) 217–229. [16] A. Gil, A. Chamayou, E. Leverd, J. Bougaret, M. Baron, G. Couarraze, Evolution of the interaction of a new chemical entity, eflucimibe, with gamma-cyclodextrin during kneading process, Eur. J. Pharm. Sci. 23 (2004) 123–129. [17] H. Yano, P. Kleinebudde, Improvement of dissolution behavior for poorly water-soluble dug by application of cyclodextrin in extrusion process: comparison between melt extrusion and wet extrusion, AAPS PharmSciTech. 11 (2010) 885–893.
[18] T. Higashi, K. Nishimura, A. Yoshimatsu, H. Ikeda, K. Arima, K. Motoyama, F. Hirayama, K. Uekama, H. Arima, Preparation of four types coenzyme Q10/ gamma-cyclodextrin supramolecular complexes and comparison of their pharmaceutical properties, Chem. Pharm. Bull. 57 (2009) 965–970.
[19] P.J. Salústio, G. Feio, J.L. Figueirinhas, J.F. Pinto, H.M. Cabral-Marques, Theinfluence of the preparation methods on the inclusion of model drugs in a β-cyclodextrin cavity, Eur. J. Pharm. Biopharm. 71 (2009) 377–386.
[20] L.A. Miller, R.L. Carrier, I. Ahmed, Practical considerations in development of solid dosage forms that contain cyclodextrin, J. Pharm. Sci. 96 (2007) 1691–1707.
[21] R.L. Carr, Evaluating flow properties of solids, Chem. Eng. 18 (1965) 163–168.
[22] J.T. Fell, J.M. Newton, Assessment of compression characteristics of powders, J. Pharm. Sci. 60 (1971) 1428– 1429.
[23] Guidance for Industry, Dissolution Testing of Immediate Release Solid Oral Dosage Forms. US Department of Health and Human Services. Food and Drug Administration. Center for Drug Evaluation and Research (CDER), August, 1997. <http://www.fda.gov/cder/guidance/index.htm> (accessed 18.10.10).
[24] K.–H. Frömming, J. Szejtli, Cyclodextrins in Pharmacy, Kluwer Academic Publishers, Dordrecht, 1994.
[25] J. Berggren, G. Frenning, G. Alderborn, Compression behaviour and tablet forming ability of spray-dried amorphous composite particles, Eur. J. Pharm. Sci. 22 (2004) 191–200.
[26] J.-S. Wu, H.-O. Ho, M.-T. Sheu, Influence of wet granulation and lubrication on the powder and tableting properties of codried product of microcrystalline cellulose with β-cyclodextrin, Eur. J. Pharm. Biopharm. 51 (2001) 63– 69.
[27] M. Cirri, C. Rangoni, F. Maestrelli, G. Corti, P. Mura, Development of fast dissolving tablets of flurbiprofen– cyclodextrin complexes, Drug Dev. Ind. Pharm. 31 (2005) 697–707.