UNIVERSIDADE DO ALGARVE
Acoustic communication in the painted
goby Pomatoschistus pictus: temperature
dependence of male courtship sounds and
their role in female mate choice
Joana Rodrigues Vicente
Dissertation for the obtainment of Master Degree in
Marine Biology
Project realized under the orientation of:
PhD Paulo J. Fonseca and PhD Teresa I. M. Modesto
UNIVERSIDADE DO ALGARVE
Acoustic communication in the painted
goby Pomatoschistus pictus: temperature
dependence of male courtship sounds and
their role in female mate choice
Joana Rodrigues Vicente
Dissertation for the obtainment of Master Degree in
Marine Biology
Acoustic communication in the painted
goby Pomatoschistus pictus: temperature
dependence of male courtship sounds and
their role in female mate choice
Declaração de autoria de trabalho:
Declaro ser a autora deste trabalho, que é original e inédito.
Autores e trabalhos consultados estão devidamente citados e
constam da listagem de referências incluída.
Copyright©
A Universidade do Algarve tem o direito, perpétuo e sem limites
geográficos, de arquivar e publicitar este trabalho através de
exemplares impressos reproduzidos em papel ou de forma digital,
ou por qualquer outro meio conhecido ou que venha a ser
inventado, de o divulgar através de repositórios científicos e de
admitir a sua cópia e distribuição com objectivos educacionais ou
de investigação, não comerciais, desde que seja dado crédito ao
autor e editor.
Acknowledgments
My first and sincere thank you goes to Paulo Fonseca, my advisor, for helping me with most practical questions setup assemblage and software. For the enthusiasm showed each obtained result (even when I wasn’t all so happy with it) and I’m also thankful to Paulo for making me part of its work group, allowing me to feel comfortable to move around the laboratory and biotery and to use any equipment needed for my experiments.
I would also like to show my honest appreciation to Clara Amorim firstly, for taking me in consideration to suggest me and let me be part of this project and this group. Secondly, for all the help and availability for my questions and doubts and for helping me with statistical analysis, being a (outstanding) supervisor “off the book”. Beside my advisors I would also like to thank the rest of the members of the “Fonsim” group for receiving me, making me feel comfortable and helping me. I specially thank Manuel Vieira for cheering me up, and making me laugh when my data wasn’t looking so good. For helping me with statistical insights and showing me ways to improve my work.
I would like to express my sincere gratitude to my family for all the support throughout the master’s period and my life in general. For keep asking me if I liked what I was doing and if I wanted my future to follow this path. I thank my mother for every time that she took me to the bus station and cried and for every time she called me as if I was not several miles apart. I am thankful for my father’s support and for bragging about me being away doing the master’s thesis I wanted and loving it. I also thank my sister’s that kept calling me and texting me with the news and to my little (brat) sister that kept relying on me to help her with whatever she needed. I want to show my appreciation to my grandmother that don’t quite understand what I do, kept worrying about me, especially if was diving (afraid that I might die without air). I’m grateful to my aunt for the support and for always show excitement about biology matters and for wanting to tell me about some national geographic show that made her think of me. I would also like to thank my grandfather, for helping me be who I am today, for being the best role model, to always encourage me to follow my dreams and to do what I like. For continuing to be an inspiration and most of all, my inspiration even when it all seemed too much to take.
Lastly, my greatest appreciation goes to my best friend and boyfriend for supporting me throughout this path, for talking to me almost every day, making me forget about my concerns and for taking care of me even being so far away. Thank you so much.
Resumo
O Pomatoschistus pictus é um pequeno góbio de areia vocal, e com cuidados parentais exclusivos dos machos . Estes são territoriais e atraem fêmeas grávidas de Janeiro a Maio com exibições visuais e vocalizações (drums) produzidas a temperaturas variadas. Os machos em melhor condição (maiores reservas lipídicas) exibem maior actividade acústica. No entanto, não se sabe se as fêmeas escolhem os machos com base na sua actividade acústica, nem como esta é afectada pela temperatura. Os peixes são animais ectotérmicos e, portanto, a cinética da contracção muscular depende da temperatura, o que pode condicionar a taxa de emissão e os parâmetros temporais dos sinais acústicos. Neste trabalho testámos o papel dos sinais acústicos e visuais na escolha de parceiros pelas fêmeas. Estas foram submetidas a playbacks de drums a taxa alta e baixa, produzidos em compartimentos laterais no aquário. Os sons foram combinados com estímulo visual, constituído por dois machos de tamanho semelhante, colocados em pequenos recipientes de vidro, um em cada compartimento lateral. Na primeira experiência as fêmeas foram mantidas no compartimento central, enquanto na segunda elas podiam explorar os machos enclausurados. As fêmeas não mostraram preferência em relação à taxa de drums em qualquer das experiências, sugerindo que os sinais acústicos sejam um componente de uma comunicação multi-modal mais complexa. Avaliámos também o efeito da temperatura (14 - 22ºC) nos sinais de corte de
P. pictus. Os resultados mostraram que a duração dos drums e o período dos pulsos
diminui com o aumento da temperatura e que o pico de energia espectral está negativamente relacionado com o tamanho dos machos. A taxa de emissão de drums, a amplitude do som e o número de pulsos por drum não foram afectados. Discutimos as possíveis implicações das alterações dos sinais na comunicação acústica em peixes e enquadramo-la num contexto de alterações climáticas.
Palavras-chave: Teleósteos; Pomatoschistus pictus; escolha de parceiro; experiências de playbacks; temperatura, comunicação acústica.
Abstract
Pomatoschistus pictus is a small vocal marine goby with paternal care inhabiting
sandy or gravel substrates. Territorial breeding males court females with vocalizations (drums) and visual displays, from January to May, at various water temperatures. Males in better condition (larger lipid reserves) exhibit higher acoustic activity. However, it is unknown if females’ mate choice is based on males’ acoustic activity and how the latter is affected by temperature. Fish are ectotherms and therefore muscle contraction kinetics is temperature dependent which might influence sound production. We tested mate choice based on acoustic and visual signals with two playback experiments. Females were presented with high and a low drum rates broadcast from the lateral compartments of the aquarium. Acoustic playbacks were combined with the sight of two size-matched males confined in small glass aquaria. In the first experiment females did not have access to lateral compartments whereas in the second they could visit the confined males. Females did not show preference for sound rate in both experiments, suggesting that acoustic signals are part of a more complex multimodal communication and that females will only show active choice when they have access to males that can interact freely and exhibit their full repertoire possibly including chemical communication.
We also evaluated the effect of temperature (14 – 22 ºC) on courtship drums of
P.pictus. Our results show that drum duration and sound pulse period decreased with
increasing temperature and that spectral peak frequency was negatively correlated with male size. Drum emission rate, sound amplitude and number of pulses in a drum were not affected by temperature. We discuss the implications of temperature-driven changes in acoustic parameters in fish acoustic communication, incorporating it in a climate change context.
Key-words: Teleost fish; Pomatoschistus pictus; mate choice; playback experiments; temperature, acoustic communication.
List of Figures
Figure 1.1 – Scientific draw of Pomatoschistus pictus. Figure 1.2 – Pomatoschistus pictus distribution.
Figure 1.3 – Oscillogram of Pomatoschistus pictus sound signals: drum (a) and thump (b).
Figure 1.4 – Collection site for this project. Figure 2.1 – Experimental setup.
Figure 2.2 – Comparison of fish signals and sound playback oscillograms. Figure 2.3 – Experimental setup for sound recording at different temperatures.
Figure 3.1 – Time spent by females in the response area during playbacks at a high rate. Figure 3.2 – Comparison of the total time spent by females in the response area during playbacks at high and low drum rates.
Figure 3.3 – Histogram of the time spent by females in the response areas during playbacks at high and low drum rates.
Figure 3.4 – Time spent by females in the response areas during playback and post-playback periods.
Figure 3.5 – Relation between the time spent by females in the response areas and the male’s visual courtship displays during playback with visual stimulus.
Figure 3.6 – Relation between temperature and pulse period. Figure 3.7 – Relation between condition factor and pulse period.
Figure 3.8 – Relation between standard length and pulse period. Figure 3.9 – Relation between peak frequency and standard length.
List of Tables
Table 3.1 – Factorial ANOVA of repeated measures against co-variables.
Table 3.2 – Descriptive statistics of the time spent by females in high rate response area during playback and post-playback.
Table 3.3 – Correlation between dependent (acoustic) and independent parameters. Table 3.4 – Table for predictors of male sound pulse period.
Table 3.5 – Table for predictors of male sound peak frequency. Table 3.6 – Table for predictors of male sound amplitude. Table 3.7 – Pearson correlation between acoustic parameters.
Index
Acknowledgments iv
Abstract (Portuguese) vi
Abstract vii
List of figures viii
List of tables x
Chapter I – General Introduction 13
1.1. Introduction 14
1.2. Study species 17
1.3. Objectives 20
Chapter II – Experimental procedure 21
2.1. Collection and maintenance 22
2.2. Experiment 1: Acoustic playback with no access to male compartments 23 2.3. Experiment 2: Acoustic playbacks with access to male compartments 26 2.4. Experiment 3: the effect of temperature on courtship sounds 27
2.5. Data analysis 29
Chapter III – Results 31
3.1. Experiment 1: Acoustic playback with no access to male compartments 32 3.2. Experiment 2: Acoustic playbacks with access to male compartments 34 3.3. Experiment 3: the effect of temperature on courtship sounds 37
Chapter IV – Discussion 42 4.1. Experiment 1 and 2: Acoustic playback with visual stimulus 43
4.2. Experiment 3: the effect of temperature on courtship sounds 44
4.3. Final remarks 46
1.1 Introduction
Acoustic communication, including hearing abilities and sound emission has been described for several fish species (e.g. Amorim, 2006; Ladich, 2013). Hearing capabilities vary among fish and many species possess accessory structures (so called hearing specialists) to enhance sound reception. Hearing generalists detect the particle motion of low frequency sounds (at high intensities), while hearing specialists can detect the sound pressure at lower intensities. (Sholick and Yan, 2002a; Smith et al., 2004; Amoser and Ladich, 2005). Hearing sensitivity may be dependent on fish physiological condition. For instance Maruska et al. (2012) determined that cichlids ripe females are two to five times more sensitive to low frequencies and prefer to mate with males associated with playback courting sounds. Also the hearing sensitivity of females of the batrachoidid Porichthys notatus to the dominant frequency of male vocalizations is dependent on estrogen-mediated female condition (Sisneros, 2009).
The emission of sounds by fish is a known phenomenon but the general concept that most fish are silent remains (Zelick et al., 1999). Sound production in fish can occur through several mechanisms depending on the species (Ladich and Fine, 2006). Ladich and Fine (2006) have described the diversity of mechanisms of fish sound production considering as most important the pectoral and swimbladder associated mechanisms. The former is associated with movements of the pectoral fins or pectoral girdle (Ladich and Fine, 2006) and the latter relies on rapid muscle contraction of specialized sonic muscles compressing and distending the swimbladder, which results in low frequency pulsed sounds (Hawkins and Myrberg, 1983). However, the sound production mechanisms of several species remain unknown, such as in cichlids (Verzijden et al., 2010; Van Staaden and Smith, 2011) and many gobies (Lugli et al., 1996; Amorim and Neves, 2007; Parmentier et al., 2013).
Many teleosts vocalize during complex social interactions in which other sensory channels may be also involved. For example East African cichlids rely on multimodal communication using chemosensory, mechanosensory, acoustic and visual cues during social interactions (Van Staaden and Smith, 2011). Multimodal communication is characterized by sending and receiving information via various sensory channels such as acoustic, chemical, electrical, mechanosensory and visual which may give the recipient information about the sender’s identity and quality (e.g. readiness to mate, social status, motivation) (Sargent et al., 1998; Candolin, 2003; Bro-Jørgensen, 2010). A typical social context in which fish vocalize is reproduction. Indeed, the use of
acoustic communication during courtship is present in many teleost families (Myrberg, 1981; Amorim, 2006; Amorim et al., 2008; Simões et al., 2008) including gobiids (Lugli et al., 1997; Amorim and Neves, 2007), which have at least 1950 species described (Nelson, 2006). During mating, fish sounds are also typically accompanied by vibrant visual displays and signals from other sensory modalities.
Several authors have proposed three main mechanisms in sexual signalling: direct fitness benefits of choice, (e.g. parental care which enhances offspring survival); indirect genetic benefits; and exploitation of pre-existing sensory preferences in the receiver (Jennions and Petrie, 1997; Candolin, 2003). Mate choice based on acoustic communication has been widely studied for several species including insects (Butlin, 1993), anuran (Gerhardt, 1991) and birds (Searcy, 1992) but much less in fish (Myrberg
et al., 1986; Verzijden et al., 2010, Maruska et al., 2012; Amorim et al. 2013a,b).
In fishes with paternal care, male condition is relevant in female’s mate choice as it influences the male’s ability to take care of the brood (Lindström et al., 2006). Hence, male traits or signals that inform females of male parental’s ability are expected to be taken into consideration in mate choice. Amorim et al. (2013a) suggested that in fish, such as gobiids and batrachoidids in which body lipid content is related to vocal activity, this parameter might be a quality indicator of the male’s parental ability, but testing this hypothesis is required. Other acoustic parameters, such as sound amplitude and frequency, may also signal important quality traits, such as male size, and might be relevant to mate choice in this group (Myrberg et al., 1986).
However, for signals to be reliable either they should not fluctuate with external factors or their fluctuations should be accounted for by fluctuations of the receiver’s recognition filters.
Most fish are ectotherms and so physiological processes like the dynamics of sonic muscle contraction (Feher et al., 1998), and thus vocalization parameters, such as sound production rates and pulse period, may be temperature-dependent.
Temperature may also alter the vocalizations’ characteristics by affecting the neuronal activity at the central sound pattern generator in the brain (Bass and Baker, 1991). Moreover, increments in temperature may increase the dominant frequency, the sound emission rate, the sound pressure level, the sound duration, the repetition rate and may cause changes in pulse duration (Torricelli et al., 1990; Brantley and Bass, 1994; Connaughton et al., 2000). Temperature fluctuations can also affect reproductive rates of both genders in different ways. The operational sex ratio (OSR) of a given population
(i.e. sex ratio of ready to mate individuals at a given time (Emlem and Oring, 1977) will influence which sex will exert mate choice (usually the female) and the intensity of intra-sexual competition. OSR might also be affected by temperature fluctuations. For example, in the sand goby Pomatoschistus minutus the OSR that is similar for both gender at temperatures below 11ºC, gets male biased with warmer temperatures as male’s reproductive rate increases faster than does in females (Kvarnemo, 1996). Consequently, temperature influences mating competition in this species thereby also affecting the intensity of sexual selection (Kvarnemo, 1996). Temperature also affects egg incubation (e.g. Torricelli et al., 1985). Kvarnemo (1994) conducted the first study evaluating the effects of temperature on the reproduction of the sand goby. The studies showed that egg incubation time decreases with increasing temperature probably reducing the time a male spends defending its brood and nest, thus also influencing the male’s reproductive rate. In addition, reproductive rate can change as a result of limiting constraints other than the species physiology, such as food, and nest size or availability (Clutton- Brock and Vincent, 1991; Clutton- Brock and Parker, 1992).
In summary, acoustic communication in fish may be under mate choice but changes in water temperature may not only change vocal behaviour and sounds but affect OSR and consequently affect the degree of choosiness for mates and the intensity of sexual selection. Fish populations have been increasingly exposed to water
temperature rise due to global warming. However, little is known regarding the impacts of such changes on fish social interactions mediated by different sensory modalities including acoustic communication (Van der Sluijs et al., 2011).
The Gobiidae contains mainly benthic fish that look for shelter and nest sites under shells, submerged objects or by burrowing themselves in the sand (Lindström, 1992; Lindström and Lugli, 2000). Representative species of the sand goby group (Pomatoschistus and Kipowitschia) are short-lived, breed in shallow waters and build nests by excavating under rocks or shells (e.g. mussels). Lindström and Lugli (2000) established that breeding males cover their nest with sand and actively court females with visual and acoustic displays as follows. When females approach the male’s nest, the latter swims out of the nest and starts a sequence of courtship behaviour towards the female. This includes displaying erected fins and leading the female to the nest. When the female has chosen a suitable male, she follows him into the nest and remains there to spawn. Females can also enter and rapidly exit the nest before mating or decide to pursue another male. Males tend the eggs until hatching and can guard eggs from
several females, depending on nest size (Lindström, 1992; Lindström and Lugli, 2000). Sound emission in this family can occur during the pre-mating or pre-spawning phase (e.g. P. pictus) with males vocalizing when the female is already inside the nest or during spawning (e.g. Padogobius martensii) (Lugli and Torricelli, 1999; Myrberg and Lugli, 2006). In many gobies, female attraction depends on male visual and tactile signals but in some species of this group, such as in P. pictus, males begin emitting courtship acoustic signals in addition to visual signals while outside the nest (Amorim and Neves, 2007). In some species of the sand goby group (e.g. P. pictus, P. canestrinii) males also vocalize during agonistic displays (Malavasi et al., 2003; Amorim and Neves, 2008). The agonistic sounds are shorter, with smaller number of pulses than courtship sounds, and have a lower dominant frequency (Amorim and Neves, 2007), suggesting that agonistic and courtship sounds may convey different information. Agonistic sounds may inform about the male’s fighting ability and motivation, and so may contribute to prevent escalation of aggressive behaviour and reduce injury (e.g. Amorim and Neves, 2008).
1.2. Study species
The painted goby (P. pictus) (Figure 1.1) is a small marine species reaching ca. 60 mm. It has a short and round body, with the eyes placed dorsolaterally and has a round caudal fin. It exhibits a yellowish-olive coloration, two dorsal fins close together that present dark spotted rows with oblique blue and pink bands. The lateral midline presents four double spots and a dark pigmentation in the inferior maxilla can be found in males during the reproductive period (Quéro et al., 2003).
This benthic species lives in coastal waters of the Eastern Atlantic Ocean and Mediterranean Sea (Figure 1.2), on sand and gravel substrates down to 55 m deep (Miller, 1990). The reproduction period is approximately from February to July (Miller, 1986), at a range of temperatures centered around 16ºC in central Portugal, temperature at which most recordings in our sound archive were obtained (Amorim and Neves, 2007; Amorim et al., 2013a).It has a short life span (up to two years), is polygamous and exhibits exclusive paternal care as females flee after laying eggs in the males’ nest ceiling (Bouchereau et al., 2003; Miller, 1986). The male uses shells as shelters and reproductive sites (Bouchereau et al., 2003; Miller, 1984). Territorial nest holder-males attract females and defend their nests from intruders by performing vibrant visual and
acoustic displays, from January to May (in Portugal (Amorim and Neves, 2007, 2008).In this species, male courtship behaviour consists in visual displays performed outside the nest such as: approaching the female, quivering, nudging the female flank, rapid eight swimming displays and leading the female to the nest, displays inside the nest include quivering and jerky movements while placed at the nest entrance raised on its pelvic fins, and sound production (Amorim and Neves, 2007). Similarly to P.
minutus (Lindström and Lugli, 2000) the sounds in P. pictus are organized in groups
(i.e. sound bursts) (Amorim and Neves, 2007). The main vocalizations produced by P.
pictus during courtship displays are thumps and drums (Figure 1.3). The former are
composed by low frequency non-pulsed sounds in association with visual displays inside the nest, while the latter consists of pulsed low frequency sounds that accompany quivering displays inside and/or outside the nest (Amorim and Neves, 2007).
Previous studies have shown that larger P. pictus males court females more intensely (i.e. they show a higher courtship rate) both in terms of visual displays and calling rate (thump emission rate) (Amorim and Neves 2007). Drumming rate is higher in males with larger body lipid reserves, who seem to be preferred by females (Amorim
et al. 2013a). However, preference for calling rate still needs to be demonstrated as in
the study of Amorim et al. (2013a) females only had access to one male and could not fully exert mate choice. Also, the relative role of sounds in multimodal communication still needs to be understood. The study of Amorim et al. (2013b) has shown that when
P. pictus females are only presented with male visual information (a breeding male
confined in a glass container) females prefer males with higher courtship effort but when the visual and acoustic courtship signals are presented together acoustic signalling seems to override visual courtship in driving mate preference. The latter results suggest that visual and acoustic signals are important to mate choice but that both sensory channels interplay in a complex fashion, in a way not yet understood. Taken together, P.
pictus, is an excellent vocal fish model to address the role of acoustic communication in
Figure 1.1 – Scientific draw of the Pomatoschistus pictus [from gobiidae.com].
Figure 1.2 – Map of the distribution of the Pomatoschistus pictus species. The red area represents the most common occurrence sites while the yellow represents the location of less common occurrences [From fishbase.org].
Figure 1.3 – Oscillogram representing painted goby drumming (a) and thump (b) during courtship [adapted from Amorim et al. 2013a].
1.3. Objectives
The aim of this work was to:
1 – Determine if vocal activity (i.e. drumming rate) of P. pictus males is involved in mate choice by the female using playback experiments;
2 – Access if temperature affects the emission rate and acoustic features of sounds produced by male P. pictus and consequently female’s mate choice.
2.1. Collection and maintenance
Subject fish were collected with hand nets and flashlights at night during the low tide in Parede, Portugal (38° 41’N, 9° 21’W) (Figure 1.4), from December to March 2013 (peak of the breeding season).
In the laboratory the individuals were sorted by gender and distributed by glass stock aquaria (18 L; dimensions 24x24x32 cm). A maximum of 8 individuals were housed per aquarium. Gender was recognized from the roundness presented by females and by observation of the genital papilla under a stereomicroscope: females present a rounder papilla while males exhibit a more elongated one (Bouchereau et al., 2003). Sand substrate and shelters were provided for each stock aquarium and light followed the natural regime (experiments from January to April). Individuals were fed ad libitum with a mix of chopped mussel, clams and shrimp. Stock aquaria were provided with artificial saltwater (32-35‰) in a closed-circulation system, equipped with a biological filter (bio balls), an UV filter (Vecton2 600 Tropical marine center UK), and a skimmer (Tunze 9006) to remove excess protein from the water. A water cooler (Hailea 1000A 1HP) maintained the stock temperature at 16ºC, an average sea water temperature in winter/early spring).
Figure 1.4 – Satellite view of the collection site, Parede, Portugal. The red circle indicates the channel in which the fish were captured [From Google Earth (google.earth.com)].
2.2. Experiment 1: Acoustic playback with no access to male compartments
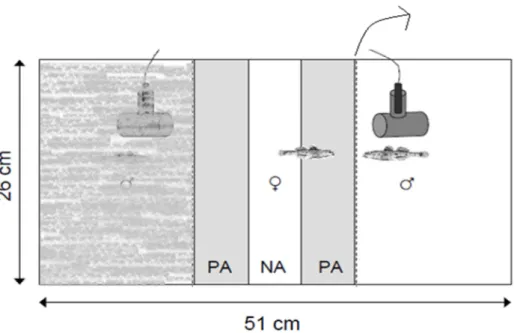
Experimental aquaria (35 L) were divided into 3 compartments with partitions and held two similar-size males (difference in standard length (SL) ratio < 10%), one at each lateral compartment (Figure 2.1). Males were restrained in small glass containers (8x8x11cm) allowed to acclimatize at least for 2 days or until territorial behaviour was observed (nest occupation and its covering with sand). Note that that these containers were not high enough to prevent chemical communication. During this period, a female was placed in the middle compartment to stimulate the males’ territorial behaviour. Prior to each experiment this female was replaced by another focal female and acclimatization was allowed for 24 hours. The three compartments were separated by two plexiglass partition sets, each composed of a perforated transparent partition and an opaque one to prevent visual interaction between individuals.
Both males were given bivalve shell as nests. Custom made speakers (3cm in diameter, Fonseca and Maia Alves, 2012) were placed behind each nest. The speakers were placed as close to the partitions as possible in symmetric positions in both sides of the aquaria (Figure 2.1) and the different playback stimuli were played simultaneously to assess female preferences. A hydrophone (see below) was placed in the middle of the central compartment to monitor sound playback. In the central compartment next to the partitions, two 5 cm preference areas (PA) (corresponding approximately to one fish length) were marked with a permanent pen. The remaining area between preference areas was considered a neutral area (NA) (Figure 2.1). 15 minutes before trials the water flow, filters and aeration systems were turned off. The observations were accompanied by audio and video (Sony DCR-HC39, Sony, 169 Tokyo, Japan) recordings for further behaviour analysis. The video camera was placed 50 cm from the experimental aquarium in a frontal position.
The trials were composed by three steps: 5 minutes pre-stimulus silence without visual stimulus followed by the sound playback with visual stimulus (5 minutes) and finally 5 minutes post-stimulus silence with visual stimulus. Female’s behaviour was analysed in each 5 minutes period and complemented with the real time annotations made during the experiment. The playback stimuli consisted of two sound sequences with different calling rates (a high and a low rate) played from each side of the aquarium, the side being randomized. The high and the low rate stimuli mimicked males calling (drumming) at high and low rates and corresponded to respectively the 75% and
the 25% quartiles of the drum rates (8 and 2 drums per minute, respectively) in the sound archive from 2010. Time intervals between sounds followed a natural calling patterns. Drums from four different males were used to produce four 5 min playback stimuli files, but each file only contained sounds from one male (as in Amorim et al. 2013b).
The hydrophone used to monitor sound playback (Brüel & Kjær 8104, Brüel & Kjær, Naerum, Denmark, sensitivity -205 dB re1V/µPa; frequency response from 0.1 Hz to 180 kHz, conditioned by a Brüel & Kjær Mediator type 2238) was connected to an A/D converter device (Edirol UA-25, Roland, Japan; 16 bit, 8 kHz) controlled by a laptop through Adobe Audition 3.0, (Adobe Systems Inc., Mountain View, CA, USA). Video (with audio) signal was then digitalized using MAGIX (Movies on DVD 7 Terratec Edition) software in a laptop. Behavioural analysis was performed with EthoLog 2.2 (Ottoni, 2002).
The speakers were connected to a custom made amplifier (Fonseca and Maia Alves, 2012) fed through a D/A device (Edirol UA-25) controlled by Adobe Audition 3.0. The amplitude of the playback sound was adjusted to mimic the acoustic signal emitted by the painted goby male at a distance of 1-2 cm (c. 130 dB) (Amorim et al., 2013b) (Figure 2.2). This sound pressure level calibration was done using the Brüel & Kjær hydrophone and sound pressure level measuring device (Brüel & Kjær Mediator type 2238).
To quantify females’ preference for the different male courtship sound rates, the time they spent in each preference area was determined. Any trial in which a female did not spend at least 25% of time in the preference areas was discarded as such females were considered non-responsive. Female preference was quantified as the percentage of time spent in the high rate area divided by the total time spent in both preference areas.
The Frequency of male courtship behaviour was also quantified: 1) the male visibility to the female, with two states, visible and non-visible, since sometimes males stayed hidden behind the nest or a sand pile; 2) up and down behaviour, i.e. the vertical movements in the water column; 3) nest building behaviour, consisting of covering the nest with sand using its caudal fin; 4) nudge behaviour, defined as the movement of the male towards the female only prevented by the glass compartment; 5) quiver behaviour, consisting of erecting body and fins accompanied by a rapid lateral shaking of the body; and 6) nest behaviour considered when the male was occupying the nest (Amorim and Neves, 2007; Amorim et al., 2013b).
Figure 2.1 – Experimental aquaria setup. Aquaria were divided in three compartments. A female in the central compartment received the playback sounds from both sides simultaneously (one with high and the other with low drum rates). The grey areas correspond to the preference areas (PA) with the neutral area in the middle (NA) [Adapted from Amorim et al. 2013b].
Figure 2.2 – a) Oscillogram of the painted goby drum sound; b) Oscillogram of the playback sound, mimicking the natural sound, emitted by the speaker [From Amorim et al. 2013b].
PA
2.3. Experiment 2: Acoustic playbacks with access to male compartments
Experimental aquaria the same as in experiment 1, 35 L) also held two similar sized males (difference in standard length (SL) ratio < 10%) in the lateral compartments. Males were confined in small containers (8x8x22cm) that projected above the aquarium water level, one placed in each lateral compartment, this time preventing chemical communication. As above, these males were allowed to acclimatize at least for 2 days or until territorial behaviour was observed (nest occupation and covering with sand) while a female in the central compartment stimulated territorial behaviour. Posteriorly, a focal female replaced the stimulus female and was allowed to acclimatize for twenty-four hours. The three aquarium compartments were separated by opaque perforated plexiglass partitions to prevent visual contact among individuals.
Both males were given bivalve shell nests and custom made speakers (as above) were placed behind each nest. The speakers were positioned as close to the partitions as possible in both lateral compartments and the sound stimuli were played simultaneously to assess female preferences (as in experiment 1). The monitoring of the sound playback pressure level and the definition of the response preference areas (PA) and neutral areas (NA) were made as indicated above (Figure 2.1).
Fifteen minutes before trials the water flow, filters and aeration systems were turned off. The fishes’ behaviour was audio and video recorded for posterior detailed behavioural analysis (as in experiment 1). The trials were composed of two steps: 5 minutes of sound stimuli playback without visual contact with the males, followed by 10 minutes with sound playback without the opaque partition where female could access the lateral compartments and observe confined males. Female’s and male’s behaviour was then analysed with Etholog2.2. Time spent by females in each preference area (first phase of the experiment before partition removal) or in each lateral compartment (second phase – after partition removal) was quantified. Measurements of male behaviour were the same as in experiment 1. Annotations taken during the experiment were also taken into account during video analysis.
2.4. Experiment 3: the effect of temperature on courtship sounds
These experiments consisted on recording courtship sounds of P. pictus males at different temperatures (14, 15, 16, 17, 18, 19, 20, 21 and 22ºC). The fish collection and maintenance was performed as previously. Experimental aquaria were divided in 3 compartments as above. A female was placed in the central compartment and one male with an artificial nest (a PVC tube 5.5 cm long and 3 cm internal diameter with a chimney) in each lateral compartment. A hydrophone (Brüel & Kjær 8104 connected to a sound pressure level measuring device Mediator type 2238) was inserted in the artificial nest chimney (Figure 2.3). Males were maintained in separate stock aquaria at 14ºC (the lower temperature) and transferred to experimental aquaria at least 24h before the observations (temperature difference between stock and experimental aquaria was at maximum two degrees Celsius). The acclimatization occurred in the presence of a stimulus female in the central compartment of the aquaria, using a transparent perforated plexiglass partition. Male’s establishment was completed when dominant behaviour was present (e.g. nest covered with sand).
For recordings, the partition separating one male (focal) and the ripe female was removed allowing fish interaction (Figure 2.3) and the production of male courtship sounds (drums). As previously the experiments were audio and video recorded for further behavioural analysis (see details above).
At the end of each trial fish weight and length were measured. Male visual courtship behaviour was quantified from video and drumming rate was measured from audio recordings. The number of thumps and drums were counted for each male. Fifteen drumming sounds were randomly selected in each recording and the following parameters were considered: Duration – the approximate duration of the sound from beginning to end (ms); Pulse number – the number of pulses present in one drum; Pulse period total (pp total) – the duration from the first pulse to the last one in a single sound (ms); Pulse period 3-6 (pp3-6) and pulse period 37-40 (pp37-40) – the duration of the sound between the third and sixth pulse and between the thirtieth seven and fortieth, respectively (ms); Peak frequency – the frequency with maximum energy in the power spectrum (Hz); Amplitude (rms) – is the root mean square average amplitude of one drum within a sound. We also measured drum emission rate (drums per minute) – the number of drum sounds found in five minutes of recording starting with the occurrence of the first drum in the sound file, divided by five(drums min-1); Emission rate (sounds
per minute) – the number of sounds (drum or thump) found during five minutes since the first sound occurred in the sound file, divided by five; Thumps and drums number – the number of thumps and drums, respectively, within the original sound file.
Other metrics were calculated: Thumps/drums ratio – the total number of thumps divided by the total number of drums of an individual; Mean pulse period – the time elapsed from the first pulse of one sound until the last pulse of the same sound divided by the number of pulses minus 1, xpp; Fatigue – the ratio of pp3-6 and pp37-40. (similar to Amorim et al., 2013b). The condition factor (k), consisting of the ratio of the individual’s weight by its standard length (K=W/SL^3) was also calculated.
Figure 2.3 – The plexiglass transparent partition was removed allowing the interaction between one male and the female. For each temperature the hydrophone placed in the nest’s chimney recorded the sounds produced by the male in the nest. The remaining males were separated from the tested individuals by an opaque partition enabling to test one male at a time. Note that the blurred area is to represent that only one side of the aquaria is used [Adapted from Amorim et al., 2013b].
2.5. Data analysis
Experiment 1: Acoustic playback with no access to male compartments
A repeated-measures ANOVA was carried out to test the effect of the playback on female preference, i.e. percentage of time in the high rate preference area calculated in relation to the total time spent in both preference areas. The repeated measure variable consisted in the three playback periods, the pre-, the playback and the post-playback periods. The relative male courtship activity (ratio between the average courtship of the high-rate and the low-rate males) was used as a co-variable to control for its effect on female preference. Female standard length and female condition factor (a proxy for female’s roundness) were also used as co-variables as they could affect preference or female motivation.
Experiment 2: Acoustic playbacks with access to male compartments
A student t-test for dependent samples was made to compare the time spent by females in the high and the low rate during the first phase of the experiment (playback with no visual cue). In the second phase of the experiment (after partition removal) female preference was tested by the percentage of time spent by females in the high rate side of the aquarium with 0.5 (or 50%), i.e. with the expected percentage if the time spent by females in each side of the aquarium was random.
In this test the second and third playback periods were lumped together as data did not differ between them. Since this test did not control for possible effects of male courtship the relation between female preference (i.e. percentage of time in the high rate side of the aquarium) with male’s courtship activity was tested with a Pearson correlation test.
Experiment 3: the effect of temperature on courtship sounds
The relation between all acoustic variables, water temperature, male standard length and male condition factor were tested with Pearson correlation tests. Statistical
adjustments for probabilities were made using Bonferroni’s correction since multiple tests were performed. This is used to diminish the Type I error (assumes the occurrence of differences when they do not exist) as multiple testing increases the number of hypothesis and consequently the increasing probability of this type of error to occur. The Bonferroni’s general formula is:
In which α is the probability of rejecting the null hypothesis (H0) when this last one is true, corresponding in this case to 0.05 (5%), which is the minimal significance level allowed, for all Bonferroni corrections in the present work; n is the number of tests.
Multiple regressions analyses were made to test whether male condition factor (k), male standard length and water temperature (independent variables) were significant predictor of the acoustic parameters. Regression analyses were made for each of following acoustic parameters (dependent variables): pulse period, peak frequency and sound amplitude, i.e. the ones significantly related with the independent variables as shown by the exploratory correlation analyses. Male standard length was log-transformed to meet the model assumptions. The regression model assumptions were verified. Normal distribution of model residuals were assessed visually. Further residual analysis was performed using Durbin–Watson statistics, residual plots as well as multicollinearity tests (variance inflation factors, VIF). The Durbin-Watson statistics is used to detect the presence of autocorrelation in the residuals, i.e. a relationship between residuals separated from each other by a given time lag. Durbin Watson values near 2 indicate no autocorrelation. VIF allows the determination of multicollinearity and VIF values should be smaller than 10.
All statistical analyses were performed with Statistica 7 (StatSoft, Inc., 2004), and SPSS 20 (IBM, 2011).
3.1. Experiment 1: Acoustic playback with no access to male compartments
Here we tested whether females preferred males associated with courtship sounds produced at a high or a low-rate. We found no differences between the percentage of time spent near the high-rate preference area during the pre-stimulus, playback and post-stimulus periods indicating that females did not show a preference for high-rate drum production (Table 3.1, Table 3.2; Figure 3.1). Female size, condition factor (roundness) and relative male courtship rate did not have a significant effect in the time spent by females in each side of the aquaria (Table 3.1).
Table 3.1 – Repeated measures ANOVA showing the effect of playback period (PBK period) and co-variables on the percentage of time spent by the female in the high-rate preference area.
Effect df F P
Intercept 1 0.569070 0.456927
Relative male courtship* 1 2.411290 0.131694
Female SL* 1 0.067308 0.797196
Female K* 1 0.000475 0.982767
Error 28
Pbk period** 2 0.333854 0.717574
Pbk period*relative male courtship*** 2 0.054180 0.947311 Pbk period*female SL*** 2 1.013606 0.369468 Pbk period*female K*** 2 1.176291 0.315924
Error 56
Relative male courtship was log-transformed. * covariates; ** repeated measures variable; *** variable interaction.
Table 3.2 – Descriptive statistics for the time spent in high rate preference area.
N Mean Minimum Maximum Std. Dev
Pre 19 0,65 0,00 1,00 0,34
Pbk 20 0,47 0,00 1,00 0,36
Post 20 0,50 0,00 1,00 0,33
Descriptive statistics of the time spent by females in high rate preference area during playback periods. Pre: pre-stimulus period; Pbk: playback period; Post: post-stimulus period.
Mean Mean±SE Mean±SD High rate pre
High rate pbk
High rate post
Time (s) 0,1 0,2 0,3 0,4 0,5 0,6 0,7 0,8 0,9 1,0 P re fe re n c e a re a
Figure 3.1 – Box and Whisker plot of the percentage time spent by females in the high rate response during pre-, playback and post-playback. PA - preference area.
3.2. Experiment 2: Acoustic playbacks with access to male compartments
First phase of the experiment (playback with no visual stimuli)
We compared the total time spent by females in the high and low-rate preference areas in the first phase of the experiment (playback without visual stimuli) to investigate female preferences for high or low playback rates when not exposed to the visual stimuli of males. A t-student test showed no differences between the time spent in both preference areas (Student t-test, N=23, t=0.16, P=0.87; Figure 3.2), indicating no preference for high sound rate when in the absence of additional visual stimuli.
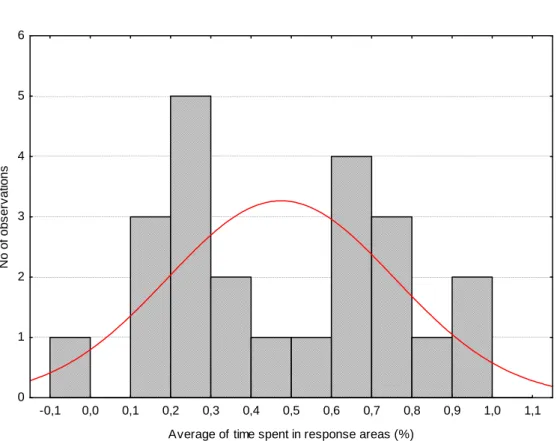
Second phase of the experiment (playback with visual stimuli and no partitions) An histogram of the percentage of time spent by females in the high rate side of the aquarium shows a bimodal distribution, with two maxima before and after 0.5 (i.e. 50%) (Fig. 3.3 suggesting that part of the females showed preference for the high rate and the remaining females for the low-rate resulting in an average lack of preference.
The mean percentage of time spent in the high-rate side of the aquarium did not differ significantly from 50% (Student t-test, N=23, t= -0.49, P=0.63); Figure 3.4) indicating a lack of female’s choice for drumming rate.
The percentage of time spent by females in the high rate side of the aquarium and male’s courtship activity during the second and third periods of the experiment were not significantly correlated (Pearson correlation, N=23, r=0.17, P>0.05; Figure 3.5) indicating a lack association between relative male courtship activity and female distribution. Note that these periods correspond to the occurrence of playback stimulus along with visual stimulus.
Mean Mean±SE Mean±SD High rate 1st 5min
Low rate 1st 5min
Preference area -40 -20 0 20 40 60 80 100 120 140 160 180 200 220 240 T im e ( s )
Figure 3.2 – Box and Whisker plots of the time spent by females in the high rate and low rate preference areas during the first period of experiment 2.
.
-0,1 0,0 0,1 0,2 0,3 0,4 0,5 0,6 0,7 0,8 0,9 1,0 1,1 Average of time spent in response areas (%)
0 1 2 3 4 5 6 N o o f o b s e rv a tio n s
Figure 3.3 – Histogram of the average time spent by females in the high-rate preference side of the aquarium.
Mean = 0,4714 Mean±SE = (0,4128, 0,53) Mean±SD = (0,1904, 0,7525) High rate/low rate (2nd and 3rd 5min)
Time (s) 0,1 0,2 0,3 0,4 0,5 0,6 0,7 0,8 P re fe re n c e a re a
Figure 3.4 – Box and whisker plot of the percentage of time spent by females in the high rate preference area during the playback and post-playback periods. Notice that 0% would indicate that females had passed all the time in the low rate response area while 100% would correspond to females spending all the time in the high rate response area. 50% indicates a random distribution and therefore lack of preference for the high- or the low-rate side of the aquarium.
0,0 0,1 0,2 0,3
% Time in high rate PA -1,0 -0,8 -0,6 -0,4 -0,2 0,0 0,2 0,4 0,6 0,8 R e la tiv e m a le c o u rt s h ip 95% confidence
Figure 3.5 – Relation between the percentage of time females spent in high rate response area and relative male courtship activity, i.e. ratio between total courtship of the ‘high-rate male’ and the low-rate male’, during the second and third playback periods of the experiment (with visual stimulus).
3.3. Experiment 3: the effect of temperature on courtship sounds
Recordings of courtship sounds with good signal-to-ratio were obtained at temperatures ranging 14ºC-22ºC in 58 males, and a set of sound parameters were measured from the sound recordings (see Experimental Procedure).
Correlations computed between acoustic parameters and individuals’ features (weight and standard length) and temperature are summarized in Table 3.3. Sound duration, pulse period and sound amplitude increased significantly whereas peak frequency decreased with fish length. Only one acoustic parameter (pulse period) was significantly related with male condition factor. Both duration and pulse period were significantly and positively related with water temperature.
Regressions were made using as independent variables the condition factor (k), logarithmic standard length (log sl) and temperature (T ºC) and as the dependent variable one of the following acoustic parameters: pulse period (Table.3.4), peak frequency (Table 3.5) and sound amplitude (Table 3.6), i.e. the ones significantly related with the independent variables. Duration was not considered since it was significantly correlated with pulse period (Pearson correlation, N=58, r= 65, P<0.001; see Table 3.7 below). Pulses number and fatigue are also related with each other unlike pulse period which is exclusively related with duration (Table 3.7).
Pulse period was significantly predicted by temperature, male SL and K (ANOVA: F3,57=113.9, P<0.001; Table 3.4). Pulse period showed a negative tendency with temperature and condition factor, and a positive trend with standard length (Figures 3.6, 3.7, 3.8). Temperature alone contributed to explaining 83% of the variability in pulse period whereas male SL and K explained a further 3%. Regression analysis showed that male standard length significantly explained 19% of the peak frequency variability (ANOVA: F1,56=12.8, P<0.01; Table 3.5). Male length further explained 9% of the variability found in sound amplitude (ANOVA: F1,56=5.80, P<0.05; Table 3.6). Peak frequency (Figure 3.9) and amplitude (Figure 3.10) were positively and negatively related with standard length, respectively.
Table 3.3 – Pearson correlation between dependent and independent parameters.
Dependent (acoustic variables) and independent parameters: temperature and individual features (condition factor and standard length). P values include Bonferroni corrections.
Table 3.4 – Table for predictors of male sound pulse period.
Dependent variable Included predictor B s.e.m. t P F Model significance R2 DW VIF
Pulse period Intercept 43,882 5,944 7,383 0,000
Temp -1,502 0,163 -9,212 0,000 F3,57=271,5 P<0.001 0,829 2,293
SL 23,901 7,120 3,357 0,000 F3,57=151,5 0,846 2,071
K -37,696 14,466 -2,606 0,000 F3,57=113,9 0,864 1,819 1,255 Temp – temperature; SL – standard length; K- condition factor. Results from multiple
regression analysis.
Table 3.5 – Table for predictors of male sound peak frequency. Dependent variable Included predictor B s.e.m. t P F Model significance R2 DW VIF Peak freq Intercept 297,987 36,052 8,265 0,000
SL -221,943 61,998 -3,580 0,001 F1,56=12,815 P<0.01 0,189 1,852 1,000 SL – standard length. Results from multiple regression analysis.
Duration (ms) Pulses number Peak frequency (Hz) Pulse period (ms)
Fatigue Amplitude Drums
emission rate (drums min-1) logSL (cm) r=0,521 r=0,031 r=-0,44 r=0,717 r=0,006 r=0,309 r=0,100 p=0,000 p=0,817 p=0,001 p=0,000 p=0,965 p=0,019 p=0,458 Condition factor r=-0,229 r=0,012 r=0,089 r=-0,344 r=-0,225 r=0,247 r=0,027 p=0,087 p=0,930 p=0,512 p=0,009 p=0,093 p=0,064 p=0,845 Temp (ºC) r=-0,662 r=-0,072 r=0,246 r=-0,909 r=-0,202 r=-0,204 r=-0,114 p=0,000 p=0,593 p=0,065 p=0,00 p=0,131 p=0,128 p=0,398
Table 3.6 – Table for predictors of male sound amplitude. Dependent variable Included predictor B s.e.m. t P F Model significance R2 DW VIF Amplitude Intercept -37,072 5,041 -7,354 0,000 SL 20,877 8,670 2,408 0,019 F1,56=5,799 P<0.05 0,095 1,531 1,000 SL – standard length. Results from multiple regression analysis.
Figure 3.6 – Relation between temperature and pulse period. The regression line and 95% confidence intervals are shown.
Figure 3.7 – Relation between condition factor and pulse period. The regression line and 95% confidence intervals are shown.
0,10 0,12 0,14 0,16 0,18 0,20 0,22
Condition factor
15 20 25 30 35 40 45P
u
ls
e
p
e
ri
o
d
(
m
s
)
14 16 18 20 22 Temperature (ºC) 15 20 25 30 35 40 45 P u ls e p e ri o d ( m s )Figure 3.8 – Relation between standard length and pulse period. The regression line and 95% confidence intervals are shown.
Figure 3.9 – Relation between standard length and peak frequency. The regression line and 95% confidence intervals are shown.
0,45 0,50 0,55 0,60 0,65 0,70
Standard length (cm)
15 20 25 30 35 40 45P
u
ls
e
p
e
ri
o
d
(
m
s
)
0,45 0,50 0,55 0,60 0,65 0,70Standard length (cm)
100 120 140 160 180 200 220 240 260P
e
a
k
f
re
q
u
e
n
c
y
(
H
z
)
Figure 3.10 – Relation between standard length and amplitude. The regression line and 95% confidence intervals are shown.
Table 3.7 – Pearson correlation between acoustic variables.
Duration Pulses
number
Peak freq Pulse
period Fatigue Amplit ude Drums emissio n rate Duration r - 0,729** -0,380** 0,646** 0,556** 0,087 -0,086 p - 0,000 0,003 0,000 0,000 0,517 0,522 Pulses number r - -0,271* -0,025 0,694** 0,175 0,017 p - 0,040 0,849 0,000 0,188 0,899 Peak freq r - -0,251 -0,124 -0,105 0,051 p - 0,058 0,354 0,434 0,706 Pulse period r - 0,066 -0,069 -0,168 p - 0,624 0,609 0,206 Fatigue r - 0,249 0,123 p - 0,059 0,359 Amplitu de r - 0,761** p - 0,000 Drums emissio n rate r - p -
Acoustic or dependent variables: duration, peak frequency, pulse period, fatigue, amplitude, drums emission rate and pulses number.
0,45 0,50 0,55 0,60 0,65 0,70
Standard length (cm)
-34 -32 -30 -28 -26 -24 -22 -20 -18 -16A
m
p
lit
u
d
e
4.1. Experiment 1 and 2: Acoustic playback with visual stimuli
There is little empirical evidence of the effects of sound signals in mate choice of teleost fish (Myrberg et al., 1986; McKibben and Bass 1998; Verzijden et al., 2010; Maruska et al., 2012) despite the use of sounds by this group, in reproductive contexts (Myrberg and Lugli, 2006) and even in mate recognition and mate choice (Amorim et
al. 2008, Amorim et al. 2013b). Recent studies with African Cichlids showed evidence
of a key role of sounds in a reproduction context since females’ exhibited preference for males previously associated with courtship sounds (Verzijden et al., 2010; Maruska et
al., 2012). Similarly, Amorim et al., (2013b) observed a female preference for males
associated with courtship sounds in P. pictus, irrespective of the males’ visual courtship effort. However, courtship sound stimuli alone did not elicit female preference in this species but when females were exposed to visual stimuli alone they preferred males with a higher visual courtship rate, suggesting that sounds are only relevant in a multimodal communication context. In the present work the role of male courtship sounds in female mate choice was further investigated in P. pictus. The effect of courtship sound rates on female preferences was evaluated by comparing the permanence of females is preference areas associated with high rate or low rate of courtship sound emission. Based on previous results (Amorim et al., 2013b) a concurrent visual stimuli were presented, so that responses to acoustic signals could be expected. In the first experiment there were no significant differences in the time spent by females in the high rate preference area, among the pre-, the playback and the post-playback periods.
Consistently, in the second playback experiment no significant differences were observed on the females’ choice for sound rate during the first phase of the second playback experiment (acoustic playback without visual stimulus). When visual contact with males was allowed, results were still similar, suggesting that there is no preference for courtship sound rate, at least with the present experimental designs. This results are surprising since P. pictus males with higher calling rate show better condition and seem to enjoy higher reproductive success (Amorim et al., 2013a) Also, female preference for males associated with sounds have been demonstrated with similar playback experimental designs (Amorim et al., 2013b). How can the present results be explained?. A male and aquarium side effects should not have affected the results since males were randomly placed in opposite sides of the aquaria, were size matched, and
playbacks were randomly attributed to each side. The possibility that females were not sufficiently ripe and therefore not choosy should however not be discarded since the average condition factor and therefore roundness in the present study was 1.14 in contrast to 1.50 exhibited by the females in Amorim et al. (2013b). Another possibility is that females do prefer males associated with sound but they show a threshold for preference already surpassed with the low sound rate. However this is likely not the case because Amorim et al. (2013a) found that P. pictus males that did not succeed in mating sang on average 1.87 drums min-1, similar to our low rate (2 drums min-1) while successful male presented a drum rate of 4.63 drums min-1, a rate approximately half of the high-rate stimulus (8 drums min-1). More likely females of this species only show active choice for sound rates when they have access to males that can interact freely and exhibit their full repertoire, possibly including tactile and chemical communication. In the first playback experiments confinement’s containers allowed chemical communication but females did neither have access to males nor males could act freely. Hence, some adjustments to the experimental design might be needed, such as considering free-swimming males instead of restrained males, attempting to better mimic natural conditions in order to test preference for sound rate. This, however, would raise the issue of agonistic disputes between the males and possible changes of territory (nest) by the individuals. Future work should pursue such as experiments as the role of acoustic communication in mate choice in fish remains largely unknown (Amorim et al., 2013a, b).
4.2. Experiment 3: the effect of temperature on courtship sounds
Most fish are ectotherms and muscle contraction temperature-dependent kinetics (Feher et al., 1998) may affect vocalization parameters, such as sound production rates and pulse period, dominant frequency, sound pressure level, sound or pulse duration, etc (Torricelli et al., 1990; Brantley and Bass, 1994; Connaughton et al., 2000). For instance, Yamaguchi et al. (2008) demonstrated in the ectothermic anuran Xenopus
laevis that advertisement calls from males are temperature dependent. Similar results
can be found in other anurans and insects (e.g. Fonseca and Revez, 2002). Moreover, temperature may also affect the neuronal activity at the central sound pattern generator in the brain (Connaughton et al., 2000).
Birds, insects, anuran and fishes are known to vocalize in courtship situations as a mean to attract females towards the male’s territories and/or nests. Vocalizations are also used in agonistic contexts to alert or dissuade other males (Lugli et al., 1996; Torricelli et al., 1993) and defend territories possibly reducing aggressive escalated behaviour (Vasconcelos et al., 2010).
Our results show that in P. pictus pulse period and consequently sound duration decreased with increasing temperature, meaning that ‘sonic muscle’ contraction period decreases in warmer water. Note that the mechanisms of sound production is not known (Amorim and Neves, 2007) but likely involves muscle contraction.
Standard length and weight seem to also affect (although positively) the pulse period but this variables contribute much less (3%) than temperature (83%) to pulse period variability.
Consistent with the present results, Lugli et al. (1996) determined that with temperature increment shorter and higher frequency sounds are produced by the freshwater goby (Padogobius nigricans).
Pulse period has been pinpointed as a key feature in species recognition (Amorim
et al., 2005) and in mate choice (Amorim et al., 2010), including in the present species
(Amorim et al., 2013a). Changes in this feature could thus affect recognition of mates and sexual selection pressure but the effect of temperature on mating preferences still need to be addressed in fish. To the best of our knowledge only one study has focused simultaneously on the effect of temperature on acoustic signals and on female preference. McKibben & Bass (1998) have found that plainfin midshipman (Porichthys
notatus) females prefer male mating sounds with the dominant frequency (expected for
a given temperature). It is clear that more similar studies are needed in order for us to understand how global warming can affect fish reproductive interactions and thus the distribution and structure of fish communities.
Besides temperature, we also looked at the relation of body size and condition with acoustic signals. Male length and body condition were significant predictors of pulse period but together only explained 3% of pulse period variability. While body condition was not related with any other acoustic parameter, male length was a good predictor of peak frequency and sound amplitude, explaining 19% and 9% of the variability observed in these parameters, respectively. Hence both peak frequency and sound amplitude may inform receivers of male length. Male body size has proven beneficial in resources competition (Magnhagen and Kvarnemo 1989; Lindström and
Pampoulie 2005). As shown in similar species (Magnhagen and Kvarnemo, 1989; Lindström and Pampoulie 2005), body size can be a predictor of nest size and therefore of the fitness and defense capacity of the individuals.
4.3. Final remarks
Contrary to our expectations our playback experiments did not show female preference for male drumming rate. Since drumming rate signals male quality and males with a higher rate enjoy higher mating success (Amorim et al., 2013a), our results suggest that sounds are part of a more complex multimodal communication system and that other experimental designs are required to assess female preference in this species. The function of sounds in mate choice is hardly understood in fish and further experiments are necessary.
Like in other animal groups (e.g. anurans, insects, Gerhardt and Huber, 2002), the fish vocalization parameters are usually species-specific (e.g. Amorim, 2006) and likely important in species recognition and mate choice. Pulse period is one of the parameters that seems key in the recognition of closely-related species such as cichlids or gobies (Lugli and Torricelli, 1999; Amorim et al., 2008) and is temperature dependent. Thus, temperature-induced modifications may impact many animal physiological and behavioural processes, including acoustic communication, and increasing concern exists on how climate change may condition species distribution and abundance. In fact this trending topic demands a better knowledge of temperature dependent effects on living organisms.
![Figure 1.2 – Map of the distribution of the Pomatoschistus pictus species. The red area represents the most common occurrence sites while the yellow represents the location of less common occurrences [From fishbase.org]](https://thumb-eu.123doks.com/thumbv2/123dok_br/18035413.861678/19.892.128.561.349.636/distribution-pomatoschistus-represents-occurrence-represents-location-occurrences-fishbase.webp)
![Figure 1.4 – Satellite view of the collection site, Parede, Portugal. The red circle indicates the channel in which the fish were captured [From Google Earth (google.earth.com)]](https://thumb-eu.123doks.com/thumbv2/123dok_br/18035413.861678/22.892.130.603.728.1017/figure-satellite-collection-parede-portugal-indicates-channel-captured.webp)