UNIVERSIDADE DA BEIRA INTERIOR
Ciências
Biophysical study of therapeutic antibody
adsorption in affinity chromatography
Gonçalo Fradique Lopes da Silva
Tese para obtenção do Grau de Doutor em
Bioquímica
(3º ciclo de estudos)
Orientador: Prof. Doutor Ana Cristina Mendes Dias Cabral
Co-orientador: Prof. Doutor Alois Jungbauer
Acknowledgements
To Prof. Cristina Cabral, Prof. Alois Jungbauer, and Astrid Dürauer, for their prompt availability whenever I needed and scientific input. Also, for their kind and useful advice during the course of these four years. But mostly, for their patience.
To Sir Rupert Tschelieβnig, for aiming for eternal fame. Thank you for all the help and the shiny models, because “seeing is believing”.
To Jacek Plewka, for sharing the burden with me.
To all my friends and colleagues involved in the 25.011 project, Alois’ lab in Vienna, and Cristina’s lab in Portugal, for the good work environment, coffee breaks, beer breaks, and all the fun and interesting discussions we had.
À minha família, um muito obrigado por todo o suporte, carinho, e motivação durante estes anos.
I also want to acknowledge Fundação para a Ciência e Tecnologia for the grant and the Austrian Centre of Industrial Biotechnology, Novartis/Sandoz, and Boehringer Ingelheim for the cooperation.
Resumo alargado
O mercado de anticorpos monoclonais (mAbs – do inglês monoclonal antibodies) tem vindo a crescer exponencialmente ao longo das últimas décadas devido à elevada capacidade de resposta, selectividade, e robustez destas biomoléculas. O número de áreas de aplicação terapêutica dos mAbs tem também vindo a aumentar, sendo o cancro e as doenças autoimunes as mais representadas. Existem actualmente mais de 50 produtos aprovados e comercializados, representando uma receita de cerca de 100 mil milhões de dólares em vendas. Deste modo, devido à elevada procura e concomitante necessidade de aumento da produção destas biomoléculas, a indústria farmacêutica tem estado em constante evolução e optimização dos processos de produção e purificação de mAbs. Existem ainda critérios cada vez mais apertados para o controlo de qualidade destas biomoléculas por parte das principais agências reguladoras mundiais, nomeadamente a U.S. Food and Drug Administration (FDA) e a Agência Europeia do Medicamento (EMA – do inglês European Medicines Agency), de modo a assegurar a formulação de um produto seguro e de elevada pureza. É, por isso, necessário haver uma compreensão completa de todos os passos envolvidos em toda a cadeia de produção de anticorpos monoclonais.
Um dos passos mais críticos, dispendiosos, e limitante é o passo de captura dos anticorpos durante a fase de purificação, nomeadamente o uso de cromatografia de afinidade com resinas de proteína A. A cromatografia de proteína A é o método mais aplicado para a purificação de anticorpos devido à sua elevada selectividade e também devido à sua robustez. As resinas de cromatografia utilizadas têm elevadas capacidades de ligação dinâmica, muito devido ao facto de os seus ligandos serem cadeias com múltiplos locais de ligação. Apesar da ligação dos anticorpos à proteína A ser amplamente conhecida, ainda não existe muita informação acerca do mecanismo através do qual a interação ocorre. Há certos aspectos como a estequiometria, a ligação preferencial, e a orientação tanto da cadeia de proteína A como do anticorpo que ainda não estão muito claros. Este conhecimento pode ser utilizado para optimizar a performance da captura de mAbs, quer seja através do melhoramento das resinas, quer seja através da minimização de custos devido a melhores previsões através do estabelecimento de modelos que incorporem estes parâmetros.
Na cromatografia de proteínas são utilizados alguns sensores que têm por base fornecer informação acerca da concentração (UV), pureza (cromatografia de exclusão molecular em HPLC – SEC-HPLC do inglês), potência (ressonância de plasma de superfície – SPR do inglês), e estrutura (dicroísmo circular – CD do inglês e dispersão de luz por ângulo múltiplo – MALS do inglês). No entanto, todos estes sensores recolhem informação após as moléculas terem passado pela coluna de cromatografia operando online no sistema, ou então são usadas offine. Nenhum dos detectores fornece informação sobre a ligação anticorpo-proteína A realmente in situ.
Este trabalho de doutoramento teve como objectivo a compreensão da interacção entre anticorpos e resinas de proteína A com recurso a técnicas de operação in situ, de modo a poder
estabelecer um modelo que consiga prever a adsorção de anticorpo, a sua organização estrutural aquando da ligação, a sua migração ao longo da coluna, a sua eluição e consequente pureza e potência. Para tal, foram usadas duas resinas de proteína A comerciais (MabSelect SuRe e TOYOPEARL AF-rProtein A HC) conhecidas pelas suas cadeiras com múltiplos domínios de ligação (4 e 6, respectivamente) e foi utilizado um mAb comercial (trastuzumab).
A microcalorimetria de fluxo (FMC – do inglês) foi usada extensivamente para obter os parâmetros termodinâmicos associados à adsorção de anticorpos às resinas de proteína A. O microcalorímetro consiste numa coluna cilíndrica de 6 mm de diâmetro interno e 6 mm de altura com dois sensores térmicos acoplados às paredes da coluna capazes de detectar pequenas variações de potencial durante o processo cromatográfico. O perfil de adsorção mostrou ser de natureza exotérmica com dois passos subjacentes. Um primeiro momento é relativo à ligação em si, que resulta em grandes libertações de calor. Posteriormente, há uma reorganização dos anticorpos nos ligandos de modo a arranjarem a posição energeticamente mais favorável.
De modo a caracterizar as alterações estruturais do complexo anticorpo-proteína A e avaliar a sua influência na topologia da superfície na adsorção, foi utilizada a técnica difracção de raios-X de pequeno ângulo (SAXS – do inglês small angle X-ray scattering). Foi usado um pequeno capilar de quartzo transparente aos raios-X em que foram empacotadas as resinas de proteína A. Foi possível acompanhar a formação da camada de anticorpo à superfície das resinas à medida que o anticorpo era introduzido. Foi demonstrada a possibilidade de ligação heterogénea dependendo da saturação da resina. Um modelo aplicado para interpretar os resultados foi o “broken rod model”, que sugere que as moléculas de anticorpo se ligam aos ligandos de proteína A no domínio mais exterior. Uma investigação posterior envolvendo diferentes concentrações de anticorpo foi realizada para avaliar a estequiometria de ligação em diferentes zonas da isotérmica. Os dados experimentais foram comparados com modelos cristalográficos reproduzindo o anticorpo e uma cadeia com quatro domínios de ligação semelhante à usada na resina MabSelect SuRe. Foi verificado que a baixas concentrações a estequiometria mais favorável é de 1:1 e que a concentrações intermédias 2:1 torna-se mais favorável, sendo sempre uma mistura de ambas. A estequimetria 3:1 foi igualmente testada e tida como possível, mas posteriormente desconsiderada como provável devido aos elevados efeitos estéricos presentes, pelo que esta condição carece de uma modelação mais avançada para poder ter em conta a flexibilidade das moléculas. Todos estes resultados confirmam a natureza heterogénea das resinas de proteína A.
A abordagem oferecida por esta tese permitiu avaliar in situ a adsorção de anticorpos a proteína A durante o passo cromatográfico de afinidade, no entanto pode ser aplicada a qualquer tipo de cromatografia e para qualquer tipo de biomolécula, permitindo assim, abrir portas a uma investigação mais aprofundada para todos os tipos de cromatografia de alta relevância industrial, onde compreender o mecanismo de ligação biomolécula-ligando é de extrema importância.
Palavras-chave
Anticorpos monoclonais; proteína A; cromatografia de afinidade; isotérmica de adsorção; shrinking core model; microcalorimetria de fluxo; entalpia de adsorção; raios-X de pequeno ângulo; broken rod model; pearl necklace model.
Abstract
The monoclonal antibody market has been growing rapidly in the past decades, and the number of therapeutic areas where monoclonal antibodies (mAbs) are employed has been increasing, with cancer and autoimmune diseases being the most represented. There are already more than 50 approved products, representing a staggering $100 billion in global sales. Because of this high demand, antibody manufacturing has been in constant evolution and asking for new, more efficient, and more optimized methods to be applied both in the upstream and downstream processing.
Protein A chromatography is step of choice of most of the pharmaceutical companies for the antibody capture in the downstream processing. It is a core unit operation that has been in constant evolution, with the new resins coming to the market having higher binding capacities than their predecessors and improved alkaline stability. Despite of this extensive improvement in Protein A resins, there are still some aspects that lack understanding and deep investigation, specifically the mechanism of interaction between the antibodies and the Protein A ligands, both under linear and overloaded conditions. This knowledge can be used for further enhancement of performance in the mAbs capture step.
The knowledge accumulated during the last decades by studying chromatography for proteins bioprocess development has shed some light to the mechanistic understanding of protein–ligand interactions, though based on indirect measurements. Chromatography processes in general are characterized with online and offline sensors that probe the concentration (UV detector), purity (SEC-HPLC), potency (SPR), and structure (MALS, CD) of the product, as well as conductivity and pH that can be measured directly in the chromatography stations (ÄKTA). However, none of these probes operate in situ, i.e. in the chromatographic column where the interaction occurs. The online sensors tackle the elution peak, and the offline sensors analyse the sample afterwards. Therefore, this research consists in a biophysical study on the antibody adsorption to commercial Protein A resins with in-situ sensors, which resulted in an improved understanding of antibody–Protein A interactions, both under linear and overloaded conditions.
Flow microcalorimetry was extensively used to retrieve the thermodynamic parameters during antibody adsorption. The microcalorimeter consists on a ID 6 mm × 6 mm column with two thermistors coupled on the column walls that are able to detect small changes in potential during a chromatographic process. The application of the technique to two commercial Protein A resins (MabSelect SuRe with a tetrameric Protein A ligand and TOYOPEARL AF-rProtein A HC with a hexameric Protein A ligand) showed an adsorption profile of exothermic nature with two sub-processes involved. The first and stronger moment was associated to the adsorption process itself. The second moment, less energetic, was associated either to reorganization of the antibody layer and the Protein A chain upon binding, or to antibody binding to a ligand where
an antibody molecule would already be bound. These interpretations were reinforced by the small angle X-ray scattering (SAXS) studies.
To characterize the changes in the antibody-Protein-A ligand complex and evaluate the influence of the surface topology on adsorption, SAXS was employed using a miniaturized, X-ray-transparent chromatography column packed with the resin. In this way, the protein absorption process could be followed and the formation of a protein layer on the chromatography resin fibres can be observed at the nanoscale and in a time-resolved manner. For the first time it was possible to directly correlate the nanostructure changes inside the column, upon adsorption and during elution. It was demonstrated the possibility of heterogeneous binding throughout the bead network depending on the resin saturation. By application of the broken rod model and under resin saturation it was proposed that an average of 1.2 antibodies adsorb per Protein A ligand in MabSelect SuRe at the outermost domains. Further investigation was performed at different surface concentrations in order to evaluate differences in the organization and stoichiometry in the different zones of the isotherm. The experimental data, analysed by the pearl necklace model, was compared with crystallographic structures of an IgG1 and a tetrameric chain of the B domain of Staphylococcal Protein A (the native form of the Protein A ligand present in MabSelect SuRe). It was found that at low isotherm concentrations the antibody to Protein A ratio was 1:1 and that at intermediate and high concentrations the 2:1 stoichiometry became favoured. The stoichiometry of 3:1 was also tested but was disregarded because of the strong steric effects.
The offered approach in this thesis follows the adsorption process in situ, in the column and opens up new prospects to deeper investigation of all modes of chromatography of high industrial relevance, where the understanding of biomolecule–resin mechanism of interaction is of utmost importance.
Keywords
Monoclonal antibodies; Protein A; affinity chromatography; adsorption isotherm; shrinking core model; flow microcalorimetry; adsorption enthalpy; small angle X-ray scattering; broken rod model; pearl necklace model.
List of publications
I. Antibody adsorption in Protein A affinity chromatography – In situ measurement of nanoscale structure by small angle X-ray scattering
Jacek Plewka, Gonçalo L. Silva, Rupert Tscheließnig, Harald Rennhofer, Cristina Dias-Cabral, Alois Jungbauer, Helga Lichtenegger
Published in Journal of Separation Science 2019; 41:4122-4132 (DOI: 10.1002/jssc.201800776)
II. Antibody binding heterogeneity of Protein A resins
Gonçalo F. L. Silva, Jacek Plewka, Rupert Tscheließnig, Helga Lichtenegger, Alois Jungbauer, Ana C. M. Dias-Cabral
Published in Journal of Biotechnology 2019; 1800632:1-8 (DOI: 10.1002/biot.201800632) III. The pearl necklace model in Protein A chromatography – molecular mechanisms at
the resin interface
Gonçalo L. Silva, Jacek Plewka, Helga Lichtenegger, Cristina Dias-Cabral, Alois Jungbauer, Rupert Tscheließnig
Published by Biotechnology and Bioengineering 2019; 116:76-86 (DOI: 10.1002/bit.26843)
List of communications
Oral communications
I. 3D model of antibody-protein A complex rearrangement on the surface of commercial affinity resins
Goncalo Silva, Alois Jungbauer, Rupert Tscheließnig Affinity (2019) Stockholm, Sweden
II. 3D model of antibody adsorption on TOYOPEARL AF-rProtein A HC and Mabselect SuRe
Goncalo Silva, Jacek Plewka, Helga Lichtenegger, Ana C. Dias‐Cabral, Alois Jungbauer, Rupert Tscheließnig
HIC/DSP Bioseparation Conference (2019) Interlaken, Switzerland
III. Structural and thermodynamic characterization of antibody-staphylococcal Protein A complex on chromatography surface
G. L. Silva, A. C. Dias-Cabral, A. Jungbauer, R. Tscheließnig
European Symposium on Biochemical Engineering Sciences (ESBES) (2018) Lisbon, Portugal
IV. 3D structure of the antibody-staphylococcal Protein A complex on chromatography surface by small angle X-ray scattering and molecular simulation
G. L. Silva, A. C. Dias-Cabral, A. Jungbauer, R. Tscheließnig
International Symposium on Preparative and Process Chromatography (PREP) (2018) Baltimore, USA
V. Thermal and structural analysis of mAb binding to Protein A in affinity chromatography
G. L. Silva, J. Plewka, R. Tscheließnig, A. Jungbauer, A. C. Dias-Cabral
Biopartitioning and Purification Conference (BPP) (2017) Copenhagen, Denmark VI. Online and in situ monitoring of mAb adsorption on Protein A chromatography resins
G. L. Silva, J. Plewka, R. Tscheließnig, H. Lichtenegger, A. C. Dias-Cabral, A. Jungbauer International Congress in Health Sciences Research: Trends in Biotechnology for Biomedical Applications (2017) Covilhã, Portugal
VII. Thermodynamic overview of mAb adsorption on Protein A
G. L. Silva, A. Rodler, R. Tscheließnig, A. Jungbauer, A. C. Dias-Cabral
International Symposium on the Separation of Proteins, Peptides & Polynucleotides (ISPPP) (2016) Salzburg, Austria
Poster communications
I. Thermal and structural analysis of mAb binding to Protein A in affinity chromatography
G. L. Silva, J. Plewka, R. Tscheließnig, A. Jungbauer, A. C. Dias-Cabral European Summit of Industrial Biotechnology (ESIB) (2017) Graz, Austria
List of figures
Figure I.1 – Schematic representation of mouse hybridization in the manufacturing of monoclonal antibodies (adapted from Ezzell, 2001).
4
Figure I.2 – Representation of the types of mAbs according to its origin (adapted from Ezzell, 2001).
5
Figure I.3 – A) Crystallographic structure of an IgG1 (1HZH.pdb) showing the fragment crystallizable region (Fc) and the antigen-binding fragment (Fab). The antibody is subdivided into two heavy chains and two light chains, represented with the lower index H and L respectively. The constant and variable regions are also indicated with C and V respectively. Linked to the N-terminus of each of the heavy chains in aspargine 297 are a series of carbohydrates, which have a core common to all human IgG; B) Core of glycans bound to Asn 297 of the heavy chains.
15
Figure I.4 – Crystallographic representation of the Protein A antibody-binding B-domain to the Fc region in the hinge between CH2 and CH3.
16
Figure I.5 – Representation of adsorption isotherms and the contribution of its parameters to the adsorption behavior.
19
Figure I.6 – Generalized van Deemter equation and plot and the controlling mechanisms in each range.
21
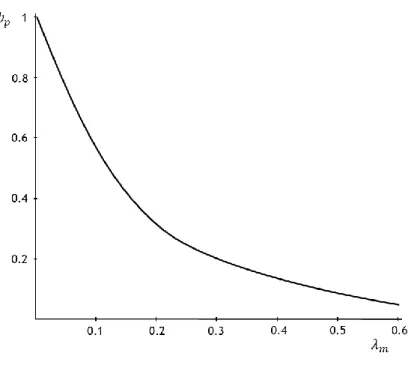
Figure I.7 – Diffusional hindrance coefficient vs. ratio of protein and pore radii. 24
Figure I.8 – Schematic representation of SAXS principle. 32
Figure I.9 – Characteristic scattering intensity curve of a globular protein. 32 Figure I.10 – Representation in real space of the density distributions from Fig. I.7. 33
Figure II.1.1 – Schematic of a SAXS column. 57
Figure II.1.2 - A: Chromatograph of the 280 nm UV signal (green) and conductivity (brown) for the protein-A run. B: Scattering profiles for antibody-free MabSelect SuRe resin (blue) and saturated resin (orange). The transition of the shoulder visible at q=0.2 nm-1 for antibody-free resin to saturated resin is highlighted by the arrow. Additionally, regions for dimensionality and Porod fits are indicated.
59
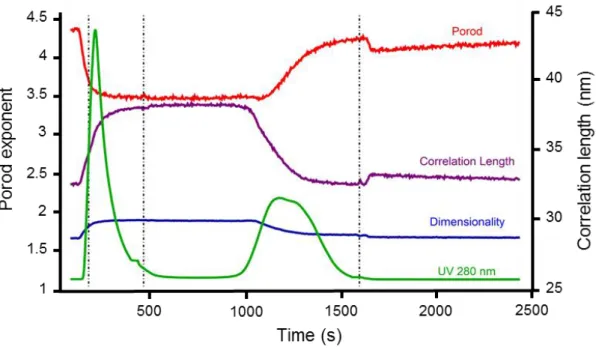
Figure II.1.3 - Comparison of overall fitting parameters for the SAXS time series overlaid on top of the UV signal.
Figure II.1.4 - A: An overlay of Euclidean circles representing the feature diameters within the first plane of the MabSelect SuRe internal agarose network over a SEM picture. Green circles represent radii between 3 and 15 nm, red circles represent radii of 15 to 70 nm. B: A histogram of normalized radii distribution from the semi-automated feature detection algorithm. Green peak is attributed mean fiber thickness, the red peak to junctions between strands.
62
Figure II.1.5 - Visual representation of the broken rod model for an agarose network with infinitely long fibers cross-linked to create junctions. Red, center of agarose fibers in the first plane; blue, edges of fibers.
64
Figure II.1.6 - A: Fit of broken rod model (black) to corresponding scattering profiles. Due to good agreement between data and fit it lays directly on top of the data points. B: Evolution of the radii of strands (blue) and junctions (purple) with their corresponding size distribution during a protein-A chromatography run.
64
Figure II.1.7 - Structural interpretation of protein layer thickness development throughout the protein-A chromatography run. Protein-A ligand tetramers (in red) are attached to the agarose strand (orange). All entities are in scale to facilitate size comparison.
66
Figure II.S.1 - Size exclusion chromatography of Herceptin solution showing single peak, which indicates that used antibody solution was monomeric.
72
Figure II.S.2 - Comparison of protein-A runs A,B from BM26B beamline and C from BM29 at ESRF, France. Top panel presents fitting parameters like Porod exponent (red), correlation length (purple) and dimensionality (blue), whereas bottom panel shows corresponding UV 280 nm signal (green) and conductivity (brown). Note, that different chromatography system used at BM29 resulted in different spreading of the features in chromatograph, but similar values for Power law fitting.
73
Figure II.S.3 - Scattering profile for antibody-free MabSelect SuRe resin in blue, region where Porod was fitted in orange.
74
Figure II.S.4 - Overlay of scattering profiles from 125s to 1000 s every 10 s. The peak for the overload in UV is visible at 132s. No difference is seen between the scattering patterns during overloading, which indicates that freely floating monoclonal antibodies are not visible in our SAXS signal due to the low concentration in bulk solution.
Figure II.S.5 - Comparison of different model fits (in black) to Antibody-free (blue) and Saturated (orange) MabSelect SuRe resin scattering profiles.
74
Figure II.2.1 - Adsorption isotherms of antibody in Na-phosphate buffer 0.02 M + NaCl 0.15 M at pH 7.4 on the resins MabSelect SuRe (full triangles) and TOYOPEARL AF-rProtein A HC (full circles). Incubation of 0.01-10 mg.mL -1 antibody in a bulk volume of 0.25 mL with 10% resin for 24 h at 250 rpm. Data were fitted with Langmuir model for MabSelect SuRe (dashed line) and TOYOPEARL AF-rProtein A HC (full line).
84
Figure II.2.2 - Batch adsorption kinetics of antibody at 𝐶0 = 0.75 mg.mL-1 and 𝐶
0 = 1.5 mg.mL-1 in Na-phosphate buffer 0.02 M + NaCl 0.15 M at pH 7.4 on the resins MabSelect SuRe (MSS) and TOYOPEARL AF-rProtein A HC (TP PA); a) adsorbed concentration, 𝑞, over time; b) dimensionless solution concentration, 𝐶 𝐶⁄ 0, over time. Solid lines represent the uptake prediction based on the shrinking core model.
87
Figure II.2.3 - Heat exchange profile of antibody adsorption on MabSelect SuRe at concentrations in the linear range of the isotherm for different surface concentrations: a) 1.0 mg.mL-1 resin; b) 5.4 mg.mL-1 resin; c) 10.9 mg.mL -1 resin; and d) 26.6 mg.mL-1 resin. Equilibrium with Na-phosphate buffer 0.02 M + NaCl 0.15 M at pH 7.4 and 0.01 mL antibody injection prepared in the same buffer; flow rate was 1.5 mL.h-1. Peak deconvolution was done with EMG functions using PaeakFit v4 software, with the first peak shown in a blue dashed curve, the second peak in a red dashed curve, and the overall net heat in a black full curve. The bed volume starting in the first moment of contact between the antibody and the adsorbent is shown in a black dashed line, and the antibody injection pulsed is shown in a black dotted line.
Figure II.2.4 - Heat exchange profile of antibody adsorption on TOYOPEARL AF-rProtein A HC at concentrations in the linear range of the isotherm for different surface concentrations: a) 1.8 mg.mL-1 resin; b) 5.4 mg.mL-1 resin; c) 10.1 mg.mL-1 resin; and d) 13.7 mg.mL-1 resin. Equilibrium with Na-phosphate buffer 0.02 M + NaCl 0.15 M at pH 7.4 and 0.01 mL antibody injection prepared in the same buffer; flow rate was 1.5 mL.h-1. Peak deconvolution was done with EMG functions using PaeakFit v4 software, with the first peak shown in a blue dashed curve, the second peak in a red dashed curve, and the overall net heat in a black full curve. The bed volume starting in the first moment of contact between the antibody and the adsorbent is shown in a black dashed line, and the antibody injection pulsed is shown in a black dotted line.
89
Figure II.2.5 - Enthalpy of adsorption of antibody over surface concentration on a) MabSelect SuRe and b) TOYOPEARL AF-rProtein A HC. Enthalpy values were determined by integrating the heat profile curves from Figs. II.2.3 and II.2.4 and normalized for the adsorbed moles of antibody. The enthalpy associated to the first peak is shown in blue full circles, the enthalpy derived from the second peak in red crosses, and the overall adsorption enthalpy in full black triangles.
92
Figure II.3.1 - Schematic representation of the antibody (green disks) complexed with the Protein A ligand (red disks), their distribution across the resin network (grey rectangles), and the respective pair density distributions for form and structure factors. A) The green line is the hypothetical pair density distribution 𝑝𝑝(r) of the antibody in reference to the ligand; B) the hypothetical pair density distribution, 𝑝𝑠(r), of the agarose is presented by the red line. The hypothetical 𝑝𝑝(r) is superimposed by a green line for scale. The slope of the tangent at small r to 𝑝𝑠(r) is the fractal dimension 𝐷 of the agarose network.
Figure II.3.2 - A) SEM image of MabSelect SuRe resin. The red scale bar indicates a 500 nm distance. The insert is a magnification of a typical agarose strand. Strands are up to 34 nm in diameter. B) Binarized SEM image. The pores are identified as white areas and the agarose as grey. C) Random choice of 10000 pixels distributed across the agarose fractal network (red); D) random choice of 10000 pixels of SEM image (agarose fractal network and the pores – white noise) (blue); E) Magnification of the overlay of C) and D), where the red dots represent the random distribution of the agarose, and the blue dots the random distribution of the agarose and the pores; F) pair density distribution of both the fractal network (red) and white noise (blue); G) determination of the dimension of the fractal network (D = 0.74) and white noise (D = 1.02); H) subtraction of the pair density distribution of the fractal network and white noise: pore size distribution, with the largest being 80 nm.
109
Figure II.3.3 - A) Normalized scattering intensity (insert) from antibody in solution at 8 mg/mL (green), 16 mg/mL (red), and 30 mg/mL (blue). The respective pair density distributions plotted with the pair density distribution from the crystallographic structures 1HZH and 1IGT; B) overlay of the pair density distribution from the crystallographic structures 1HZH and 1IGT with the pair density distribution of the subtracted scattering intensities from the antibody in solution at 16 mg/mL and 8 mg/mL. We corrected the scattering data of 36 mg/mL by a factor to 𝑆(𝑄) = 𝑄−0.3.
110
Figure II.3.4 - A) The scattering intensity, 𝑃(𝑄), given as a function of the scattering vector, 𝑄 [1/nm], from antibody bound to MabSelect SuRe 0-80 mg/mL resin by gray disks. Fits are represented in black and evolve towards red with increasing antibody concentration. Insert shows the raw experimental datasets. The fractal dimension (D = 0.8) is determined from the slope of scattering data from blank resin at low Q (red dashed line); B) Radial density distribution computed from the scattering intensity plots from blank resin and antibody bound to MabSelect SuRe 0– 80 mg/mL resin. The resin signal is represented in black and evolves towards red with increasing surface concentration.
Figure II.3.5 - A) Background-corrected radial density distributions, 𝑝′(R). B) Surface excess computed from the normalized areas from 𝑅2 𝑝′(R) as a function of antibody equilibrium concentration (red disks). Adsorbed amount derived from the equilibrium state of the samples before X-ray exposure (blue disks). The insert shows the experimental determined adsorption isotherm of antibody adsorption to MabSelect SuRe (blue disks).
113
Figure II.3.6 - Rigid body models and radial density distributions of 1:1 antibody to Protein A stoichiometry. A) Selected configuration of the complex; the grey bead model indicates the resin; the red bead models mimic the MabSelect SuRe Protein A tetrameric chain; the green bead model marks the antibody. B) Radial density distributions computed from SAXS data (dark red to bright red lines) are compared to radial density distributions (blue line) computed from random walk models. The data enumerated 1-9 correspond to different antibody bulk concentrations, with the correspondence given in the text.
115
Figure II.3.7 - Rigid body models and radial density distributions of 2:1 antibody Protein A stoichiometry. A) Selected configuration of the complex; the grey bead model indicates the resin; the red bead models mimic the MabSelect SuRe Protein A tetrameric chain; the green bead model marks the antibody. B) Radial density distributions computed from SAXS data (dark red to bright red lines) are compared to radial density distributions (blue line) computed from random walk models. The data enumerated 1-9 correspond to different antibody bulk concentrations, with the correspondence given in the text.
116
Figure II.3.8 - Rigid body models and radial density distributions of 3:1 antibody Protein A stoichiometry. A) Selected configuration of the complex; the grey bead model indicates the resin; the red bead models mimic the MabSelect SuRe Protein A tetrameric chain; the green bead model marks the antibody. B) Radial density distributions computed from SAXS data (dark red to bright red lines) are compared to radial density distributions (blue line) computed from random walk models. The data enumerated 1-9 correspond to different antibody bulk concentrations, with the correspondence given in the text.
List of tables
Table I.1 - Table of approved mAbs as of 2017 (adapted from from Ecker et al., 2015 and from the Animal Cell Technology Industrial Platform, viewed 19 December 2018, < http://www.actip.org/products/monoclonal-antibodies-approved-by-the-ema-and-fda-for-therapeutic-use/>).
6-10
Table I.2 – Table of the top 10 biopharmaceuticals by revenue (adapted from Morrison & Lähteenmäki, 2017).
12
Table II.1.1 - Comparison of the radii of strands and junctions according to the broken rod model and resulting protein layer thickness.
63
Table II.S.1 - A default program for protein-A chromatography runs. CV stands for column volume, %B means percentage of elution buffer in the flow. Scattering profiles were collected every second throughout the run. Change to A and B means rapid flush of the pump with corresponding buffer A- running buffer, B- elution buffer. It was implemented into the system due to low flow rates that prevent fast exchange of the pump volume.
70
Table II.S.2 - Summary of data modelling with various models representing Chi^2 analysis and resulting radii.
List of abbreviations
𝐴(𝑄) scattering amplitude or angle 𝑄
𝐵𝑖 Biot number
𝑐 concentration in the pore liquid (g.L-1) 𝐶 equilibrium bulk concentration (g.L-1) CBS consensus binding site
CD circular dichroism
CIP cleaning-in-place
𝐶𝑠 concentration at the particle surface 𝐶0 initial bulk concentration (g.L-1)
DBC dynamic binding capacity 𝐷𝑒 effective diffusivity (cm2.s-1) DNA Deoxyribonucleic acis 𝑑𝑝 particle diameter (µm)
𝐷𝑝 effective diffusivity in the pore (cm2.s-1)
𝐷𝑠 effective diffusivity in the adsorbed phase (cm2.s-1) 𝐷0 diffusivity in free solution (cm2.s-1)
EMA European Medicines Agency
Fab antigen-binding fragment Fc fragment crystallisable region FDA Food and Drug Administration FMC flow microcalorimetry
HCP host cell protein
HER2 human epidermal growth factor receptor 2 HPLC high-performance liquid chromatography
ID internal diameter (mm)
IgG immunoglobulin G
ITC isothermal titration calorimetry 𝐼(𝑞) scattering intensity of angle 𝑞
𝐾 thermodynamic equilibrium constant 𝑘𝑎 on rate constant (L.g-1.s-1)
𝐾𝐴 association constant (L.g-1) 𝑘𝑑 off rate constant (s-1) 𝐾𝐷 dissociation constant (g.L-1)
𝑘𝑓 film mass transfer coefficient (cm.s-1)
mAbs monoclonal antibodies MALS multi-angle light scattering Mw molecular weight (g.mol-1, kDa) PAT process analytical technology PTFE polytetrafluoroethylene
𝑄 reaction quotient
Q scattering vector
𝑞 adsorbed concentration (g.L-1)
𝑞̅ average concentration in the particle (g.L-1) 𝑄𝑎𝑑𝑠 adsorption heat of the molecule to the resin (J)
QbD quality by design
𝑞𝑚 maximum adsorbed concentration (g.L-1)
𝑅 gas constant (J.mol-1.K-1)
𝑅𝑒 Reynolds number
𝑟𝑝 particle radius (µm)
SAXS small angle X-ray scattering
𝑆𝑐 Schmidt number
SEC size exclusion chromatography
𝑆ℎ Sherwood number
SPR surface plasma resonance
𝑡 time (s)
𝑇 temperature (K)
TAM thermometric activity monitor 𝑇𝐻 temperature at ∆𝐻0= 0 (K) 𝑇𝑆 temperature at ∆𝑆0= 0 (K)
UV ultraviolet
𝑣 resin volume (L)
𝑉 bulk liquid volume (L)
𝑣′ reduced linear velocity
δ stagnant film of thickness ∆𝐶𝑝0 heat capacity (J.K-1)
∆𝐺 Gibbs energy change (J.mol-1)
∆𝐺0 Gibbs energy change at standard temperature and pressure (J.mol-1) ∆𝐻 enthalpy change (J.mol-1)
∆𝐻𝑎𝑑𝑠 adsorption enthalpy of the molecule to the resin (J.mol-1) ∆𝐻0 enthalpy change at standard temperature and pressure (J.mol-1) ∆𝑆 entropy change (J.mol-1)
∆𝑆0 entropy change at standard temperature and pressure (J.mol-1)
𝜀 extraparticle porosity
𝜀 agitation power input
𝜀𝑝 intraparticle porosity
𝜂 solution viscosity (mPa.s)
𝜆 ratio between protein radius and pore radius
𝜆 wave length (nm)
𝛬 normalized phase ratio
𝜌 solution density (g.cm-3)
𝜌(𝑟) radial density distribution of distance 𝑟
𝜏𝑝 tortuosity factor
𝜙 phase ratio (ration between the volume of stationary phase and mobile phase)
Table of contents
CHAPTER I - Introduction ... 1
1. Downstream processing of monoclonal antibodies ... 3
1.1. Monoclonal antibodies ... 3
1.1.1. Trastuzumab ... 111.2. Protein A chromatography ... 12
1.2.1. Recombinant Protein A resins ... 13 1.2.2. IgG-Protein A complex ... 14
2. Understanding protein adsorption ... 17
2.1. Isotherms ... 18
2.2. Mass transfer ... 20
2.2.1. External transport ... 21 2.2.2. Intraparticle transport ... 22 2.2.3. Antibody transport in Protein A chromatography ... 242.3. Thermodynamics ... 27
2.3.1. Analysis based on the thermodynamic equilibrium constant ... 27 2.3.2. Microcalorimetric measurements ... 29
2.4. Small angle X-ray scattering ... 31
3. Objectives ... 35
4. References ... 37
CHAPTER II - Publications ... 45
Results ... 47
1. Publication I ... 51
Abstract ... 53
Keywords ... 53
1.1. Introduction ... 55
1.2. Methods and methods ... 56
1.2.1. Materials ... 56 1.2.2. Chromatography column for in situ small angle X-ray scattering ... 56 1.2.3. Protein-A chromatography run ... 57 1.2.4. In situ X-ray characterization ... 57 1.2.5. Scanning electron microscopy of agarose ... 581.3. Results and Discussion ... 58
1.3.2. Small angle X-ray scattering parameters reflecting protein adsorption ... 59 1.3.3. Time evolution of small angle X-ray scattering parameters ... 60 1.3.4. Protein layer thickness ... 62
1.4. Conclusions ... 68
1.5 References ... 69
1.6 Supplementary Information ... 72
2. Publication II ... 77
Abstract ... 79
Keywords ... 79
2.1. Introduction ... 81
2.2. Materials and Methods ... 82
2.2.1. Materials ... 82 2.2.2. Adsorption isotherms ... 83 2.2.3. Batch uptake kinetics ... 83 2.2.4. Flow Microcalorimetry ... 83 2.2.5. HPLC analysis ... 842.3. Results and Discussion ... 84
2.3.1. Langmuir adsorption isotherms ... 84 2.3.2. Batch uptake kinetics – shrinking core model ... 85 2.3.3. Adsorption heat profile ... 87 2.3.4. Adsorption enthalpy ... 90
2.4. Conclusions ... 93
2.5 References ... 94
3. Publication III ... 99
Abstract ... 101
Keywords ... 101
3.1. Introduction ... 103
3.2. Materials and Methods ... 104
3.2.1. Materials ... 104 3.2.2. Adsorption isotherms ... 104 3.2.3. Scanning electron microscopy ... 105 3.2.4. SAXS ... 1053.3. Modeling ... 105
3.3.1. A fractal pearl necklace model ... 105 3.3.2. The fractal network of the resin imposes a fractal structure factor ... 106 3.3.3. Bi-Langmuir adsorption ... 106
3.4. Results and Discussion ... 107
3.4.1. Scattering profiles ... 107 3.4.2. SEM ... 108 3.4.3. Antibody solution ... 109 3.4.4. The structure factor ... 111 3.4.5. The appropriate normalization of radial densities ... 112 3.4.6. Background corrected radial density distribution ... 112 3.4.7. Assessing the surface excess ... 113 3.4.8. Form of antibody-Protein A 3D complex by molecular simulation ... 1133.5. Conclusions ... 118
3.6 References ... 119
CHAPTER III - Conclusions ... 123
Conclusions ... 125
Future perspectives ... 127
CHAPTER I -
Introduction
1. Downstream processing of monoclonal antibodies
1.1. Monoclonal antibodies
In 1984, the Nobel Prize in Physiology or Medicine was awarded to the immunologists Georges J. F. Köhler and César Milstein for an innovative approach on “the manufacture of predefined specific antibodies by means of permanent tissue culture cell lines” – the hybridoma technique (Köhler & Milstein, 1975).
Antibodies are produced by white blood cells called B-lymphocytes. When the immune system recognizes a substance as foreign (called antigen) the B-lymphocytes are induced to produce antibodies against that specific antigen. In their study, Köhler and Milstein developed a method to fuse in culture antibody-producing B-lymphocytes of a mouse immunized with the targeted antigen with immortal tumor cells from mouse myeloma. The resulting cell line was, and still is, called hybridoma. These cells are therefore immortal (characteristic derived from the tumor cells) and producers of antigen-specific antibodies (derived from the original B-lymphocytes) (Ezzell, 2001; Van Dijk & Van De Winkel, 2001). This was the cornerstone to the manufacturing of monoclonal antibodies (mAbs). Figure I.1 represents the traditional technique to form the hybridoma cell line.
MAbs are produced continuously due to the hybridoma immortal characteristic. However, the greatest challenge in the expression of mAbs from hybridoma is that part of this cell line is of murine origin. This translates in limitations in the therapy, such as reduced serum half-life and a weak immune response, but mostly they can cause a human anti-mouse antibody reaction. In the most extreme cases these allergic reactions can cause kidney failure and, ultimately, death (ElBakri, Nelson, & Abu Odeh, 2010; Ezzell, 2001). The key to overcome this issue is to make the antibody more human though hybridization or humanization techniques. Hybridization techniques involve replacing regions of the murine antibodies (with exception to the Fab regions) with human parts, leading to a chimeric antibody ~66% human and ~33% mouse. Humanization involves selectively replacing the mouse parts with human parts (including the Fab regions) using genetic engineering, leading to an antibody ~90% human. In 2001, Karpas et al. were able to generate a fully human monoclonal antibody “from human myeloma line suitable for hybridoma” (Karpas, Dremucheva, & Czepulkowski, 2001). Since then, the approved human mAbs have already outnumbered the other three mAb types. Figure I.2 shows a representation of the human and mouse parts present in the four types of mAbs (Ezzell, 2001).
Figure I.1 – Schematic representation of mouse hybridization in the manufacturing of monoclonal antibodies (adapted from Ezzell, 2001).
Figure I.2 – Representation of the types of mAbs according to its origin (adapted from Ezzell, 2001).
The first commercialized therapeutic mAb product was Orthoclone OKT3 back in 1986. This mAb was used in the prevention of kidney transplant rejection (Ecker, Jones, & Levine, 2015). Since 1986, the monoclonal antibody market has dramatically increased. However, the predictions were not entirely accurate. In 2001 analysts predicted that 100 mAbs would be on the market by the year 2010 (Ezzell, 2001). However, in 2008, despite nearly 150 human mAbs were entering clinical studies, only 20 had been approved and were on the market (and not only human). As of 2017 there are 50 products that have been approved by both the U.S. Food and Drug Administration (FDA) and the European Medicines Agency (EMA). Table I.1 summarizes the approved mAbs by both agencies along with their therapeutic indications, manufacturing company, expression cell line, and type of mAb (Ecker et al., 2015; Elvin, Couston, & van der Walle, 2013).
In recent years, mAbs cover already a wide range of therapeutic areas, being oncology, autoimmune and inflamm atory diseases the most predominant (Elvin et al., 2013). The antibody market has been rapidly growing. In 2010, the mAb market returned a global sales revenue of 43 billion U.S. dollars (Elvin et al., 2013). In 2013 it reached $75 billion. Also, from the top ten biopharmaceuticals with the most revenue worldwide in 2016, four are mAbs (Morrison & Lähteenmäki, 2017): Humira® (Abbvie) (#1), Rituxan® (Roche/Genentech) (#3), Avastin® (Roche/Genentech) (#5) and Herceptin® (Roche/Genentech) (#6).
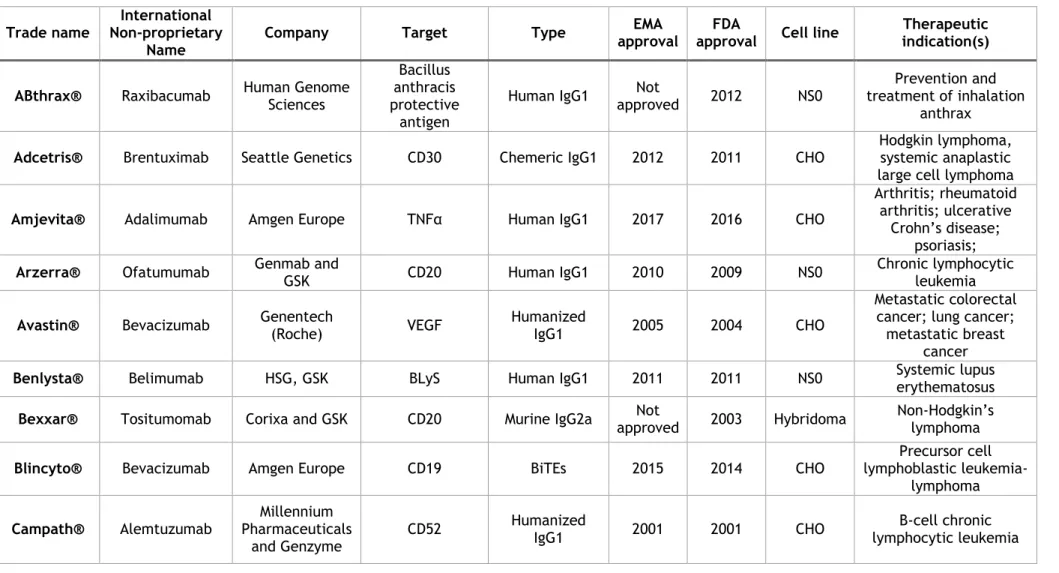
Table I.1 - Table of approved mAbs as of 2017 (adapted from (Ecker et al., 2015) and from the Animal Cell Technology Industrial Platform, viewed 19 December 2018, <http://www.actip.org/products/monoclonal-antibodies-approved-by-the-ema-and-fda-for-therapeutic-use/>).
Trade name Non-proprietary International
Name Company Target Type
EMA approval
FDA
approval Cell line
Therapeutic indication(s) ABthrax® Raxibacumab Human Genome Sciences
Bacillus anthracis protective
antigen
Human IgG1 approved Not 2012 NS0 treatment of inhalation Prevention and anthrax
Adcetris® Brentuximab Seattle Genetics CD30 Chemeric IgG1 2012 2011 CHO Hodgkin lymphoma, systemic anaplastic large cell lymphoma
Amjevita® Adalimumab Amgen Europe TNFα Human IgG1 2017 2016 CHO
Arthritis; rheumatoid arthritis; ulcerative
Crohn’s disease; psoriasis;
Arzerra® Ofatumumab Genmab and GSK CD20 Human IgG1 2010 2009 NS0 Chronic lymphocytic leukemia
Avastin® Bevacizumab Genentech (Roche) VEGF Humanized IgG1 2005 2004 CHO
Metastatic colorectal cancer; lung cancer; metastatic breast
cancer
Benlysta® Belimumab HSG, GSK BLyS Human IgG1 2011 2011 NS0 Systemic lupus erythematosus
Bexxar® Tositumomab Corixa and GSK CD20 Murine IgG2a approved Not 2003 Hybridoma Non-Hodgkin’s lymphoma
Blincyto® Bevacizumab Amgen Europe CD19 BiTEs 2015 2014 CHO
Precursor cell lymphoblastic
leukemia-lymphoma Campath® Alemtuzumab Pharmaceuticals Millennium
and Genzyme
Cimzia® Certolizumab pegol UCB TNFa Humanized IgG Fab fragment 2009 2008 E. coli rheumatoid arthritis Chron’s disease; Cinqair™ Reslizumab Pharmaceuticals Teva
Limited IL-5 Human IgG4/κ 2016 2016 NSO Asthma
Cosentyx™ Secukinumab Europharm Novartis interleukin-17A Human IgG1/κ 2015 2015 CHO psoriasis; spondylitis; Arthritis; psoriatic ankylosing
Cyramza Ramucirumab Eli Lilly VEGF Human IgG1 2014 2014 NS0 Stomach neoplasms
Darzalex® Daratumumab Janssen-Cilag CD38 Human IgG1/κ 2016 2015 CHO Multiple myeloma
Empliciti Elotuzumab Bristol-Myers Squibb SLAMF7 Human IgG1 2016 2015 NS0 Multiple myeloma
Entyvio® Vedolizumab Takeda Pharma Integrin-α4β7 HumanizedIgG1 2014 2014 CHO Colitis; ulcerative Crohn’s disease Erbitux® Cetuximab Serono and BMS ImClone, Merck EGFR Chimeric IgG1 2004 2004 Sp2/0 Head and neck cancer; colorectal cancer
Gazyvaro® Obinutuzumab Roche CD20 Humanized IgG1 approved Not 2013 CHO Chronic lymphocytic leukemia
Herceptin® Trastuzumab Genentech (Roche) HER-2 Humanized IgG1 2000 1998 CHO
Breast cancer; metastatic gastric or
gastroesophageal junction adenocarcinoma
Humira® Adalimumab Abbott TNFα Human IgG1 2003 2002 CHO
Rheumatoid arthritis; ankylosing spondylitis;
Crohn’s disease
Ilaris® Canakinumab Novartis IL-1ß Human IgG1 2009 2009 Sp2/0
Tumor necrosis factor receptor associated periodic syndrome; familial mediterranean
Inflectra Infliximab Hospira UK Limited TNFα human-murine Chimeric IgG1 2013 2016 Sp2/0-Ag14 Spondylitis; arthritis; rheumatoid colitis; ulcerative arthritis; psoriasis
Kadcyla® Trastuzumab emtansine Roche HER2 IgG1 as ADC Humanized 2013 2013 CHO Breast cancer
Keytruda® Pembrolizumab Dohme Limited Merck Sharp & PD-1 Human IgG4 2015 2014 CHO Melanoma
Lartruvo Olaratumab Eli Lilly PDGFR-α Human IgG1 2016 2016 CHO Sarcoma
Lemtrada® Alemtuzumab Sanofi CD52 Humanized IgG1 2013 2014 CHO Multiple sclerosis
Lucentis® Ranibizumab Genentech (Roche) VEGF-A Humanized IgG1 Fab
fragment 2007 2006 E. coli
Neovascular age-related macular degeneration
Nucala Mepolizumab GlaxoSmithKline IL-5 Human IgG1/κ 2015 2015 CHO Asthma
Opdivo Nivolumab Squibb Pharma Bristol-Myers PD-1 Human IgG4 2015 2015 CHO
Carcinoma; lung carcinoma; renal cell
Hodgkin disease melanoma Orthoclone OKT3® Muromonab-CD3 Centocor Ortho Biotech (Johnson & Johnson)
CD3 Murine IgG2a 1986 1986 Hybridoma Transplantation rejection
Perjeta® Pertuzumab Roche HER2 Humanized IgG1 2013 2012 CHO Breast cancer
Portrazza Necitumumab Eli Lilly EGFR Human IgG1 2016 2015 NS0 Carcinoma, non-small-cell lung
Praluent Alirocumab sanofi-aventis groupe PCSK9 Human IgG1 2015 2015 CHO Dyslipidemias
Praxbind® Idarucizumab Boehringer Ingelheim International GmbH dabigatran
Prolia® Denosumab Amgen RANKL Human IgG2 2010 2010 CHO Osteoporosis Proxinium® Catumaxomab Biotherapeutics) Viventia (Eleven EpCAM Humanized MAb 2005 2005 CHO Head and neck cancer
Remicade® Infliximab Centocor Ortho Biotech (Johnson & Johnson) TNFα Chimeric IgG1 1999 1998 Sp2/0 Crohn’s disease; ulcerative colitis; rheumatoid arthritis; psoriatic arthrits
Removab® Catumaxomab Fresenius EpCAM and CD3
Trifunctional MAb IgG2a /
IgG2b 2009
Not
approved hybridoma Mouse
Malignant ascites in patients with positive
carcinomas Remsima® Infliximab Healthcare Celltrion TNF-alpha Chimeric IgG1 Ab 2013 approved Not Ps0006
CSC-Spondylitis; ankylosing arthritis; rheumatoid colitis; psoriatic psoriasis ReoPro® Abciximab Centocor Ortho Biotech (Johnson & Johnson), Elli Lily
GPIIb/IIIa Chimeric IgG1 Fab 1995 1994 Sp2/0 High risk angioplasty
Repatha® Evolocumab Amgen LDL-C / PCSK9 Human IgG2 2015 2015 CHO hypercholesterolemia Dyslipidemias;
Rituxan®
MabThera® Rituximab
Biogen Idec, Genentech
(Roche)
CD20 Chimeric IgG1 1998 1997 CHO
Non-Hodgkin’s lymphoma; lymphocytic
leukemia; rheumatoid arthritis
RoActemra® Tocilizumab Chugai (Roche) IL-6 receptor Humanized IgG1 2009 2010 CHO Rheumatoid arthritis
Simponi® Golimumab
Centocor Ortho Biotech (Johnson &
Johnson)
TNFa Human IgG1 2009 2009 Sp2/0 Rheumatoid arthritis; psoriatic arthritis; ankylosing spondylitis
Simulect® Basiliximab Novartis CD25 Chimeric IgG1 1998 1998 NS0 transplantation Reversal of
Soliris® Eculizumab Pharmaceuticala Alexion Complement C5 Humanized IgG2/4 2007 2007 NS0 Paroxysmal nocturnal hemoglobinuria Stelara® Ustekinumab Centocor Ortho Biotech (Johnson & Johnson)
IL-12 / IL-23 Human IgG1 2009 2009 Sp2/0 Plaque psoriasis
Sylvant® Siltuximab Janssen-Cilag International cCLB8 Chimeric IgG1κ 2014 2014 CHO Giant lymph node hyperplasia Synagis® Palivizumab MedImmune, Abbott F-protein of RS virus Humanized IgG1 1999 1998 NS0 Respiratory syncytial virus Tysabri® Natalizumab Biogen Idec and Elan VLA-4 Humanized IgG4 2006 2004 myeloma Murine Multiple sclerosis; Crohn’s disease
Vectibix® Panitumumab Amgen EGFR Human IgG2 2007 2006 CHO Metastatic colorectal carcinoma
Vervoy® Ipilimumab BMS CTLA-4 Human IgG1 2011 2011 CHO Melanoma
Xolair® Omalizumab (Roche) and Genentech Novartis
IgE Humanized IgG1 2005 2003 CHO Asthma
Zevalin® Ibritumomab tiuxetan Biogen Idec CD20 Murine IgG1 2004 2002 CHO Non-Hodgkin’s lymphoma
Zinplava™ Bezlotoxumab Dohme Limited Merck Sharp & C. Difficile; toxin B
Human monoclonal
antitoxin antibody
1.1.1. Trastuzumab
Trastuzumab (Genentech, South San Francisco, CA, USA) was the monoclonal antibody used in the present study. It is a DNA-derived recombinant immunoglobulin G1 (IgG1) of the subclass kappa that binds to the HER2 receptors overexpressed in the breast cancer cells (Goldenberg, 1999). HER2 (also known as Neu, ERBB2) is a proto-oncogene that encodes a transmembrane glycoprotein receptor tyrosine kinase similar to the human epidermal growth factor receptor 2, HER2 (or Erb-B2 receptor tyrosine kinase 2). HER2 is located on the cell surface, interacting with growth factors. An overexpression is correlated with the presence of primary human breast carcinomas (Cho et al., 2003; Goldenberg, 1999) and its amplification serves better as prognostic to lymph-node positives than other factors like hormonal-receptor status (Slamon et al., 1987).
The construction of trastuzumab (Goldenberg, 1999) is based on the humanized antibody humAb4D5 (Carter et al., 1992), which predecessor was the murine mAb mumAb4D5 which directs against the extracellular domain of the human epidermal growth factor receptor 2 (p185HER2), inhibiting the proliferation of tumor cells overexpressing this protein (Carter et al., 1992).
Trastuzumab has been approved in 1998 by the FDA and in 2000 by the EMA, and it is used in treatments for breast cancer, being the 4th largest-selling mAb and the 6th in the biopharmaceutical global market generating a revenue of $6,900 million worldwide (Morrison & Lähteenmäki, 2017) (Table I.2).
Table I.2 – Table of the top 10 biopharmaceuticals by revenue (adapted from (Morrison & Lähteenmäki, 2017)).
Name Lead company Molecule type sales ($ millions) 2016 worldwide
Humira AbbVie mAb 16,078
Harvoni Sciences Gilead molecule Small 9,081 Rituxan
(rituximab) Roche mAb 7,454
Revlimid Celgene molecule Small 6,974
Avastin Roche mAb 6,901
Herceptin Roche mAb 6,900
Enbrel Amgen Protein 6,817
Prevnar 13 Pfizer Vaccine 5,718
Lantus (insular
glargine injection) Sanofi Peptide 5,287
Neuplasta
(pegfilgrastim) Amgen Peptide 4,658
1.2. Protein A chromatography
Protein A chromatography has been optimized over the years and is now the best established technique for antibody capture directly from cell culture supernatant at a pH close to physiological conditions (Bolton, Street, & Mehta, 2016). At these conditions, the antibodies bind reversibly to the Protein A ligands (Shukla, Hubbard, Tressel, Guhan, & Low, 2007). In a single step a high degree of purity and recovery can be achieved (Fahrner et al., 2001; Shukla et al., 2007). In a review paper, Pete Gagnon names three features that contribute to Protein A resins dominance in antibody purification market: induced fit; multi-point attachment and ligand flexibility; and a long track of years of vendor competition to maximize capacity (Gagnon, 2012).
Despite all the advantages of Protein A chromatography, it has also some limitations, starting with the cost of the resin, which is the most expensive material in the purification of mAbs (Z. Liu, Mostafa, & Shukla, 2014). This leads to the search for strategies for column reutilization. Another limitation is the fact that elution needs to be carried at low pH, which also works as a viral inactivation step, but generates aggregates (Kelley, 2009; H. F. Liu, Ma, Winter, & Bayer, 2010; Shukla et al., 2007). Some impurities are removed to some extent from the cell supernatant during the capture, intermediate, and polishing steps, namely host cell protein (HCP), DNA, viruses, endotoxins, and aggregates (H. F. Liu et al., 2010). Others are introduced during the purification process itself and should also be taken into account, such as: leached Protein A, antibody aggregates, buffers, and detergents (H. F. Liu et al., 2010). However, subsequent intermediate and polishing steps will tackle the remainder impurities (Shukla et al., 2007).
Sanitization is a very important step of antibody-Protein A capture step. The cleaning-in-place (CIP) step consists in the use of harsh cleaning agents or detergents for the removal of tightly bound or precipitated contaminants. The use of such agents, like sodium hydroxide (NaOH), can ultimately lead to loss in the binding capacity (Hober, Nord, & Linhult, 2007; M. S. Lin et al., 2007; Linhult et al., 2004; Yang, Biswas, & Chen, 2003) and lifetime (Hahn et al., 2005a; Hale, Drumm, Harrison, & Phillips, 1994; Jiang, Liu, Rubacha, & Shukla, 2009). NaOH at 0.1 up to 0.5 M are the most used column sanitization conditions, being also effective in the inactivation of bacteria, viruses, and endotoxins (Hober et al., 2007).
In the development of a Protein A capture step, one has to take certain factors into consideration such as column dimensions, flow rate, resin cost, and processing time (H. F. Liu et al., 2010). Commercial resins change in their backbone, bead and pore size, and source of Protein A and chain length. The choice of a Protein A resin and its characteristics depends on the application. In early clinical development high dynamic binding capacity has to be considered, and in commercial operations the choice would lie more on a resin with decreased processing time (due to economic reasons) (Ghose, Nagrath, Hubbard, Brooks, & Cramer, 2004; Z. Liu et al., 2014). Considering the costs of Protein A resins, the production rate is an important parameter to take into consideration. High dynamic binding capacities help minimizing the resin volumes needed and the ability to withstand high flow rate helps reducing the cycle times.
1.2.1. Recombinant Protein A resins
Native Protein A is found in the cell wall of Staphylococcus aureus. It has 42 kDa and contains five homologous IgG-binding domains; from the N-terminal: E, D, A, B, and C. All these domains have high selectivity and strong affinity to every IgG isotype, with exception to IgG3. Protein A chromatography is acknowledged as the most costly step in downstream processing, mostly because the resins are not used to their full lifetime extent (Z. Liu et al., 2014). Early generations of Protein A resins contained as a ligand native forms of Staphylococcal Protein A (Pabst, Thai, & Hunter, 2018). In the current resins, manufacturers have made some improvements namely in the binding capacity and alkaline stability.
Through certain point mutations in the Protein A domains alkaline stability was drastically improved, resins now are able to withstand higher sodium hydroxide concentrations for short periods of time for more than 150 CIP cycles without capacity loss (Z. Liu et al., 2014; Pabst et al., 2018).
Increased dy namic binding capacity was achieved by improving static binding capacity by ligand modification with the implementation of repetitive units of Protein A antibody-binding domains (Müller & Vajda, 2016; Roman & Berensmeier, 2014) and with increase in ligand density (McCue, Kemp, Low, & Quiñones-García, 2003). Dynamic binding capacity (DBC) was also increased by reducing mass transfer resistance (Hahn et al., 2005; Hahn, Schlegel, & Jungbauer, 2003; Z. Liu et al., 2014; Perez-Almodovar & Carta, 2009).
Two of the commercially available Protein A resins most used for antibody capture directly from feedstocks are MabSelect SuRe (GE Healthcare) and TOYOPEARL AF-rProtein A HC (Tosoh). In the manufacturing of MabSelect SuRe, the native Protein A B domain was synthetically modified generating the so called Z domain. Each ligand comprises four repetitive units of the Z domain. TOYOPEARL AF-rProtein A HC contains a ligand of six repetitive units of the synthetically engineered Y domain, derived from the native C domain.
1.2.2. IgG-Protein A complex
As mentioned, mAbs are in their great majority full human or humanized IgGs. IgGs are a group of large globular proteins constituted by three subunits: two identical antigen-binding fragments (Fab) and one easily crystallizable fragment (Fc) (Salvalaglio, Zamolo, Busini, Moscatelli, & Cavallotti, 2009; Sandin, Öfverstedt, Wikström, Wrange, & Skoglund, 2004; Saphire et al., 2003). The Fc is connected to the Fab domains by a hinge region that consists of two disulphide bridges between cysteine residues, granting the antibody flexibility depending on the length of the hinge. The light and heavy chains are also connected by a disulphide bridge. This region is primarily where the different IgG subclasses differ (Rayner et al., 2015). The hinge length is connected to the IgG functionality and naturally with their flexibility. Of the four subclasses of IgG, IgG1 is the most abundant in the serum. This subclass corresponds to ~68% of the mAbs in the market, namely because it binds to every class of Fcγ receptor and because of the high specificity and affinity of the antigen to their Fab (Rayner et al., 2015). A representation of an IgG1 can be seen in Figure I.3 (1HZH.pdb).
The antibody binding to Protein A occurs through a hydrophobic region between CH2 and CH3 domains of the Fc known as “consensus binding site” (CBS) through van der Waals and electrostatic interactions in the CH2 domain, and through electrostatic interactions in the CH3 domain (Deisenhofer, 1981; DeLano, Ultsch, de Vos, & Wells, 2000; Gagnon, Nian, Leong, & Hoi, 2015; Salvalaglio et al., 2009; Shukla et al., 2007). Figure I.4 shows a representation of the antibody-binding B-domain of Protein A bound to the Fc region through the hinge between CH2 and CH3 (the crystallographic structure was developed by Deisenhofer, 1FC2.pdb)
Figure I.3 – A) Crystallographic structure of an IgG1 (1HZH.pdb) showing the fragment crystallizable region (Fc) and the antigen-binding fragment (Fab). The antibody is subdivided into two heavy chains and two light chains, represented with the lower index H and L respectively. The constant and variable regions are also indicated with C and V respectively. Linked to the N-terminus of each of the heavy chains in aspargine 297 are a series of carbohydrates, which have a core common to all human IgG; B) Core of glycans bound to Asn 297 of the heavy chains.
Figure I.4 – Crystallographic representation of the Protein A antibody-binding B-domain to the Fc region in the hinge between CH2 and CH3 (1FC2.pdb).
2. Understanding protein adsorption
The importance of mAbs to the therapeutic market has been increasingly growing (Marichal-Gallardo & Álvarez, 2012; Morrison & Lähteenmäki, 2017) with associated need for the production of high product volumes. Besides, downstream scientists and engineers face a plethora of other technical, economic, and product safety challenges imposed by regulatory agencies. The internationally accepted regulatory approaches for the manufacturing of pharmaceuticals require a control through Quality by Design (QbD) and Process Analytical Technology initiatives (PAT) (Mhatre & Rathore, 2009). These initiatives request a deep understanding of the biomolecule critical quality attributes affecting its safety and efficacy profile as well as a comprehension of the process design space, where the final product meets the necessary criteria for efficiency and safety. These requirements have rendered univariate optimization and trial-and-error-based chromatographic process development largely obsolete (Hanke & Ottens, 2014), calling for the use of mechanistic approaches, derived from fundamental principles and reflecting a higher level of understanding.
Studying preparative chromatography involves a detailed investigation of the physical chemistry fundamentals, considering the equilibrium and the kinetic effects. Most mechanistic approaches describing chromatographic separations consist of two parts: equations describing the fluid flow and mass transfer in the column, and a model to describe the interactions between the sample and the support in the form of adsorption isotherms. Furthermore, for the establishment of consistent models, the biomolecule–resin mechanism of interaction should be understood.
In particle chromatography, protein adsorption to stationary phases is a complex phenomenon that comprises multiple steps and depends on various factors. Giorgio Carta and Alois Jungbauer describe extensively in their book “Protein Chromatography” (Carta & Jungbauer, 2010), in the chapter of Adsorption Equilibria, factors present during protein adsorption that affect prediction theoretical models, namely: 1) heterogeneous distribution of the charged and the hydrophobic groups in the proteins (proteins cannot be considered spherical particles with homogeneous binding character); 2) protein unfolding upon adsorption (the adsorbed molecules become structurally different from molecules in the equilibrium); 3) protein self-association and repulsive interactions; 4) exclusion effects due to resin pore size distribution; 5) diffusional resistance due to limitations associated to the binding kinetics.
In light of these set of factors, it is understandable why predicting protein adsorption in equilibrium is cumbersome and empirical models become useful. The use of hybrid procedures combining modeling with an experimental approach can help predicting key parameters associated with preparative chromatography.
2.1. Isotherms
Resin process performance is determined, as previously mentioned, by equilibrium and kinetics factors. Equilibrium factors, like selectivity and binding capacity, are controlled by the nature, selectivity, and concentration of the binding ligands, by the accessible surface area, and by the nature of the resin backbone. The relationship between a molecule adsorbed to a stationary phase and its concentration in equilibrium with the mobile phase at constant temperature is given by the adsorption isotherm.
The Langmuir isotherm is the most used model to describe antibody adsorption to Protein A resins, even though Protein A resins are of heterogeneous binding nature (Carta & Jungbauer, 2010; Perez-Almodovar & Carta, 2009). In a single component system (and using as example the affinity chromatography system between antibody and Protein A), there is a stoichiometric association of an antibody, 𝐴, with the Protein A ligands, 𝐵. The formation of the complex 𝐴𝐵 can be described in equilibrium as follows:
𝐴 + 𝐵 𝐴𝐵 𝑘𝑑
←
𝑘𝑎
→ (1)
where 𝑘𝑎 and 𝑘𝑑 would respectively represent the on and off rate constants for the binding (association) and desorption (dissociation) rate of antibody to Protein A. The complex formation rate can be described by:
𝜕[𝐴𝐵]
𝜕𝑡 = 𝑘𝑎[𝐴][𝐵] − 𝑘𝑑[𝐴𝐵]
(2)
where 𝑡 is the time; and the square brackets represent the concentrations of the involved species. The representation of the complex formation rate by the Langmuir kinetic model is given by:
𝜕𝑞
𝜕𝑡 = 𝑘𝑎(𝑞𝑚− 𝑞)𝐶 − 𝑘𝑑𝑞 (3)
where 𝑞 is the amount of adsorbed antibody to the ligands, i.e., the representation of the complex 𝐴𝐵, with [𝐴𝐵] = 𝑞; 𝐶 is the antibody concentration in equilibrium with the mobile phase, i.e., [𝐴] = 𝐶; and 𝑞𝑚 is the maximum binding capacity of the resin for the antibody, so that the number of free ligands 𝐵 is given by [𝐵] = 𝑞𝑚− 𝑞.
In equilibrium, where 𝜕𝑞
𝜕𝑡 = 0 holds true, Eq. (3) can be rewritten as:
𝑞 = 𝑞𝑚𝐶 𝑘𝑑 𝑘𝑎+𝐶
(4)
Substituting 𝑘𝑑⁄𝑘𝑎 with 𝐾𝐷, the equilibrium dissociation constant that is obtained by the ratio between the off and on rate constants, it gives the equation of the Langmuir isotherm:
𝑞 = 𝑞𝑚𝐶
𝐾𝐷+𝐶 (5)
The dissociation constant 𝐾𝐷 is given in mg/mL (or mol/L) is the equilibrium concentration at which the surface concentration, 𝑞, is half of the maximum binding capacity, 𝑞𝑚. It is the inverse of the affinity constant 𝐾𝐴, which represents the affinity of the resin for the molecule and is expressed in mL/mg (or M-1). The affinity constant of Protein A resins for the Fc part of human IgG1, IgG2, and IgG4 is in the range of 700 g/L or 108 M-1 (Hober et al., 2007; Jendeberg et al., 1997). With 𝐾𝐷= 1
𝐾𝐴, the Langmuir isotherm can be rewritten as:
𝑞 =𝑞𝑚𝐾𝐴𝐶
1+𝐾𝐴𝐶 (6)
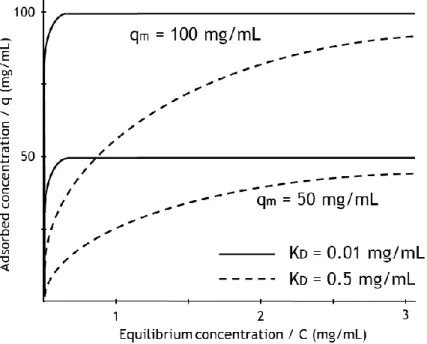
Figure I.5 shows representations of typical Langmuir isotherms. It can be seen how different values for the parameters 𝐾𝐷 and 𝑞𝑚 affect the isotherm behaviour.
Figure I.5 – Representation of adsorption isotherms and the contribution of its parameters to the adsorption behavior.
As the equilibrium concentration tends to zero (𝐶 → 0), the isotherm approaches its linear region, with:
𝑞 = 𝑞𝑚𝐾𝐴𝐶 (7)
As the equilibrium concentration tends to infinity (𝐶 → ∞), the isotherm approaches the maximum capacity, with: