CARLOS FARATE
MARGARIDA POCINHO PAULO MACHADO
R
EPERCUSSIONS OFTOBACCO
,
ALCOHOL ANDDRUGS ON ADOLESCENTS
’
HEALTH
TABLE OF CONTENTS
I – THEORETICAL/EMPIRICAL FOUNDATIONS OF THE RESEARCH ... 6
1.1INTRODUCTION... 6
1.2 OBJECT OF RESEARCH AND THEORETICAL SYNOPSIS ... 7
1.3 TYPE OF STUDY AND WORKING HYPOTHESES ... 12
1.4 STRATEGIC AIMS ... 14
II RESEARCH PROTOCOL ... 15
2.1 SAMPLE AND SAMPLING PROCEDURES ... 15
2.2 VARIABLES UNDER STUDY AND STATISTICAL ANALSYIS STRATEGY ... 15
2.3 PROCEDURES FOR DATA COLLECTION ... 17
2.4 STUDY SAMPLE ... 20
2.5 CALCULATIONOFTHERELIABILITYCOEFFICIENTFOREACHATTACHMENTSCALE ... 21
2.5.1 PCV-M ... 21
2.5.2 IPPA ... 24
2.5.3 IACA ... 26
III EMPIRICAL RESULTS... 29
3.1 DESCRIPTIVE AND CORRELATIONAL ANALYSIS OF DATA BY SUB-SAMPLE ... 29
3.1.1 PRESENTATION AND ANALYSIS OF SELECTED DATA FROM E1 SUB-SAMPLE ... 29
3.1.2 PRESENTATION AND ANALYSIS OF SELECTED DATA FROM E2 AND E3 SUB-SAMPLES ... 39
3.2 INFERENTIAL ANALYSIS ... 62
3.2.1 CROSS-SECTIONAL ANALYSIS ... 63
3.2.2 LONGITUDINAL ANALYSIS ... 73
3.2.3 THE LOGIT MODEL ... 82
3.2.4. LOGIT REGRESSION ANALYSIS ... 83
SUMMARY AND THEORETICAL INTEGRATION OF THE FINDINGS ... 87
REFERENCES ... 90
TECHNICAL ADDENDUM ... 95
Index of Tables
Table 1: Sample distribution ... 18
Table 2: Participation rate ... 19
Table 3: Reliability coefficients: Internal consistency ... 21
Table 4: Psychometric characteristics of the PCV-M: Total scale ... 22
Table 5: Sub-scale “Difficulties in emotional self-regulation” ... 23
Table 6: Sub-scale “Secure-base behaviour” ... 23
Table7: Sub-scale “Sharing of affection” ... 23
Table 9: Reliability coefficients ... 24
Table 10: Sub-scale “Attachment-mother” ... 25
Table 11: sub-scale “Attachment– friends” ... 26
Table 12: Reliability coefficients ... 27
Table 13: Sub-scale “Anxious/ambivalent bond” ... 27
Table 14: Sub-scale “Secure bond” ... 28
Table 15: Sub-scale “Avoidant bond” ... 28
Table 16: Marital state of the parents ... 30
Table 17: Maternal health /obstetrical problems ... 30
Table 18: Serious obstetric problems during pregnancy ... 31
Table 19: Place, time-length of pregnancy and type of delivery ... 31
Table 20: Family risk during pregnancy ... 32
Table 21: Necessity of treatment during the newborn period ... 32
Table 22: Parental perception of children’ health state ... 32
Table 23: Medical diseases during childhood ... 33
Table 24: Accidents during childhood ... 34
Table 25: Hospitalizations during childhood ... 34
Table 26: Children’ health state (medical evaluation) ... 35
Table 27: Attachment quality scale – PCV-M ... 37
Table 28: Somatic-functional complaints... 40
Table 29: Somatic-functional complaints by gender ... 40
Table 30: Medical appointments ... 41
Table 31: Prescribed medication ... 42
Table 32: Weight control strategies (vomiting. diet. laxatives or other medications) ... 43
Table 33: Weight control strategies by gender ... 43
Table 34: Attitude towards eating ... 44
Table 35: Bulimic behaviours ... 44
Table 36: Bulimic behaviours by gender ... 45
Table 37: Bulimic behaviours ... 45
Table 38: Preoccupation with body weight ... 45
Table 39: Preoccupation with body weight by gender ... 46
Table 40: Impulsive behaviours ... 46
Table 50: Wish to know more (about different subjects) ... 56
Table 51: Substance use behaviours and choice of confidents ... 57
Table 52: IPPA (mean scores) ... 58
Table 53: IPPA (gender differences) ... 58
Table 54: Differences between E2 and E3 subgroups ... 58
Table 55: IACA (mean scores/E2 and E3 subgroups) ... 59
Table 56: IACA (gender differences) ... 59
Table 57: Substance use and somatic-functional complaints ... 63
Table 58: Somatic-functional complaints and health state by gender ... 64
Table 59: Somatic-functional complaints and frequency of medical appointments ... 65
Table 60: Substance use and somatic-functional complaints by gender ... 66
Table 61: Somatic-functional and violent behaviours ... 67
Table 62: Somatic-functional complaints and troubled eating behaviour ... 68
Table 63: Somatic-functional complaints and eating behaviour disorders by gender ... 69
Table 64: Substance use and weight control strategies ... 70
Table 65: Substance use and weight control strategies by gender ... 70
Table 66: Substance use and violent behaviours ... 71
Table 67: Substance use and violent behaviours by gender ... 72
Table 68: Correlation trial between IPPA and IACA ... 73
Table 69: Risk indexes (sum of the number of events): parametric values ... 74
Table 70: Correlation between somatic antecedents and taking of medications ... 75
Table 71: Contingency between somatic antecedents and taking of medications ... 76
Table 72: Correlation between somatic antecedents and frequency of medical appointments and taking of medications (controlled by substance use behaviours) ... 77
Table 73: Substance use and taking of medications ... 77
Table 73: IAS-din and substance use ... 78
Table 74: IACA and substance use [11-14 year-olds] by somatic antecedents ... 80
Table 75: IACA and substance use [15-18 year olds] by somatic antecedents ... 81
Table 76: Summary of the model for E2 subgroup (11-14 year olds) ... 83
Table 77: Summary of the model for E3 subgroup (15-18 year olds) ... 83
-PROJECT’ RESEARCH TEAM -
PRINCIPAL INVESTIGATOR CARLOS FARATE(ISMT)
INVESTIGATORS MARGARIDA POCINHO(ESTES-COIMBRA)
PAULO MACHADO(DEP.PSYCHOLOGY -UNIVERSIDADE
DO MINHO)
MARIA JOSÉ HESPANHA (COIMBRA HEALTH SUB
-REGION)
ASSOCIATE INVESTIGATOR ISABEL SOARES(DEP.PSYCHOLOGY -UNIVERSIDADE DO
MINHO)
SCIENTIFIC COUNSELLOR MARIE CHOQUET (RESEARCH DIRECTOR - INSERM U.
669)
OPERATIONAL COORDINATOR M.ª JOSÉ VERDETE
SECRETARY SÓNIA SIMÕES
COLLABORATORS CLINICAL DIRECTORS OF HEALTH CENTERS (ENROLLED IN
THE SURVEY)
ENVIRONMENTAL HEALTH TRAINEES (ESTESC)
KÁTIA TRALHÃO
JOÃO PAULO FIGUEIREDO
ERNESTO SEGURO
I
–
T
HEORETICAL
/
EMPIRICAL FOUNDATIONS
OF THE RESEARCH
1.1
I
NTRODUCTIONThe interest of this research on somatic, psychological and relational repercussions of health risk behaviours in children and adolescents is based on four fundamental assumptions:
1 The importance attributable to the early detection of the first manifestations of avoidable
medical pathologies both in terms of the social and emotional distortions which although
“at an early stage” can have a striking impact on the structuring of the personality;
2 The apparent duality of the observable interaction between the consequences (somatic
disease and/ or disturbance of adaptive behaviours) and the causes that are hierarchically attributable to them (use of psychoactive drugs, violent behaviour, changes in eating habits, among others) given that the former appear to be both a function and condition of the latter and vice-versa;
3 The way the screening of this phenomenon between the infant/juvenile population of a
given community locus helps us take stock of the degree of local penetration of the measures of health promotion (primary health care logistics, time, mode and circumstances of resources to this care, articulation between primary care and specialised services);
4 The possibility of assessing the current health of the population under scrutiny, explaining,
1.2
O
BJECT OF RESEARCH AND THEORETICAL SYNOPSISThere is not a great deal of literature published on this topic, nor does it provide an explanation for the emotional-behavioural dimension of the somatic problems of children and adolescents, in particular in their association with the adoption of health risk behaviours.
As far as this is concerned, the results of the analysis conducted by Horwitz et al. (2002)
on topics of research projects financed by the USA (researched from North American CRISP -
Computer retrieval of information on scientific projects – data retrieved in April 2001) reveal
that of a total of 66.749 scientific résumés consulted (45.022 of which concerned ongoing scientific projects) only 63 projects, i.e., approximately .1% of the total, corresponded to research work on children and adolescents in primary health care.
On the other hand, only 21 studies (.05% of the total) were geared towards the analysis of identifiable emotional and behavioural problems in young users of primary health care services. This is the case despite the growing importance that is attributed, from the preventive viewpoint of community public health, to the improvement of screening skills and preventive / therapeutic interventions on the subject of psychological and behavioural impact of health problems on children and adolescents.
Nevertheless, a number of research teams have developed reference studies in this area. In particular:
Epidemiological studies led by Choquet et col. of an overall adolescent population in
which is undertaken the critical analysis of data concerning the statistical cross-referencing of somatic problems, psychosomatic complaints and risk behaviours. The resource to primary and specialised health care is assessed within the context of the association between the state of somatic health and the quality of adaptive behaviours among the adolescents interviewed;
Periodical surveys conducted in samples of the adolescent school population within the
scope of the European project of epidemiological surveillance HBSAC (Health
Behaviour in School-Aged Children) in order to determine the prevalence rates of
different levels of education (primary, secondary, complementary, special education). During the week in which the survey among the school nurses took place, 3.6% of the school population under study (i.e., 1.016 from among the 28.134 children and adolescents evaluated) received a total of 5.411 doses of 31 different categories of medication, especially Methylphenidate (by far the most frequently used drug in any of the schools studied, as it represented 54% and 66% of the drugs distributed in private and public primary schools respectively). It should be noted that in statistical terms the prescription rate of this drug corresponds to the diagnosis of ADHD undertaken in 3% of the children in primary education of the sample. This medication was followed (in decreasing order) by analgesics, bronchodilators and anti-hypertensive drugs. Anti-depressants and SNC stimulating drugs had the lower prescription rates. It should be noted that the boys had a probability 2.5 higher than the girls of taking prescribed medications in this school sample;
The studies on the psychopathological dimension of health risk behaviours, carried out
in samples of adolescents of the general population within the scope of community-based cohort projects or in the context of epidemiological surveillance projects (cross-sectional or longitudinal) carried out on school population samples. As to the first type
of studies, Zwaigenbaum et al. (1999) identify an added probability of evolving
towards emotionally disturbing situations, in this case major depression and panic
attacks (diagnosed according to DSM-IV criteria), after 4 years among the adolescents from the cohort studied which, between the ages of 13-16, reported high levels of somatisation, especially when the somatic complaints were not associated with the expression of correlative emotional disturbances. It should also be noted that for this group of adolescents, the relative risk of developing abuse/dependence of psychoactive drugs is not significantly different from adolescents which somatise little or who do not somatise at all. This study does not confirm however the association between the antecedents of medical diseases in childhood and the tendency towards higher levels of somatisation during adolescence which was detected in the studies carried out by
Livingston et al. (1988) and Fritz et al. (1997). As far as basic school studies are
concerned it should be mentioned that Simon et al. (2003) found an association
between an advanced stage of puberty development, high levels of emotional stress and
puberty development among the boys in the sample, the analyses made on the results of the 1st year of the study permit to conclude that boys and girls with a higher level of pubertal development try-out tobacco smoking at an earlier age. On the other hand, even if it is possible to identify a tendency towards a fatty food diet and higher levels of physical exercise among boys, the girls seem to be more sensitive to higher levels of emotional stress with the emergence of pubertal transformations. The authors have not managed to prove the hypothesis according to which the interaction between puberty
stage and health behaviours would be mediated by the youngster’s stress levels and
psychological difficulties. Finally, Fulkerson et al. (2004) identified a significant
association between depressive symptoms (measured through a dimensional psychometric instrument) and a set of health risk attitudes and behaviours (preoccupations about weight associated with resistance to a balanced diet, disordered eating behaviour and substance use) among the secondary students of both sexes enrolled in their study (which average age is 14.9 for boys and 14.7 for girls). It should be pointed out that among girls there is a proportional correlation between the levels of depressiveness and health risk behaviours whereas among boys the authors identify a
“threshold effect” which separates, for the same variables, the adolescents who belong
to the subgroups with a moderate/high level of depressive symptoms from those who belong to the subgroup with a low level of depressive symptoms;
Another set of studies undertake an analysis of the impact that the exposure to
particularly unfavourable new material and emotional conditions in the family environment (parental or family violence, negligence and/or physical or psychological ill-treatment, physical or sexual abuse during childhood) can exert on the quality of social behaviours and in particular the health behaviours of children coming from these families. For Graham-Bergmann & Seng (2005) this adverse family setting can still be worsened in the case of children with traumatic stress symptoms. Therefore in a cross-sectional analysis undertaken on data from the 2nd wave of a longitudinal study on the
Health). The authors also concluded that the inclusion of children’s traumatic stress
symptoms and poor maternal health in the hierarchical risk model, which they constructed for this study, increased its predictive power, since it was associated with a
greater number of health problems among children. On their side, Conners et al. (2004)
undertook a prospective analysis on data from drug-addicted mothers and their children who between the years 1993 and 2000 benefited from residential support programmes all over USA. They concluded that, for those children subject to a number of material, neurobiological and emotional risk factors the prevalence rates for different cognitive, psycho-emotional and somatic problems (namely learning difficulties and school adjustment problems) were higher than the national average. Most particularly, asthma and hearing and sight problems showed a two-fold, five-fold and seven-fold increase in relation to the average national prevalence rates for these health problems;
As to the studies on the analysis of the impact of alcohol and drug use on the physical
and mental health of adolescents and adults, it should be mentioned that the epidemiological research conducted in this area concerns mainly the issues of co-occurrence and co-morbidity with other psychiatric pathologies. From this perspective, Adrian & Barry (2003) undertook a comparative analysis on data about the medical morbidity of all patients with diagnoses of alcohol and drug abuse/ dependency treated in hospital environment in the province of Ontario (Canada) between 1985 and 1986 and on data about the patients who, during the same period of time, were treated in hospitals all over Canada (after previous adjustment for the diagnoses and morbidity
rates by sex/age). They defined a “standard morbidity rate” (SMR) as a standard measure for the whole of physical and mental pathologies included in the correlacional analysis, and through the use of appropriate calculation formulae they concluded that: patients with primary diagnoses (PD) of alcohol or drug abuse/dependency (A/D) had higher morbidity levels than those with secondary diagnoses (SD) of these pathologies; SMR was higher for patients with a PD of abuse of prescribed drugs, intermediate for
those with a PD of “illicit” drug dependency and lower for those with PD and SD of alcohol use; patients with A/D of alcohol presented a higher medical morbidity, both from a quantitative and qualitative viewpoint and those with drug A/D presented a
higher psychopathological morbidity. Along the same line of research, Aarons et al.
the addictive disturbances in adolescence. They established three sub-groups in their sample based on the outcome of the treatment: adolescents with negative outcome, since they did not stop using drugs during the follow-up of the treatment; adolescents with positive therapeutic outcome; a community subgroup of adolescents either abstinent or reporting reduced of psychoactive substances. They then concluded that: 1) substance-use behaviours which require treatment, even when successful, were associated with a high level of somatic health problems among boys and girls, the latter presenting even more serious health problems; 2) the maintenance of substance-use behaviours (due to therapeutic failure) was associated both with cumulative and serious health problems among girls and more serious health problems among boys; 3) in line with results from other studies, early initiation to alcohol use was associated with an high probability of drug abuse and somatic problems during adolescence and adulthood;
Since attachment is an important variable in this project, a documental research has
been made on the most well known databases by introducing different variations of the key words, attachment, health behaviours, children and adolescents. Even though the
results of the research were somewhat disappointing1, mention should be made, on the
one hand, to the association between anxious/ambivalent attachment style, family history of disease and current somatic complaints (the latter relationship mediated in part by a negative emotionality) identified by Feeney & Ryan (1994) among the university students interviewed in their research and, on the other hand, to the study by Maunder & Hunter (2001) on the relationship between attachment style, vulnerability to stress and state of health. These authors begin by drafting an important and systematic synopsis on the conceptual developments in the area of attachment theory
(they revisit among others, the operational concept of “strange situation” due to
Ainsworth in line with Bowlby’s theoretical foundations and the contributions of
developmental neurobiology to the conceptual evolution of this construct, and go on proposing the theoretical delimitation of the basic types of adult attachment - secure,
risk of developing somatic diseases. Such model is based on the meta-analysis of the literature concerning attachment quality, health and disease (in the child, adult and in the developmental perspective). Always following the same methodology, Maunder &
Hunter undertake a path analysis in which they include the following regulation
mechanisms: physiological response to situations of emotional stress, use of external affect regulators and use of protective factors (social support, search for help, adhesion to treatment). In short, they reach the conclusion that attachment style can be a predictor both of vulnerability to stress and to the (correlative) risk of developing somatic diseases through the mediation of three of the mechanisms which enhance such risk: the shift of the physiological response to stress, the excessive use of external regulators for the commonest affective states and the misuse of the aforementioned protective factors.
1.3
T
YPE OF STUDY AND WORKING HYPOTHESESThis is an analytical epidemiological study developed through a cross-sectional survey carried out on a sample of children and adolescents users of the primary health services of the Health sub-region of Coimbra.
There are two basic hypotheses in this project:
- The antecedents of somatic diseases, especially if they are early, serious (e.g.,
demanding hospitalisation for longer than a week) with a prolonged evolution and
associated to behavioural troubles during childhood or early adolescence increase
the probability of the adolescent’s involvement in health risk behaviours (including
smoking, drinking alcohol, use of psychotropic medication or other psychoactive drugs);
- Attachment quality has a mediating effect on the interaction between somatic
antecedents and health risk behaviours. According to the mediator model advanced
1.4
S
TRATEGIC AIMSThe following items include the strategic aims of this study:
1. To verify the theoretical/empirical hypotheses mentioned above;
2. To determine the impact of the involvement of adolescents in psychoactive
substance use, particularly tobacco, alcohol and psychotropics, on the occurrence of avoidable medical and surgical pathologies;
3. To evaluate the influence that the access to medical and/or psychological treatment
can have on the positive modification of health risk behaviours, including substance use;
4. To ascertain the influence of early and/or prolonged prescription of analgesics,
II
R
ESEARCH
P
ROTOCOL
2.1
S
AMPLE AND SAMPLING PROCEDURESThe epidemiological study was conducted in a general population sample of children and adolescents randomly selected from the familial medicine, general practice and child health consultations of the Health Centres included in Coimbra Health Sub-Region. The selection procedures fulfilled the following criteria: 1) identification of all the Health Centres within Coimbra Health Sub-Region; 2) stratification of the surveyed units according to the number of children and adolescents - 6 to 18-year old - registered in each one of the health centres under scrutiny; 3) establishment of a panel sample (with an estimated number of 1500 children and adolescents of both sexes divided into three sub-groups of different age spans (E1: children between the ages of 6 and 8; E2: 11 to 14-year old adolescents; E3: 15 to 18 year-old adolescents); 4) option to include all Health Centres (HC) in Coimbra Health Sub-Region as primary survey units, rather than sticking to the initially foreseen random selection vis-à-vis practical considerations regarding the risk of an high rate of sample loss eventually rendering the study ineffective.
2.2
VARIABLES UNDER STUDY AND STATISTICAL ANALSYIS STRATEGYIn order to implement the aims defined for this study a research protocol was set up structured around a cross-sectional epidemiological inquiry, following a model of empirical analysis based on adequate statistical assessment of data collected from the sample under investigation, by resorting to the following procedures:
1. Determination of the reliability coefficients for each one of the attachment scales
included in the research protocol – measures of internal consistency through analysis of
3. Regression tests for longitudinal analysis of the variation of health risk behaviours in
relation to the values of the “Dynamic Index of Somatic Antecedents” (IAS-din) and
adequate discriminating statistical tests for the mediator model advanced in this study.
The selection of the variables under study was undertaken through the following psychometric data collection instruments included in the research protocol:
Health Inventory (self-questionnaire to be filled in by parents of children and
adolescents) consisting of closed and pre-coded questions organised diachronically (relevant medical and behavioural antecedents from the pregnancy and neo-natal period on, including, for example, the type and length
of time of child’s or adolescent’s full hospitalisation; type, posology and length
of time of prescribed medication use; preventive interventions and therapies undertaken);
Psychosocial self-questionnaire for adolescents (adapted from Choquet et
col., INSERM) with closed and pre-coded questions in the following domains:
social/demographic, physical health (including health behaviours, perception of bodily well-being, pubertal changes); violent behaviour (run away, violence, theft); substance use (alcohol, tobacco, psychotropic drugs);
Abridged medical record (filled in by each one of the doctors from the
different Health Centres enrolled in the study) drawn up from data included in
the official “Individual Health Bulletin” in order to achieve a complementary
validation for the medical and somatic-functional variables included in both questionnaires;
PCV-M (Dias & Soares) parent version of a psychometric instrument which
measures the perception of the quality of attachment behaviours of school-aged children through 4 sub-scales (difficulties in emotional self-regulation, secure-base behaviour, sharing emotions, social desirability) the scoring of which varies between 1 (totally different from my son/my daughter) and 5 (totally similar to my son/my daughter). In the initial validity study this scale revealed
good internal consistency indices, with values for Cronbach’s alpha of .88 for
the sub-scale “difficulties in emotional self-regulation”, of .82 for “secure-base
IPPA – Inventory of Parent & Peer Attachment (Armsden e Greenberg) comprising 75 items that measure the perception of adolescents on different attachment features with parents and friends. The initial assessment of the
reliability indexes for this scale revealed a Cronbach’s α coefficient of .87 for
maternal attachment and .89 for paternal attachment (Armsden & Greenberg, 1987). The psychometric validity studies conducted in Portugal by Neves (1995) and Neves, Soares & Silva (1999) confirmed good reliability coefficients (.92 and .95, respectively for the mother and father scales). The Portuguese version for the mother and friends scales used in this research protocol was submitted to psychometric assessment for the sample in study;
IACA – Inventory of Attachment in Childhood and Adolescence – constructed
and developed by Carvalho, Soares & Baptista (2004). First the authors defined 80 items for the questionnaire conceptually based on the original psychodynamic models from the attachment theory (Bowlby, 1969, 1973) and in the evaluation instruments derived from the cognitive approach of this theory (EAS, SASC-R, BIS e RCMAS-l). Those items were then analysed in terms of their facial and content values. Based on this analysis 16 items were excluded
due to their ambiguity and also because they weren’t representative of the
dimensions of attachment behaviour under scrutiny: secure, anxious/ambivalent and avoidant The internal consistency values for each one of the sub-scales,
measured by Cronbach’ coefficient were the following: .87 for secure attachment, .84 for anxious attachment and .71 for avoidant attachment. A psychometric assessment of this instrument was undertaken in this research so as to detect the reliability indexes according to the methodology defined by IACA authors.
2.3
P
ROCEDURES FOR DATA COLLECTIONhealth consultations in each one of the HC, with the purpose of informing them about the methodology and aims of the epidemiological survey.
Once the calculations for the estimated sample size, based on data in the previous year movement supplied by Coimbra Health Sub-Region, were concluded (using a number of users/by age group/by practitioner/by Health Centre composite ratio) a final sample distribution was obtained as indicated in table 1.
Table 1: Sample distribution
HEALH CENTER (HC)
6-8 YEAR-OLDS 11-14 YEAR-OLDS 15-18 YEAR-OLDS TOTAL
By age group By Doctor By age group By Doctor By age group By Doctor By HC By Doctor/ HC
Arganil 17 2 19 2 20 2 55 6
Cantanhede 37 2 39 2 39 2 115 5
Celas 34 1 33 1 34 1 101 4
Condeixa-a-Nova 21 2 19 2 18 2 58 6
Eiras 16 1 17 1 16 1 49 4
Fernão de Magalhães 30 2 31 2 30 1 91 5
Figueira da Foz 64 1 64 1 65 2 194 5
Góis 7 1 8 2 8 2 23 5
Lousã 22 2 21 2 20 2 62 6
Mira 25 3 24 2 22 2 72 7
Miranda do Corvo 16 2 16 2 17 2 49 5
Montemor-o-Velho 29 2 30 2 28 2 87 5
Norton de Matos 31 1 31 1 31 1 93 4
Oliveira do Hospital 32 2 31 2 30 2 93 7
Pampilhosa da Serra 5 1 5 1 6 1 16 4
Penacova 16 1 16 1 18 1 49 4
Penela 8 1 7 1 7 1 22 3
Santa Clara 18 1 19 1 19 1 56 4
São Martinho do Bispo 22 1 25 2 24 2 71 5
Soure 22 1 20 1 21 1 63 4
Tábua 15 2 16 2 17 2 48 6
Vila Nova de Poiares 13 2 10 2 11 2 34 6
Total 501 500 501 1501
The research’s standard dossier was organised so as to respect the complex fieldwork
logistics. A particular attention was given to the coding of individual dossiers by age sub-group (E1; E2; E3)/inquired subject (parent, adolescent, practitioner)/Health Centre as well as to its distribution by each Health Centre, carried out personally by the operational coordinator
of the fieldwork under the supervision of the project’s research team and counting on the
institutional support of the colleague coming from Coimbra Health Sub-Region.
professionals, most particular family doctors, to participate in the survey. In addition, in a number of situations, the mediating role played by the environmental health trainees (and by the nursing/ administrative staff of certain HC) was a rather ineffective one. Those difficulties, which continued throughout the course of the fieldwork, led to the lengthening of the time initially foreseen for the data collection (from 6 to 8 months).
In spite of both the technical skills and the methodological exigencies that were placed on the implementation of the fieldwork, the participation rate has been a relatively low one
(587 subjects of the 1,500 initially estimated, meaning that there’s been an effective
participation rate of 39% in relation to the estimated sample size). Such relatively low participation rate can then be explained by the variables mentioned above, as well as by professional, bureaucratic, and administrative factors, that both converged to reduce the size (but not the empirical quality) of the study sample.
The participation rate per HC is shown in Table 2.
Table 2: Participation rate
HEALTH CENTRE (HC) ESTIMATED EFFECTIVE RATE (%)
Arganil 55 54 98
Cantanhede 115 104 91
Celas 101 0 0
Condeixa-a-Nova 58 55 94
Eiras 49 21 43
Fernão de Magalhães 91 21 23
Figueira da Foz 194 41 21
Góis 23 19 84
Lousã 62 24 38
Mira 72 0 0
Miranda do Corvo 49 0 0
Montemor-o-Velho 87 67 77
Norton de Matos 93 0 0
Oliveira do Hospital 93 20 22
Pampilhosa da Serra 16 25 153
Penacova 49 0 0
Penela 22 0 0
Santa Clara 56 0 0
São Martinho do Bispo 71 30 42
Soure 63 56 89
2.4
STUDY SAMPLEThe overall sample of this survey consists of 587 children and adolescents distributed in 3 age sub-groups:
E1 (6-8 year-old) 225 children - 123 girls (55%) and 99 boys (45%);
E2 (11-14 year-old) 187 adolescents – 108 girls (58%) and 79 boys (42%);
E3 (15-18 year-old) 175 adolescents – 93 boys (53%) and 81 girls (47%).
As to the 362 youngsters of the global adolescent sample (E2 and E3) they have between 11 and 18 years old, and the mean age of those (347) who have mentioned it is 14.48 years old (14.43 for the boys and 14.55 for the girls, with a SD of +/- 2.4 for both genders).
The distribution by gender among the adolescent sample reveals a slight predominance of girls - in fact, 55.7% (201) of them are girls and 44.3% (160) boys - as is the case for the children sample (E1).
Two notes on the population under study:
- The boy/girl ratio for each sub-group follows the tendency of the Portuguese population for the same age groups (cf. census INE 2001) if not even more so (it should be remembered that this is a community-based population, with a specific regional profile which used the primary health care services during the period under analysis); - The adolescent population (11-18 years old) even though initially divided according to
developmental criteria – onset of adolescence, intermediate adolescence and end of
adolescence – is the object of a common epidemiological analysis, for statistical
reasons (small N for each one of the subgroups and previewed low prevalence rate
for substance use behaviours –the study’s dependent variable - particularly in E2) as
2.5
CALCULATION
OF
THE
RELIABILITY
COEFFICIENT
FOR
EACH
ATTACHMENT
SCALE
2.5.1 PCV-M
PCV-M is divided into four sub-scales – Difficulties in Emotional Self-regulation,
Secure-base Behaviour, Sharing of Affection and Social Desirability (relating to mothers) –
which can be scored from 1 (totally different from my son/daughter) to 5 (totally similar to my son/daughter).
Table 3: Reliability coefficients: Internal consistency
SCALE TOTAL SCALE
DIFFICULTIES IN EMOTIONAL SELF
-REGULATION
SECURE-BASE BEHAVIOUR
SHARING OF AFFECTION
SOCIAL DESIRABILITY (RELATING TO MOTHERS)
Cronbach’ alpha .844 .778 .789 .774 .650
N.º of items 33 12 7 7 7
By looking at this table, it’s possible to ascertain that the scale presents overall a good
Cronbach’s alpha, very close to the one Dias & Soares obtained in their study (.86). However,
its sub-scales present a lower consistency coefficient, although acceptable and very close to
good, with the exception of the “social desirability” subscale whose score suggests that it may
The following tables show the psychometric characteristics for each item in PCV, as well as for each one of its sub-scales.
Table 4: Psychometric characteristics of the PCV-M: Total scale
ITEMS IF DELETED S2 IF DELETED R
(CORRECTED)
CRONBACH IF DELETED
1 119.9458 282.524 .129 .847
2 119.3434 276.190 .382 .840
3 119.5181 275.548 .361 .840
4 120.4518 278.516 .297 .842
5 119.4217 271.191 .436 .838
6 119.7349 280.075 .190 .845
7 120.1627 276.767 .264 .843
8 120.0783 275.721 .274 .843
9 119.9458 272.609 .381 .839
10 121.0422 279.604 .221 .844
11 119.4157 274.572 .386 .839
12 119.6506 271.501 .391 .839
13 121.2892 284.534 .108 .847
14 119.7349 275.699 .317 .841
15 121.4337 286.477 .076 .847
16 119.7651 264.678 .551 .834
17 119.2952 271.809 .491 .837
18 119.7410 264.581 .574 .833
19 119.3494 273.889 .378 .839
20 121.4518 293.898 -.109 .852
21 119.4639 271.329 .440 .838
22 119.7229 268.711 .504 .836
23 119.5542 274.212 .353 .840
24 119.9819 270.588 .424 .838
25 119.9036 272.657 .350 .840
26 119.3133 274.107 .406 .839
27 119.3554 272.121 .476 .837
28 120.2048 275.909 .334 .841
29 120.1747 271.709 .340 .841
30 119.5843 269.820 .473 .837
31 119.8494 268.565 .560 .835
32 119.8253 272.387 .432 .838
33 119.3072 276.747 .340 .841
As can be observed, a set of 6 items presents a correlation with the remaining ones below .3 (after rounding-off) which, according to Bryman & Cramer (1992), suggests a need for revision. It is further stressed that 5 of these items belong to a single sub-scale, precisely the
“social desirability” scale.
Table 5: Sub-scale “Difficulties in emotional self-regulation”
ITEMS IF
DELETED
S2 IF DELETED
R (CORRECTED)
CRONBACH IF DELETED
PCV-M item1 (reverted) 43.8150 65.338 .285 .778
PCV-M item6 (reverted) 43.6127 66.192 .261 .780
PCV-M item8 (reverted) 43.9595 61.748 .452 .759
PCV-M item11 (reverted) 43.2832 63.541 .496 .756
PCV-M item14 (reverted) 43.6012 64.276 .393 .765
PCV-M item16 (reverted) 43.6358 61.012 .524 .751
PCV-M item19 (reverted) 43.2312 62.911 .488 .756
PCV-M item21 (reverted) 43.3179 62.718 .507 .754
PCV-M item23 (reverted) 43.4393 62.283 .500 .754
PCV-M item25 (reverted) 43.7457 64.005 .363 .769
PCV-M item29 (reverted) 44.0347 62.964 .373 .769
PCV-M item33 (reverted) 43.1734 65.109 .422 .763
As can be seen, the corrected correlation of each item with the others ranges from .3 to .5, and the consistency diminishes if any of them is removed, with the exception of item 6, although the added value of this procedure is very low (.002).
Table 6: Sub-scale “Secure-base behaviour”
ITEMS IF
DELETED
S2 IF
DELETED R (CORRECTED)
CRONBACH IF DELETED
2 24.32 26.111 0.446 0.775
5 24.41 24.984 0.451 0.775
12 24.57 23.484 0.531 0.760
18 24.70 23.195 0.570 0.751
22 24.68 24.355 0.501 0.765
27 24.34 24.840 0.535 0.759
31 24.79 24.175 0.586 0.750
Table7: Sub-scale “Sharing of affection”
ITEMS IFDELETED S2IFDELETED R(CORRECTED) CRONBACH IF
DELETED
3 23.55 26.358 .472 .750
7 24.20 24.402 .499 .745
9 23.93 24.564 .550 .734
17 23.36 25.818 .523 .741
24 24.03 24.939 .479 .749
26 23.35 26.173 .482 .748
30 23.61 25.715 .470 .750
Table 8: Sub-scale “Social desirability” (relating to mothers)
As can be seen in this sub-scale item 20 no longer presents a negative inter-item correlation but item 32 presents a correlation below .3 (after rounding-off). It must be said nevertheless that its removal does not improve this sub-scale.
2.5.2 IPPA
Table 9: Reliability coefficients
SCALE MOTHER FATHER FRIENDS
Cronbach’ Alpha .703 - .844
N.ºof items 25 - 25
Table 10: Sub-scale “Attachment-mother”
ITEMS IFDELETED S2IFDELETED R(CORRECTED) CRONBACH IF
DELETED
IPPA - 1 Part I 80.9841 116.584 .566 .673
IPPA - 2 Part I 80.5796 122.685 .406 .688
IPPA – 3 Part I (reverted) 80.4713 125.694 .272 .695
IPPA - 4 Part I 80.9045 120.195 .347 .687
IPPA - 5 Part I 81.1847 115.646 .569 .672
IPPA – 6 Part I (reverted) 81.4268 121.351 .282 .692
IPPA - 7 Part I 81.8471 117.446 .451 .679
IPPA - 8 Part I 83.1688 140.154 -.393 .736
IPPA – 9 Part I (reverted) 81.8790 129.040 .005 .714
IPPA - 10 Part I 83.2739 138.161 -.347 .730
IPPA - 11 Part I 83.2357 138.142 -.333 .731
IPPA - 12 Part I 81.7038 112.126 .216 .711
IPPA - 13 Part I 81.2994 116.504 .512 .675
IPPA – 14 Part I (reverted) 81.8949 128.024 .041 .711
IPPA - 15 Part I 81.4777 111.739 .646 .662
IPPA - 16 Part I 81.7739 110.265 .641 .659
IPPA - 17 Part I 83.4618 136.505 -.327 .723
IPPA - 18 Part I 83.1242 131.336 -.101 .743
IPPA - 19 Part I 81.5860 112.518 .641 .663
IPPA - 20 Part I 81.2070 112.983 .701 .662
IPPA - 21 Part I 81.3758 113.366 .658 .664
IPPA - 22 Part I 80.7611 118.892 .527 .678
IPPA - 23 Part I 82.7038 136.644 -.230 .735
IPPA - 24 Part I 81.3217 112.621 .654 .663
IPPA - 25 Part I 81.0987 116.498 .519 .675
Table 11: sub-scale “Attachment–friends”
ITEMS IF
DELETED
S2 IF
DELETED R (CORRECTED)
CRONBACH IF DELETED
IPPA - 1 Part III 80.36 143.396 0.548 .833
IPPA - 2 Part III 80.67 143.084 0.537 .834
IPPA - 3 Part III 80.65 142.340 0.619 .831
IPPA - 4 Part III 82.46 163.139 -0.195 .860
IPPA - 5 Part III (reverted) 80.37 149.951 0.241 .845
IPPA - 6 Part III 80.40 140.510 0.747 .827
IPPA - 7 Part III 80.65 138.511 0.693 .827
IPPA - 8 Part III 80.12 142.736 0.620 .831
IPPA - 9 Part III 80.52 142.699 0.501 .835
IPPA - 10 Part III 82.50 160.458 -0.104 .856
IPPA - 11 Part III 82.85 163.297 -0.215 .858
IPPA - 12 Part III 80.48 141.837 0.599 .831
IPPA - 13 Part III 80.13 141.567 0.701 .829
IPPA - 14 Part III 80.46 141.760 0.540 .833
IPPA - 15 Part III 80.56 140.619 0.678 .829
IPPA - 16 Part III 80.47 140.678 0.637 .830
IPPA - 17 Part III 82.29 161.461 -0.151 .855
IPPA - 18 Part III 82.26 161.164 -0.135 .855
IPPA - 19 Part III 80.48 138.299 0.679 .827
IPPA - 20 Part III 80.34 138.983 0.723 .827
IPPA - 21 Part III 80.49 139.892 0.673 .828
IPPA - 22 Part III 82.20 160.767 -0.115 .856
IPPA - 23 Part III 82.51 162.382 -0.178 .857
IPPA - 24 Part III 80.59 138.552 0.680 .828
IPPA - 25 Part III 80.36 143.473 0.513 .834
2.5.3 IACA
The principal components’ factorial analysis of the self-evaluation version of this scale, using varimax rotation, presented a solution of 3 factors that can be theoretically understood. This 3-factor solution accounts for 36% of the variance. Hence:
- Factor 1 was composed of 24 items, which account for 16% of the variance and evaluate anxious /ambivalent attachment;
- Factor 2 was made up of 19 items, which account for 14% of the variance and evaluate secure attachment;
- Factor 3 was composed of 11 items that account for 6% of the variance and evaluate avoidant attachment.
Table 12: Reliability coefficients
CRONBACH ANXIOUS BOND SECURE BOND AVOIDANT BOND TOTAL
Carvalho. M; Soares. I &
Baptista. A. (2004)
.84 .87 .71
N.º of items 24 19 11 64
Our study .813 .872 .617 .861
N.º of items 24 19 11 64
This instrument showed sound psychometric characteristics for evaluating the different types of attachment following the results of the study that led to its initial construction and validation. As to its application to this study sample the reliability coefficients of the avoidant sub-scale were lower; however they do not compromise the findings for the global scale.
The internal consistency of the sub-scales is shown in tables 13, 14 and 15.
Table 13: Sub-scale “Anxious/ambivalent bond”
ITEMS IF
DELETED S2 IF DELETED R (CORRECTED)
CRONBACH IF DELETED
IACA7 50.92 173.310 .217 .815
IACA8 50.81 171.344 .349 .807
IACA9 51.32 171.244 .399 .805
IACA10 51.62 179.681 .208 .812
IACA12 50.67 162.317 .223 0.830
IACA16 50.29 171.856 .353 .807
IACA20 50.80 166.762 .498 .800
IACA21 50.94 174.889 .337 .808
IACA24 50.77 175.095 .273 .810
IACA26 50.31 166.564 .474 .801
IACA27 51.07 171.440 .510 .802
IACA30 50.34 167.677 .459 .802
IACA32 50.24 172.253 .364 .806
IACA35 49.99 170.714 .364 .806
IACA36 50.83 171.293 .484 .802
IACA38 51.52 174.738 .468 .805
IACA40 50.49 166.807 .521 .799
IACA46 50.39 176.504 .235 .812
IACA47 50.74 175.494 .322 .808
IACA48 50.79 171.140 .408 .804
IACA52 50.80 170.061 .503 .801
IACA53 50.74 173.409 .319 .808
IACA59 51.08 175.652 .324 .808
As can be observed the scale has the desired consistency and the removal of any of the items would lower its internal consistency.
Table 14: Sub-scale “Secure bond”
ITEMS IF
DELETED S2 IF DELETED R (CORRECTED)
CRONBACH IF DELETED
IACA1 66.10 158.514 .354 .870
IACA11 65.91 152.706 .509 .864
IACA18 66.25 152.495 .519 .864
IACA19 66.03 151.684 .557 .862
IACA25 65.81 155.959 .395 .868
IACA23 65.96 150.951 .565 .862
IACA29 66.74 156.422 .371 .869
IACA31 65.46 152.011 .367 .872
IACA33 65.92 153.674 .498 .865
IACA34 65.84 154.533 .497 .865
IACA41 65.83 152.099 .552 .863
IACA44 66.43 153.115 .484 .865
IACA45 66.32 155.282 .425 .867
IACA50 66.59 153.196 .472 .866
IACA55 65.68 153.955 .534 .864
IACA56 65.78 155.349 .509 .865
IACA57 65.62 157.522 .422 .867
IACA61 66.06 151.848 .561 .862
IACA63 66.12 151.274 .574 .862
The high correlations of each item with the scale and with the alpha score, if the item is removed, show the strong consistency of this sub-scale.
Data of the avoidant bond sub-scale is shown in table 15.
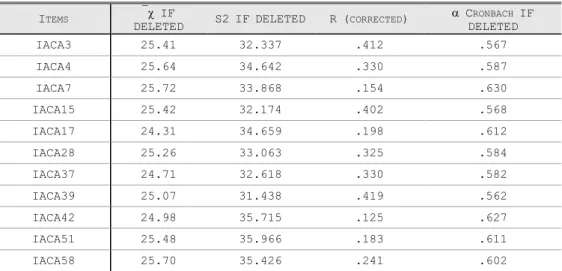
Table 15: Sub-scale “Avoidant bond”
ITEMS IF
DELETED S2 IF DELETED R (CORRECTED)
CRONBACH IF DELETED
IACA3 25.41 32.337 .412 .567
IACA4 25.64 34.642 .330 .587
IACA7 25.72 33.868 .154 .630
IACA15 25.42 32.174 .402 .568
IACA17 24.31 34.659 .198 .612
IACA28 25.26 33.063 .325 .584
IACA37 24.71 32.618 .330 .582
IACA39 25.07 31.438 .419 .562
IACA42 24.98 35.715 .125 .627
IACA51 25.48 35.966 .183 .611
IACA58 25.70 35.426 .241 .602
III
EMPIRICAL RESULTS
3.1
DESCRIPTIVE AND CORRELATIONAL ANALYSIS OF DATA BY SUB-
SAMPLEThe following data concerns the univariate descriptive analysis (per gender) that has been conducted in each sub-sample: E1 (6-8 year-old children); E2 (11-14 year-old adolescents); E3 (15-18 year-old adolescents).
The strategy for presentation analysis and discussion of results is as follows:
1. Presentation, analysis and discussion of selected data from E1 sub-sample;
2. Presentation, analysis and discussion of selected data from E2 and E3 sub-samples.
3.1.1 PRESENTATION AND ANALYSIS OF SELECTED DATA FROM E1 SUB-SAMPLE
The following objectives were ascribed to the cross-sectional descriptive and correlacional analyses of data issued from E1 sub-sample:
Correlacional analysis of relevant medical and behavioural antecedents (pregnancy,
birth, newborn, 1st infancy, 2nd infancy, including type and time-length of
hospitalisation, type, posology and time-length of prescribed medication’ use). actual
health status and actual child behaviour (including behaviour at home, social and pedagogic adaptation at school and early signs of health risk behaviours)
Therefore, keeping in mind both the theoretical assumptions of this study and the above mentioned objectives a set of questions have been formulated:
1. Has the child’s pregnancy been disturbed by any medical problems of his/her
mother?
2. Have there occurred during pregnancy family risk situations with a negative
(compromising) impact on mother’ well-being?
4. What is the mother’ perception concerning the child’ health state in three successive developmental phases: from birth to 24 months; from 3 to 5 years; from 6 to 8 years?
5. What is the rate of occurrence of medical diseases during the 1st infancy, the 2nd
infancy and the latency period?
6. Is there any reference to accidents during the above-mentioned periods?
7. What is the complete hospitalization rate from birth to 24 months; from 3 to 5
years; from 6 to 8 years?
A brief comment on the results of the descriptive analysis ran on data from E1 will be subsequently presented.
To begin with, the marital state of the parents of the 225 children that have been assessed can be consulted on the next table
Table 16: Marital state of the parents
N % column
MARITAL STATE
Single 8 3.6%
Married 188 85.1%
Marital union 10 4.5%
Separated 4 1.8%
Divorced 7 3.2%
Widowed 3 1.4%
Other situation 1 .5%
As expected, since this is a general population sample scrutinized in routine appointments of primary care services, the parents are, for their most part (86.9%), married or living in marital situation.
Table 17: Maternal health /obstetrical problems
n Column N %
THIS CHILD’S PREGNANCY WAS MEDICALLY SURVEYED
Yes 216 96.4%
No 8 3.6%
In spite of the fact that nearly all mothers (96.4%) report that this was a medically assisted pregnancy about 43% of them recall. at least. one obstetric problem (most frequently 1st trimester sickness and danger of premature delivery) whilst a little more than 1 out of
every 10 women (14%) reports more than one obstetric problem during this child’s
pregnancy.
Table 18: Serious obstetric problems during pregnancy
n Column %
SERIOUS OBSTETRIC PROBLEMS DURING PREGNANCY
None 193 85.8%
One or more serious problems 32 14.2%
As one can verify by the observation of the previous table, a similar percentage of these mothers (14%) report antecedents of serious obstetric problems (according to medical standards).
Table 19: Place, time-length of pregnancy and type of delivery
n Column N %
PLACE
Public Hospital 211 94.6%
Clinic 5 2.2%
Another place 7 3.1%
TIME-LENGTH OF PREGNANCY
Complete 168 75.3%
Premature 37 16.6%
Post-mature 18 8.1%
TYPE OF DELIVERY
Normal 147 66.2%
Caesarean 40 18.0%
Forceps 25 11.3%
Cupping-glass 10 4.5%
Table 20: Family risk during pregnancy
n Column N %
FAMILY RISK SITUATIONS DURING PREGNANCY
No 157 74.8%
Yes 53 25.2%
Descriptive data from the previous table shows that ¼ of this sample. i.e., 25% of the inquired mothers, reports the occurrence of familial risk situations during pregnancy. Several categories of events have been included in this variable: health problem of father/another son
or daughter (2.4%); accident of a close friend or family member (3.3%); “mourning” for the
loss of a significant other (6.2%); father’s prolonged or frequent absence (3.3%); maternal
depression (4.3%); conflict in the couple (2.4%).
In line with the importance attributed in the literature to maternal depression it is noticeable that all life events scrutinized in this sample can be clinically classified as emotional troubles of a depressive, or an anxious-depressive, nature.
Conversely, if the evocative memory related to two particular classes of events
(“mourning” and “depression”) is appropriately emphasized it is possible to attain a figure of 10% for the antecedents of depression during pregnancy in this general population sample
(not forgetting. of course. the “diminished” mnesic accuracy attributable to the retrieval of
events that happened. at least. 6 years before the time of the inquiry).
Table 21: Necessity of treatment during the newborn period
n Column %
TREATMENT DURING THE NEWBORN PERIOD
No 189 88.7%
Yes 24 11.3%
By consulting the previous table it is possible to conclude that a little more than 1 out of ten children (11.3%) from this sub-sample have required some sort of treatment during the early post-partum period.
Information to be retained is that the majority of the children have grown rather well, since their parents report that they were vigorous and in good health immediately after birth. It is also relevant to notice that the 1st infancy is the period were there is an higher percentage of children perceived by their parents as having a fragile health (13.1%). Will this figure be linked to the one that has been found for the precedent variable (necessity of treatment during the newborn period)?
Table 23: Medical diseases during childhood
n % Column
FROM BIRTH TO THE 2ND YEAR
No 108 51.2%
Yes 103 48.8%
FROM 3 TO 5 YEARS OLD
No 113 51.1%
Yes 108 48.9%
FROM 6 TO 6 YEARS OLD
No 133 62.7%
Yes 79 37.3%
Data shown in this table is in line with the (expectable) prevalence of the “usual”
childhood diseases (e.g., othitis, rhinitis, rhinofaryngitis). However, despite the frequency of these medical episodes throughout the early childhood years, their rate lowers to approximately 1/3 (37.3%) during the first sub-phase of the latency period (notice that the children of this sub-sample are precisely 6-8 year-old at the time of the survey).
These data on the medical-psychological antecedents reported to the first two years of
life shows that almost 9 out of every 10 mothers (86.9%) remember that their baby “grew rather well” in this early developmental period (table 23). It isn’t then surprising that only
14% of them have often paid a visit to the family doctor/ the paediatrician (even though ¾ of
the mothers has fulfilled the medical appointment’ periodicity suggested in their son’
individual health bulletin). Notice also that the percentages of the reporting of health problems (48.8%) and of the taking of prescribed medications (47.3%) are rather alike in this early developmental phase.
The medical antecedents referred to the toddler a little further on (3-5 years-old) show a similar pattern. Actually, 90.1% of the mothers remember their children at this age as being
In relation to the actual health state of the children of this sub-sample (6-8-year-olds) it must be stressed that:
The percentage of mothers assuming that their children are vigorous and in good
health is a comparable one, and there is even a lesser reference to somatic health problems (only for 1/3 of the children. i.e., 37% of this sub-sample). In contrast. about ¼ of these children suffer frequently from somatic-functional complaints (mostly headaches and abdominal-aches);
The attendance to medical appointments is lower in this phase (half the children
attend a medical appointment occasionally and 37.7% regularly) and the taking of prescribed medication follows a similar tendency (it applies only for ¼ of the sub-sample. meaning that about 28.4% of them take some form of prescribed medication.
Table 24: Accidents during childhood
n Column N %
FROM BIRTH TO THE 2ND YEAR
No 204 94.4%
Yes 12 5.6%
FROM 3 TO 5 YEARS OLD
No 184 86.8%
Yes 28 13.2%
FROM 6 TO 6 YEARS OLD
No 190 96.4%
Yes 7 3.6%
As it can be observed, accidents are relatively rare during childhood. The sole exception to this rule is the accident rate of 13% reported by the parents for the 3-5 year-old toddlers. Curiously enough there is equivalence between this rate and the one of complete hospitalization (particularly if it lasts for less than a week) reported to the same period.
Table 25: Hospitalizations during childhood
n Column N %
FROM BIRTH TO THE 2ND YEAR
No 160 87.0%
Yes 24 13.0%
FROM 3 TO 5 YEARS OLD
No 172 86.4%
Yes 27 13.6%
FROM 6 TO 6 YEARS OLD
which has a time length of less than one week for 82% of the hospitalized toddlers). Moreover, for ¾ of the children this is a one-time experience (as in the previous period).
Regarding the causes of hospitalization, for 60% of these children it had to do with a medical or surgical pathology, for 7% of them it was due to accident whereas for the remnant 32% of the children their parents reported other (miscellaneous) reasons, often of an unspecified nature.
Episodes of more recent (actual) hospitalization (those concerning the 6-8 year-old subgroup) are reported by the parents of 8.2% of these children. Usually it is a unique hospitalization (80% of the cases) taking no more than a week, and triggered either by medical illness (40%) or by accident (13%).
The next table shows objective data from the medical observation performed on these children by the family doctor.
Table 26: Children’ health state (medical evaluation)
n Column N %
GLOBAL HEALTH STATE
Normal 211 96.8%
Deficient 7 3.2%
After these results it is possible to conclude that this is a healthy general population sample, since a little more than 9 out of ten children (96.8%) are considered in good health.
In what concerns now the early behaviour of these children, 84% of the mothers remember that, as toddlers (0-2 years) they used to eat well, but, quite the reverse, that 1/3 of them presented sleeping problems (for 16.4% irregular sleeping rhythm and for 13.8% overnight restlessness).
Also the almost totality of the mothers (90%) remember their offspring as being interactive and socially dynamic in this early developmental phase. About two thirds of the toddlers (66.8%) have been placed in a nanny or in kindergarten. and for the most part (74%) they have had a good adaptation from the beginning. For the remnant 19.7% there has been a
difficult adaptation, apparently quickly resolved.
Regarding now the behaviour pattern for the 3 to 5 year olds it is worth noticing that:
The eating behaviour seems more problematic. since 30% of the mothers
¾ of these children have never had sleeping problems (however 17.3% of the mothers report occasional insomnia episodes);
¼ of the children (25.5%) have used a transitional object to deal with separation
anxiety. Such fact can be linked both to the need of adapting to the kindergarten (rather normative at this pre-school age) and to the (related) difficulty in dealing with such social exigency (thus, for about 6 in every 10 children, the adaptation process has been a difficult one, in the beginning for 39% of them and persistently for 20.3% of the study sample);
One third of the mothers (33.3%) recall their sons’ difficult social behaviour, most particularly restless behaviour/instability (14%) and frequent disobedience (6.8%);
As to the actual behaviour of the sample’ children (school phase) it is possible to verify that:
The proportion of eating difficulties is analogous to the one of the precedent period (it
concerns, in fact, almost 1/3 of the children. and is distributed between capricious eating habits and opposition to meals, for 16.4% and 12.2% of them, respectively);
Problematic sleep concerns approximately 1 in every 10 children and takes mainly the
form of insomnia or frequent nightmares (with reported rates of 36.4% and 38.5% respectively);
Troubled behaviour reportedly affects ¼ of the sub-sample (23.8% of the subjects),
chiefly “defiant” stubbornness (with a 14.2% rate) and the conjunction timidity/social
inhibition (12.7%).
10% of the parents have already taken their sons to a medical-psychological appointment (94% of these children have benefited/ still benefit from some form of psychotherapy, or from orthophony and/or psychomotricity) and the rate of psychotropic medication is relatively low (8% of the children).
3.1.1.1 PERCEPTION OF ATTACHMENT QUALITY
Table 27: Attachment quality scale – PCV-M
N Minimum Maximum Standard
deviation
DIFFICULTIES IN EMOTIONAL SELF
-REGULATION 195 25 60.00 47.0205 8.7145
SECURE-BASE BEHAVIOUR 195 8 35.00 28.5949 5.6491
SHARING OF AFFECTION 195 8 35.00 27.4205 5.7783
SOCIAL DESIRABILITY 195 8 33.00 19.7949 4.8947
TOTAL ATTACHMENT SCORE 195 77 157.00 122.8321 17.3589
When analysing the average values calculated for the maternal perception of children’
attachment behaviour (measured through PCV-M) it is possible to conclude that the scores obtained for this sub-sample show a high dispersion around the mean values, as well as a considerable amplitude.
In fact, the dimension “Difficulties in emotional self-regulation” could variate, in
theoretical terms, between 12 and 60 and the other dimensions between 7 and 75. Nevertheless the sum of the mean values allows concluding that, with the sole exception of
In brief, the following profile for this sub-sample may be drawn up:
1. Almost all mothers (96. 4%) had a medically assisted pregnancy. although about half
(43%) mentions an obstetrical problem and ¼ remembers traumatic occurrences during pregnancy;
2. Generally speaking, mothers remember their children as being “strong and healthy” as
babies, toddlers (3-5 years) and schoolchildren (rates above 90% for each period);
3. The rate of the allusion to medical problems decreases steadily throughout childhood (it
stands at 49% for the preschool period. and goes down to 1/3 during the school period), as
does the prescribed medication rate (that concerned half of the children’s sample during the
first infancy and only ¼ of them at school age);
4. The retrospective perception of child’s behaviour quality (sleeping/ eating/ social
behaviour) shows different trends. Thus: eating difficulties are reduced until the end of the second year of life (1 in every 10 infants), increase moderately throughout the following
phases (for 1/3 of the sample); conversely, sleep-related problems (mainly. restless sleep
and insomnia) tend to decrease throughout childhood (from 1/3 as toddlers. to 10% of the
schoolchildren of the sample); on the other hand the behavioural changes present a “hectic”
curve: from very few for toddlers, they are mentioned by 1/3 of the mothers during the preschool period of their children (mainly instability and persistent disobedience); they come down slightly during school age (in fact. they are mentioned by ¼ of the mothers who
emphasize both “defiant” stubbornness - 14.3% - and. in the opposite side. timid/inhibited behaviour - 12.7% - of their children during this developmental period);
5. Adaptation difficulties (to kindergarten and to school) seem to be more accentuated
between 3 and 5 years of age (1/4 of the mothers report the use of a “transitional object” by
the child. and this “mark” of separation anxiety may underlie the difficulties of adaptation to
kindergarten – initial in 40% and persistent ones in 20% of the sample); as to the school
3.1.2 PRESENTATION AND ANALYSIS OF SELECTED DATA FROM E2 AND E3 SUB
-SAMPLES
The following specific objectives were ascribed to the cross-sectional descriptive and correlacional analyses of data issued from E2 (11-14 year olds) and E3 (15-18 year olds)
adolescents’ sub-samples:
To study the correlation between relevant medical and behavioural antecedents. the
actual health state (including the use of prescribed medication) and the adolescent’
behaviour (including age of first use for tobacco. alcohol and other drugs.
characteristics and background of the 1st experience of substance use. actual features
of those behaviours).
The statistical description of the survey’ variables will respect the following procedures:
Joint presentation of data from both adolescents’ subgroups (E2+E3);
Focus on data concerning the variables from the psychosocial auto-questionnaire and
both attachment scales (IPPA and IACA) following procedures of correlacional analysis by gender/subgroup whenever necessary.
The data to be presented in this section concerns the 362 youngsters of the global adolescent sample (E2 and E3) aged 11 to 18 years old and whose mean age (for the 347 subjects of this sample who have mentioned it) is 14.48 years old (14.43 for the boys and 14.55 for the girls, with a SD of +/- 2.4 for both genders). The distribution by gender reveals
a slight predominance of girls – actually 55.7% (201) are girls and 44.3% (160) boys.
3.1.2.1HEALTH STATE
Following a strategy similar to the one used for the display of data of E1 sub-sample the first results to be presented concern the youngster’ perception about their health state.
Therefore, in what respects body image and bodily preoccupations, 6 in every 10
adolescents (63.3%) perceive their body (size vs. weight) as a “normal” one, and only a little
On the same subject, half of the girls (53.3%) would like to loose weight (against 20% of the boys) and, for 4.6% of the youngsters, this seems to be the problem they are most worried about. There is a significant statistical difference (for p<.0001) in the correlacional
analysis by gender, favouring, as expected, the girls.
The distribution of somatic-functional complaints amongst the adolescents of the study
sample is exposed in the next table.
Table 28: Somatic-functional complaints N
OBSERVED %
N
EXPECTED RESIDUES
NO COMPLAINTS 5 1.4 88.5 -83.5
1-2 COMPLAINTS 53 15.0 88.5 -35.5
2-4 COMPLAINTS 107 30.2 88.5 18.5
>=5 COMPLAINTS 189 53.4 88.5 100.5
TOTAL 354 100
X2=211.017 gl=3 p=.000
As it can be observed the tendency for the “aggregation” of somatic-functional complaints seems to be the rule at this age. Nevertheless the reference to troubled sleep, aches (headache, abdominal pain, muscle pain) and anxious-depressive feelings (nervousness, Boredom, sadness, hopelessness) is a particularly relevant one.
The next table shows the quantitative distribution of these symptoms by gender:
Table 29: Somatic-functional complaints by gender
GENDER
TOTAL FEMALE MALE
SOMATIC-FUNCTIONAL COMPLAINTS
No complaints
n 2 3 5
% 1.0% 1.9% 1.4%
ra -0.7 0.7
1-2 complaints
n 22 31 53
% 11.2% 19.6% 15.0%
ra -2.2 2.2
2-4 complaints
n 54 53 107
% 27.6% 33.5% 30.2%