Vol.57, n.1: pp. 119-125, January/February 2014
ISSN 1516-8913 Printed in Brazil BRAZILIAN ARCHIVES OF
BIOLOGY AND TECHNOLOGY
A N I N T E R N A T I O N A L J O U R N A L
Biofiltration of Volatile Organic Compounds of Brazilian
Gasoline
Joana Antunez Rizzolo
1, Vanessa Cristina de Castro Santos
1, Marlene Soares
2, Adenise
Lorenci Woiciechowski
1and Carlos Ricardo Soccol
1*1
Departamento de Engenharia Química; Divisão de Engenharia de Bioprocessos e Biotecnologia; Universidade
Federal do Paraná; Curitiba - PR - Brasil. 2Departamento de Química e Biologia; Universidade Tecnológica
Federal do Paraná; Curitiba - PR - Brasil
ABSTRACT
Gasoline vapors pollute the atmosphere and can be harmful to human and animal health. Tons of particles of this pollutant are expelled to the atmosphere, generating great economic losses to the industries and serious damage to the environment. Biofiltration is an option of simple technology with low costs that can be used for the gasoline vapor treatment. The present study was carried out in two biofilter systems of laboratorial scale. The biofilter system 1 was operated with a total volume of 2.72 L (four columns) and the biofilter 2 with 2.04 L (three columns) of total volume. Both of them were operated in sequence, with airflow of 450 mL entering each one. Results obtained were as follows for the removal efficiency (RE) of different gasoline vapor concentrations in the air: 1.3 g.m-3 during 35 days, RE of 100%; 3 g.m-3 during 52 days, RE of 90%; 4.5 g.m-3 during 48 days, RE of 70-80% and
8g.m-3 during 28 days, RE of 70%.
Key words: biofiltration, volatile organic compounds, gasoline, atmospheric pollution
*Author for correspondence: soccol@ufpr.br
INTRODUCTION
Many petrochemical industries and refineries are getting more concerned toward the losses involved in the emissions of volatile organic compounds (VOC) to the atmosphere. These losses bring consequences as damages to the health of the workers, to the environment and also huge financial losses, because tons of products are
thrown in the atmosphere. Atmospheric
contamination by gasoline’s vapors can be associated to the storage, distribution, supply of vehicles as long as the remediation of impacted areas due to accidental spilling of fuel and refined products. Impacted areas usually are submitted to a remediation process for vapor extraction from the ground (SVE-soil vapor extraction), or
(Hodge and Devinny 1994). The pollutant is removed from the air by dissolution, sorption and bio-oxidation; in other words, it is dissolved into the active biofilm and adsorbed by the support, being available for biological oxidation, a process that remains dynamically (Soares 2006). Biofiltration processes can be economic and efficient due to their low operational and capital costs, together with the effective removal of the pollutant, low pressure drop and their ability to treat aid-producing contaminants (Gerrard et al. 2010).
In the USA, the maximum of ethanol allowed concentration is 10%, while in Europe it is only 5%. For economic and environmental reasons, “C gasoline” is commercialized in Brazil. “C gasoline” is a mixture of gasoline with 20-25% (V/V) of ethanol (Rizzolo et al. 2012). In Brazil, flex fuel cars, i.e. vehicles that can run both with gasoline and ethanol, were firstly commercialized in 2003. Since then, production increased continuously, reaching 87% of national car production in 2010 (ANFAVEA 2009).
The objective of the present study was to evaluate the performance of two biofiltration systems at laboratory-scale exposed to increasing Brazilian gasoline (“C gasoline”, with 20-25% of ethanol) concentrations, related to the total petrol hydrocarbon (TPH) degradation.
MATERIAL AND METHODS
System of biofiltration
Two lab-scale biofiltration systems were used under identical conditions, operating in parallel. The biofiltration system 1 (BS1) was fitted with four columns placed in sequence and the
biofiltration system 2 (BS2) with three columns, also placed in sequence. The columns were made of glass with 6.6 cm of internal diameter and 20 cm of bed height and 680 mL of working volume each. The BS1 had a total volume of 2.72 L (four columns) and the BS2 2.04 L (three columns). To maintain the temperature of the columns, they were immersed into a warm bath maintained at 30°C, supported by the collector bottles fixed to the bottom tank by claws. Periodically, the columns were humidified with Bushnell Hass mineral medium, sprinkled at the top of each one to avoid bed drying. The liquid that passed through the column was recovered at these collectors bottles placed at the bottom of the columns. The gasoline used in this work contained 20-25% of ethanol (C gasoline).
Support
The medium support was constituted by organic compound product obtained from the composting process and from tire scraps in the ratio of 2:1 (in volume). The organic compound used was mainly organic matter obtained through the biological decomposition of vegetable scraps and animal waste by microbial action during the composting process. The company that provided the organic compost applied a technology for rapid composting of organic waste, such as sludge from the sewage treatment plants, organic fraction of urban waste and tree pruning. The materials were sifted out to select the particles between 2.8 – 4.2 mm. Tire scraps were prepared by cutting the old tires into small pieces. The biofiltration process was carried through during 190 days in the mounted biofilters as shown in Figure 1, with ascending air flow at the columns.
Figure 1 - Biofiltration setup: (1) Compressor; (2) Flowmeters; (3) Bath 30º; (4) Humidifier; (5)
The air-flow was generated by a compressor at a
rate of 900 mL.min-1 (450 mL.min-1 for each
biofilter), resulting in six min of total retention time of the contaminant in BS1 and 4.5 min in BS2. The retention time was a relative measure of the contaminant residence time in the empty bed. Air enters into the system through two parallel lines: one for humidification and other to promote the volatilization of gasoline.
System to feed the contaminant
C gasoline was fed at the systems through a syringe pump (11), controlled by a plate for electronic assembly StepLab with microcontroller codified to pump a desired amount of fuel into the fuel reservoir (5) (beginner's all-purpose symbolic instruction code step). The gasoline was dripped into the fuel reservoir (5) kept at 30°C that also received air from the compressor at a flow of 100
mL.min-1, enough to evaporate and carry the C
gasoline contaminant to the mixer reservoir (6). The bottle of humidification (4) received the
remaining air outflow of 800 mL.min-1; the
gasoline vapor and humid air flows were directed to a mixer (6). Then, the homogenized gas was divided in two flows to feed the two system filters (Fig 1).
The columns were humidified weekly with the mineral medium for nitrogen supplementation, minerals supply and to buffer and humidify the bed. Also, weekly the liquid that drained from the columns recovered at the flask placed at the bottom of each one was recirculated to the top of the columns. During the experiment to evaluate the systems performance the following gasoline vapor concentrations at the inlet air were tested:
1.3 g.m-3; 3 g.m-3; 4.5 g.m-3 and 8 g.m-3. The
following operational parameters were evaluated:
Control of the flow
It was carried out by measuring the flow-meters (2).
Loss of load
It was determined by the measurement in
distinguishing manometers of pipe in U filled with
water; the result was expressed in mmH2O.
Empty bed retention time (EBRT - empty bed
residence time in minutes)
Q
V
EBRT
=
(min)WhereEBRT (min), V: biofilter volume (m3) and
Q: gas flow (m3.min-1).
Elimination capacity (EC)
V
gas
C
gas
C
Q
EC
=
(
in−
out)
(g.m-3.h-1)WhereEC (g.m-3.h-1), Q: gas flow (m3.h-1), C
ingas
and Coutgas: TPH concentrations at the inlet and
outlet of the biofilter, respectively, (g.m-3) and V:
biofilter volume (m3).
Organic load (OL)
V
gasQ
C
OL
=
in (g.m-3.h-1)Where OL (g.m-3.h-1), C
ingas: TPH concentration
at the biofilter input (g.m-3), Q: gas flow (m3.h-1),
V: biofilter volume (m3).
Removal efficiency (RE)
100 ) (
in out in
C C C
RE= − (%)
Wherein ER (%), Cingas and Coutgas: TPH
concentrations at the inlet and outlet air of the
biofilter, respectively, (g.m-3).
Chromatographic analysis
The analysis of the TPH was done using a gas chromatograph (CG) Schimadzu, model CG 17A, with detector of ionization of flame (FID - flame ionization detector). The chromatographic column used was a Hewlett-Packard, capillary column model HP-5 (Crosslinked 5% ME Siloxane), of 30 m length, 0.32 mm of internal diameter and film
with 0.25 µm of thickness (Soares 2006). The
temperature of the injector and detector were 300 and 225ºC, respectively. The oven was programmed with a following temperature ramp initiating with 30ºC, held for 5 min;
elevation 2ºC.min-1 until reaching 40ºC; elevation
25ºC.min-1 until 225ºC maintained for 2 min;
elevation 25ºC.min-1 up to 250ºC and maintained
RESULTS AND DISCUSSION
The pH remained constant during the experiment around 7.0, considered excellent value for the microbial growth. The pressure drop of load was measured during the whole experiment time. At the end of the experiment, for BS1 the pressure
drop was of 23 mm of H2O and for BS2, it was of
30 mm H2O. The pressure drop could be caused by
several reasons, such as the compactation of the support and the microbial growth occupying the empty spaces. Considering the fact that the pressure drop was higher at BS2 with one column less, this condition led to a bigger organic load applied to the BS2, favoring the microbial growth, causing further pressure drop compared to the
BS1. This would also explain why the removal efficiency of both biofilter systems were similar even with BS2 having one column less. Soares (2006), working with the same apparatus of the present study, obtained for compost support,
pressure drop of 11 and 13 mmH2O for one
column and for two columns in series, respectively. Using tire scraps as support, the
system showed 9 and 12 mmH2O for one and two
columns in series, respectively after 210 days of biofiltration. Figures 2 and 3 present the removal efficiency of BS1 and BS2 along the experiment days for each gasoline concentration along with the concentration of inlets and outlets during the operating time.
Figure 2 - Biofiltration system 1 performance, measured in the exit of the fourth column.
Figure 3 - Biofiltration system 2 performance, measured in the exit of the third column.
Even having a syringe pump to feed the contaminant to the biofilter systems, the gasoline vapor concentration of each organic load studied varied hardly, due to operational difficulties
relatively constant performance of the systems at each period. Figures 2 and 3 showed that after increase in pollutant concentration increase at each point, the systems presented a corresponding increase at the TPH concentration at the exit of the system and a fall at the removal efficiency of the biofilters systems that tended to recover the efficiency after some time. This was due to the gradual adaptation of the microorganisms to the new imposed conditions.
The biofilters were operated with gasoline
concentration at the inlet air of 1.3 g.m-3 during 35
days; 3 g.m-3 during 52 days; 4.5 g.m-3 during 48
days and 8 g.m-3 during 55 days. At the three first
periods, no significant loss of efficiency removal was detected. After a short period of adaptation, both the systems recovered the activity. With the
gasoline concentration at the inlet air of 8 g.m-3,
the removal efficiency of the systems fell considerably. However, after some days, it improved. Probably this concentration was excessively high for the microorganisms, demanding a longer time of acclimatization. Although the two biofiltration systems presented similar efficiencies, but BS1 resulted in better efficiencies than BS 2, probably due to the presence of one biofiltration column. For BS 2, where the total residence time was smaller than at BS1, the RE oscillated a lot mainly with gasoline
concentration at the inlet air of 8 g.m-3, showing an
instability degree and the importance of the total residence time. The total retention time at BS1 was of 6 min, considering that it had four columns, each one with the time of 1.5 min. For BS2, the total retention time was of 4.5 min for the three columns. As evident, around 20 days were enough to start-up the biofiltration process and to reach
efficiency of removal of 100% for 1.3 g.m-3. For
higher gasoline concentrations at the inlet air, a longer period of time was required until the biofilter systems achieved a good microbial acclimatization and an improvement in the removal efficiency.
Misiaczek et al. (2007), studying the degradation
of toluene in a trickle bed reactor with a constant
inlet concentration of 100 mg.m-3, achieved stable
removal efficiency above 95% after a week of
operation showing that lower pollutants
concentration could be degraded much easier and much faster than higher concentration, even if they needed a time of acclimatization. Soares (2006)
reported efficiencies of 90 to 100% for 2 g.m-3
using one biofilter of compost and one of tire to
treat A gasoline. Mathur et al. (2007), studying the
biofiltration of BTEX reported efficiency of 100%
for 0.681 g.m-3. However, for 1.6 g.m-3, the
efficiency was of 60%. Namkoong et al. (2004)
found that longer times of residence were required for complex mixtures as gasoline and they had used retention times of 4 and 10 min for gasoline vapors, getting better results with the longest time. Soares (2006), using retention time of 3.4 and 6.8 min for the biofiltration of gasoline vapors on
different supports and varying pollutant
concentrations, achieved the removal efficiencies higher than 94%, indicating that the removal efficiency was connected to the residence time. Smaller RE was obtained for a smaller retention time and longer residence times were more efficient for the biofiltration pollutant processes
(Namkoong et al. 2004). Namkoong et al. (2003)
reported ER around 80% of TPH during the study with compost media, with concentrations varying
from 50 to 7800 mg.m-3. Lu et al. (2006) studied
the degradation of up to 2 g.m-3 of gasoline with
three microbes together, achieving the RE of 82%. Table 1 shows the RE (%) of the BS1 and BS2 of the various inlet air concentration studied showing that mixing populations were efficient for the degradation of the components of the gasoline. The lower performance of the BS2 was due to the lower number of columns in the biofiltration system.
Table 1 - Average removal efficiency of the
Biofiltration Systems 1 and 2.
Inlet air concentration of TPH (g.m-3)
Removal Efficiency (%)
BS1 BS2
1.3 100 100
3 90 80-90
4.5 80 80
8 70-80 70
Table 2 shows the organic load applied to the biofilters systems 1 and 2. The organic load (OL) was calculated for each average pollutant concentration at the inlet air of the biofilters systems (Table 2). BS2 received more contaminant
per total bed volume (39.7, 59.6 and 105.9 g.m-3
.h-1) than the BS1 (29.8, 44.7, 79.4 g.m-3.h-1), from
the concentration of 3 g.m-3, 4.5 and 8 g.m-3.h-1,
because the BS2 had one column less than the BS1. However, only for the concentration of
1.3 g.m-3, both systems were operates with four
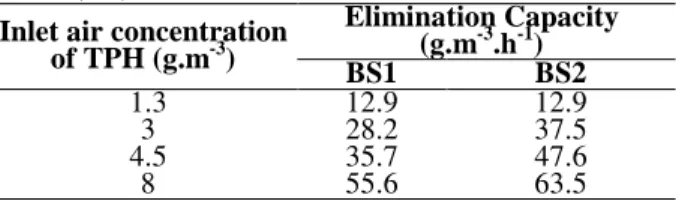
Table 3 shows the elimination capacity (EC) of the biofilters systems 1 and 2. The elimination capacity was higher for BS2 because this system was mounted with only three columns, except for
the organic load of 1.3 g of TPH.m-3, when both the
systems were mounted with four columns each. But even operating with three columns for the other organic load tested, both the systems presented very similar removal efficiency. This meant that with less active volume, BS2 obtained practically the same gasoline removal and higher elimination capacity.
Table 2 - Organic Load of the Biofiltration System 1
and 2.
Inlet air concentration
of TPH (g.m-3) Organic Load (g.m
-3 .h-1)
BS1 BS2
1.3 12 .9 12.9
3 29.8 39.7
4.5 44.7 59.6
8 79.4 105.9
Table 3 - Elimination capacity of biofiltration system 1
and 2 (EC).
Inlet air concentration of TPH (g.m-3)
Elimination Capacity (g.m-3.h-1)
BS1 BS2
1.3 12.9 12.9
3 28.2 37.5
4.5 35.7 47.6
8 55.6 63.5
Torkian et al. (2003) studied the biodegradation of toluene and xylene in a biofilter with compost support; the organic loads were 80 and
78 g.m-3.h-1, respectively. The elimination capacity
was of 73 g.m-3.h-1 for both the contaminants. The
results were lower than the present study. The authors studied just two types of contaminant while in this study, gasoline was used that contained high number of compounds and still the biofiltration was efficient. Álvarez-Hornos et al. (2008), studying the biofiltration of ethyl benzene vapors with turf support, reported a capacity of
maximum elimination of 45 g.m-3.h-1 for an
organic load of 55 g.m-3.h-1. Soares (2006)
achieved 26.5 and 30.8 g.m-3.h-1 of EC; 31g.m-3.h-1
of OL for C gasoline, similar values to the values found in the present study.
CONCLUSIONS
The biofiltration of C gasoline vapors using the
compost support with tire scraps (2:1) revealed to be an adequate alternative and an efficient way for reducing these pollutants vapors concentrations from the air. The process was simple and cheap, presenting the advantage of using a waste (tire) and a treated residual organic material (compost) as support material for the biofilter bed. The biofilters presented constant pH around 7.0, indicating that there was no oxygen limitation, even for high organic load. The lack of oxygen would have created anaerobic condition with the production of acids and consequent reduction of the pH, a fact that did not occur. Therefore, according to the pH results, during the whole biofiltration process, there were an availability of final electron acceptors for the aerobic respiration
and the aeration of 450 mL.min-1 and the residence
time of 6 min (BS1) and of 4.5 min (BS2) were appropriate for this. The removal efficiency obtained was excellent. The biofiltration was more efficient for the lowest gasoline vapor
concentration. For 1.3 g.m-3, the RE was 100%; for
3 g.m-3 it was 90%; for 4.5 g.m-3 the RE was
70-80%, and for 8 g.m-3 it was 70%, but it was still a
good result. This study showed that it was possible to test still higher concentrations to find a threshold of biodegradation of gasoline vapors in the studied conditions.
ACKNOWLEDGEMENTS
We thank CAPES, CNPq and Bioprocesses Engineering and Biotechnology Department of the Federal University of Paraná for the support and the possibility of development of this research.
REFERENCES
Álvarez-Hornos FJ, Gabaldón C, Martínez-Soria V, Martín M, Marzal P, Penya-roja JP. Biofiltration of ethylbenzene vapors: Influence of the packing material. Bioresource Technol. 2008; 99: 269 - 276.
ANFAVEA – National Association of Automobile Manufactures – Office of Economic Planning and Statistics, Brazilian Automobile Industry, Associated Companies, 2009.
Gerrard AM, Havranek J, Novak V, Halecky M, Jones K, Soccol CR, et al. Modeling the steady state and dynamic conditions of a biotrickling. Braz Arch Biol
Technol. 2010; 53: 1225 - 1234.
Hodge DS, Devinny JS. Biofilter treatment of ethanol vapors. Environ Prog. 1994; 13: 167 - 173.
Lu S, Wang H, Yao Z. Isolation and characterization of gasoline-degrading bacteria from gas station leaking-contaminated soils. J Envir Sci. 2006; 18: 969 - 972.
Mathur AK, Majumder CB, Chatterjee S. Combined removal of BTEX in air stream by using mixture of sugar cane bagasse, compost and GAC as biofilter media. J Hazard Mater. 2007; 148: 64 - 74.
Misiaczek. O, Paca J, Halecký M, Gerrard AM, Sobotka M, Soccol CR. Start-up and Performance characteristics of a trickle bed reactor degrading toluene. Braz Arch Biol Technol.2007; 50: 871 - 877.
Namkoong W, Park JS, Vandergheynst JS. Biofiltration of gasoline vapor by compost media. Environ Pollut.
2003; 121: 181 - 187.
Namkoong W, Park JS, Vandergheynst JS. Effect of gas velocity and influent concentration on biofiltration of gasoline off-gas from soil vapor extraction.
Chemosphere. 2004; 57: 721 - 730.
Rizzolo JA, Woiciechowski AL, Santos VCC, Soares M, Paca J, Soccol, CR. Biofiltration of increasing concentration gasoline vapors with different ethanol proportions. J Chem Technol Biotechnol. 2012;
87:791 - 796.
Soares M. Aplicação da biofiltração no tratamento de vapores de gasolina. [PhD Thesis]. Curitiba, Brasil: Universidade Federal do Paraná; 2006.
Torkian A, Dehghanzadeh R, Hakimjavadi M. Biodegradation of aromatic hydrocarbons in a compost biofilter. J Chem Technol Biotechnol. 2003;
78: 795 - 801.