Joana Barroso Barbosa Castro
The Impact of the Financial Crisis on the
Financial Constraints of Portuguese Small
and Medium Enterprises
Joana Barroso Barbosa Castro
The Impact of t he F inancial Crisis on t he F inancial Cons traints of P or
Joana Barroso Barbosa Castro
The Impact of the Financial Crisis on the
Financial Constraints of Portuguese Small
and Medium Enterprises
Dissertação de Mestrado
Mestrado em Finanças
Trabalho efetuado sob a orientação do
Nome: Joana Barroso Barbosa Castro
Endereço electrónico: [email protected] Número do Cartão de Cidadão: 13785295 Título dissertação:
The Impact of the Financial Crisis on the Financial Constraints of Portuguese Small and Medium Enterprises
Orientador: Professor Doutor Gilberto Ramos Loureiro Ano de conclusão: 2015
Designação do Mestrado: Mestrado em Finanças
É AUTORIZADA A REPRODUÇÃO INTEGRAL DESTA DISSERTAÇÃO APENAS PARA
EFEITOS DE INVESTIGAÇÃO, MEDIANTE DECLARAÇÃO ESCRITA DO INTERESSADO, QUE A TAL SE COMPROMETE.
Universidade do Minho, ___/___/______
Acknowledgments
My sincere acknowledgments to my supervisor Prof. Dr. Gilberto Loureiro for all the support, guidance, knowledge and advices transmitted along this dissertation. The conclusion of this dissertation would also not be possible without the support of my parents, brothers and boyfriend who always accompanied me throughout this important journey.
Abstract
With the Portuguese financial crisis, companies had to struggle to be able to overcome the difficulties. Some were able to manage those difficulties, but others did not have the possibility to maintain their activity and had to close the doors. But how were their financial constraints affected? What was the impact that the crisis had on small and medium enterprises (SMEs)? To answer these questions, this study analyses the impact of the recent financial crisis and the sovereign credit rating downgrade of 2011 on the financial constraints of Portuguese SMEs, in a way to understand the difficulties that they faced (or still face) after the crisis.
In this dissertation is used the Erel, Jang and Weisbach (2015) approach since their analysis also focus only private firms. According to their methodology, three hypotheses should be tested based on the cash flow sensitivity of cash, the cash flow sensitivity of investment and cash holdings. If a firm is financially constrained, these factors should increase. In this case, the results obtained are not the expected because the three hypothesis purposed are all rejected, indicating that private firms and, more specifically, SMEs were not financially constrained after the financial crisis and the Portuguese sovereign credit rating downgrade in 2011. However, this may not mean that companies were well, but instead that they were even worse than expected, since they did not have the possibility to save cash to finance future investments, nor to retain the cash obtained from the cash inflows or even were not able to use their cash flows to invest.
Keywords: SMEs; financial constraints; cash holdings; cash flow sensitive
of cash; cash flow sensitivity of investment; financial crisis; sovereign credit rating
Resumo
Com a crise financeira Portuguesa, as empresas tiveram de batalhar para ultrapassar as dificuldades. Algumas foram capazes de lidar com essas dificuldades, mas outras não tiveram a possibilidade de manter a sua atividade e tiveram de fechar as portas. Mas como é que foram afectadas as suas restrições financeiras? Qual o impacto que a crise teve nas pequenas e medias empresas (PMEs)? Para responder a estas questões, este estudo analisa o impacto da recente crise financeira e da descida do rating soberano em 2011 nas restrições financeiras das PMEs Portuguesas, de forma a perceber as dificuldades que estas enfrentaram (ou que ainda enfrentam) depois da crise.
Nesta dissertação é utilizada a abordagem de Erel, Jang and Weisbach (2015), uma vez que estes autores também focam o seu estudo em empresas privadas. De acordo com a sua metodologia, três hipóteses devem ser testadas com base na sensibilidade de caixa ao cash flow, sensibilidade do investimento ao cash flow e acumulação de liquidez. Se uma empresa está financeiramente restringida, estes fatores devem aumentar. Neste caso, os resultados obtidos não são os esperados, pois as três hipóteses propostas são todas rejeitadas indicando que as empresas privadas e, mais especificamente, as PMEs não estavam restringidas financeiramente depois da crise financeira e da descida do rating soberano Português em 2011. Contudo, isto pode não significar que as empresas estavam bem, mas sim que elas estavam ainda piores do que se esperava, uma vez que não tinham possibilidade de poupar dinheiro para financiar futuros investimentos, nem para reter dinheiro proveniente dos cash inflows ou nem foram capazes de utilizar os cash flows para investir.
Palavras-chave: PMEs; restrições financeiras; acumulação de liquidez;
sensibilidade de caixa ao cash flow; sensibilidade do investimento ao cash flow; crise financeira; rating do crédito soberano
Table of Contents
Acknowledgments ... V Abstract ... VII Resumo ... IX List of Figures ... XII List of Tables ... XII A. Introduction and Motivations ... 13 B. Literature Review ... 18 B.1. Financial Constraints ... 18 B.1.1. Cash Holdings ... 19 B.1.2. Investment‐Cash Flow Sensitivity ... 19 B.1.3. Cash‐Cash Flow Sensitivity ... 21 B.2. Sovereign Credit Rating ... 22 C. Data Description ... 25 D. Methodology ... 27 E. Results ... 31 E.1. Summary Statistics ... 31 E.2. Analysis of the Results ... 34 E.2.1. Financial Crisis ... 34 E.2.2. Portuguese Sovereign Credit Rating ... 41 F. Final Conclusions ... 48 G. Bibliography ... 51
List of Figures
Figure 1 ... 14 Figure 2 ... 15List of Tables
Table 1 ... 16 Table 2 ... 32 Table 3 ... 36 Table 4 ... 37 Table 5 ... 39 Table 6 ... 40 Table 7 ... 42 Table 8 ... 43 Table 9 ... 45 Table 10 ... 46A. Introduction and Motivations
In recent years, the world financial system has been facing one of the biggest financial crises. This crisis had its blast in 2007 with the collapse of subprime mortgages having a tremendous impact in Europe. When the crisis began in the United States because of the subprime mortgages, the Portuguese GDP was increasing at its best. Portuguese banks were having a more conservative position by lowering their exposure to financial products that were affected by the subprime crisis.1 However, in the end of 2008 the crisis started to have spillover effects in Europe and started to spread to several countries being Ireland, Greece, Portugal, Spain and Cyprus the most affected. All of these countries had the need to request assistance from the International Monetary Fund (IMF), the European Commission (EC) and the European Central Bank (ECB). Portugal requested financial support in April 2011, and in May of that year the Economic Adjustment Program was negotiated between the Portuguese government and the financial institutions. Because of this need of assistance from these institutions, investors were concerned about Portugal capacity to fulfill its commitments. This brought the mistrust from investors in relation to Portugal and that was reflected when rating agencies began to decrease its rating. In the end of 2011 Portugal was considered a country with a “junk” status, i.e., it was placed in the Speculative grade or Non-Investment grade group, which is the rating level for a debtor that has high vulnerability to default risk in adverse changes in economic and business conditions and has high probability to be unable to meet its financial obligations2.
As a result of this financial crisis, countries faced the need to issue more debt. Domestic banks bought most of the debt since governments have high influence on those banks through direct ownership or board position (Becker and Ivashina, 2014). Because of this increase in the sovereign debt holdings the corporate loan supply decreased and companies had difficulties to have access to credit. Becker and Ivashina (2014) argue that in periods of crisis the
1 Pereira, P. T., and Wemans, L. (2012) 2
sovereign debt was a risky investment for banks, so they had to reduce the amount of money available to companies and, as a consequence, companies had to reduce their investments.
To overcome this problem, firms with access to the bond market started to issue more bonds, but those companies that were not able to do this, i.e., the small ones, were not able to have access to such financing mechanisms. The main purpose of this dissertation is to analyze the financial constraints of private firms and, more specifically, SMEs after the recent financial crisis and after the sovereign credit rating downgrade in 2011. The quantity of money that firms had access is an important factor to analyze since it could be a way for firms to survive to the crisis. As a result of the crisis and the rating downgrade, the amount of loans to SMEs began to decrease significantly during the period of 2010-2012 (Figure 1).
Figure 1 - Trends in outstanding SME loans 2010 – 2012 (year growth rates)
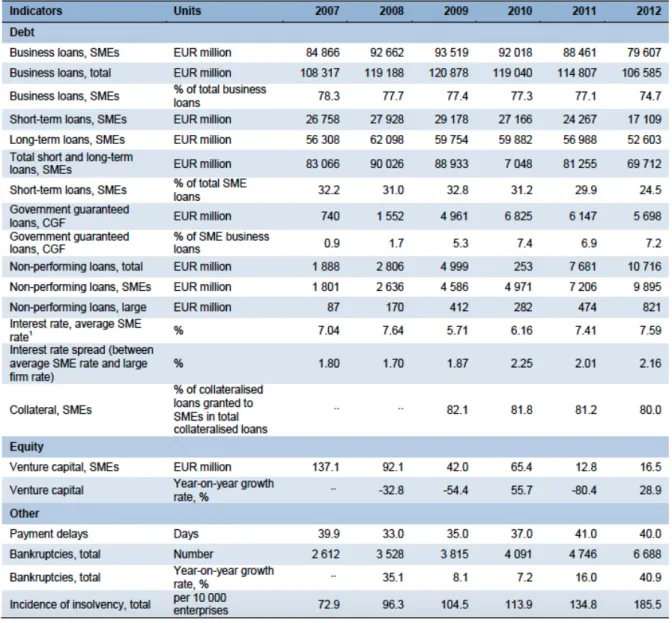
But the government tried to revert this situation by proposing some anti-crisis measures that could give SMEs more easy access to financing and to give support to the companies’ fixed investment and working capital. The Portuguese government launched credit lines of a total of €12.2 billion, with subsidies between 50% and 75% of the loan and with longer maturities.3 During the period of 2007-2012 the amount of loans available to SMEs was more than half comparatively to the total business loans, but after Portugal requested assistance to the International Monetary Fund the amount of money available to lend to small and medium enterprises was the lowest since the beginning of the crisis (Figure 2). This combined with the austerity imposed by the Portuguese government, led companies to have more financial difficulties and some of them even had to cease their activities (see Table 1). Every year since the beginning of the financial crisis the number of bankruptcies has been growing, having a notable difference of almost 2000 companies closing just between 2011 to
3 Financing SMEs and Enterpreneurs 2014: An OECD Scoreboard (2014). Document that analyses the access of SMEs to financing of 31 countries in the period of 2007-2012
Figure 2 - SME loans and total business loans, 2007-2012
2012, reaching a frightening number of 6.688 bankruptcies only in 2012 (Table 1).
According to the OECD Scoreboard of 2014, the number of loans supplied to SMEs had a consistent tendency to decrease since 2010. With the crisis came the high risk, which led banks to require their borrowers more strict lending conditions causing the loans to decrease (Table 1). Banks took this position because the risk of not receiving the payment of loans by companies was high and that is seen in Table 1 in the payment delays that started to increase in 2008.
Table 1 – Scoreboard for Portugal 2007-2012
With the financial crisis in Portugal came a sovereign credit rating downgrade. Since 2009 that Portugal saw it sovereign credit rating to decline gradually, but in 2011, the year of the intervention of IMF and European institutions, the Portuguese sovereign credit rating fell to a level that positioned Portugal in the Speculative Grade group. This had a huge impact on Portuguese companies, not only on the PSI-20 (Portuguese Stock Index) companies but, most importantly, in SMEs. This is the reason why the main purpose of this dissertation is to study how the crisis affected the financial constraints of SMEs. After all, SMEs were the most affected by the financial crisis in Portugal, because comparatively to larger firms they had to struggle (and some of them still do) to survive to the crisis.
As mentioned, the Portuguese financial crisis had several consequences on small and medium enterprises. Therefore, this dissertation analyzes the impact of the sovereign credit rating downgrade in 2011 and, in general, the impact of the financial crisis in Portugal on the financial constraints of small and medium enterprises. To do this analysis the financial constraints are studied in the level of cash holdings, cash flow sensitivity of cash and cash flow sensitivity of investment by following the methodology of Erel, Jang and Weisbach (2015). This methodology is followed because their study is similar to what it is applied in this dissertation, but instead of analyzing the impact of acquisitions, is on the impact of the crisis on SMEs that I will focus. The method of these authors it is a more appropriate and suitable approach to follow since their objective was to study private firms and this dissertation will also address only private firms. What is expected from this study is that it will help to understand how SMEs were affected by the crisis and the 2011 sovereign credit rating downgrade and how they had to change their policies to survive.
B. Literature Review
Throughout the years, there have been several studies about financial constraints of firms. The 2007-2009 financial crisis has made this topic much more crucial and the analysis of the financial constraints of small and medium enterprises became an important issue to understand how these firms were affected by one of the biggest financial crisis in Europe. In this section, is briefly described some of the most important literature about financial constraints and sovereign credit rating. First, it will be analyzed literature about financial constraints, specifically about the three main subjects that will be tested: cash holdings, investment-cash flow sensitivity and cash-cash flow sensitivity. Then, some literature about sovereign credit rating is presented making a relation with financial constraints.
B.1.
Financial Constraints
During the financial crisis, the Portuguese sovereign credit rating started to decrease regularly. To many companies this crisis was their path to darkest times. Some of them were able to overcome the difficulties despite of the impact that it had on them and on their financial constraints, but others did not have the possibility to maintain their activity and had to close the doors. In this section are described some studies about financial constraints to better understand what are these and how they can be affected by the crisis.
B.1.1.
Cash Holdings
The financial constraints topic it is not a recent one. Back in 1936, John Maynard Keynes defended that to protect themselves against future financial constraints, firms hold cash if there are frictions in the financial markets.4
The European financial crisis has led SMEs to change their saving policies. Along with the crisis, external finance became more costly and the concern on how to finance current and future investments was larger. With more expensive external finance, SMEs saw the need to save more cash in a way to finance their future investments.5 The results of Opler, Pinkowitz, Stulz and Williamson (1999) confirm this fact. According to their results, smaller firms, firms that have more growth opportunities are the ones that hold more cash and liquid assets so that they can continue to invest in the future when external financing is costly.
The need of firms to invest makes them to hold cash, and this is even more necessary when they are facing financial constraints. Holding cash becomes a need for small firms because with the crisis resorting to external finance is almost unbearable for them.
B.1.2.
Investment-Cash Flow Sensitivity
In 1988, Fazzari, Hubbard and Petersen present a way to measure financial constraints through investment and the cost of capital. According to them, variations in cash flow affect more the investment of constrained firms than that of less constrained firms. When firms are financially constrained, it is not just the positive NPV (Net Present Value) projects that influence the investment spending, but the internal funds that are available to the firm are also an important factor, i.e., investment can be sensitive to the movements in cash flow.6
4
Keynes, J. M. (1936)
5 Riddick and Whited (2009) 6
A different point of view to that of Fazzari, Hubbard and Petersen (1988) was the study of Kaplan and Zingales (1997). These authors analyze the relation between financing constraints and investment-cash flow sensitivities, and in contrast to what Fazzari et al (1988) argue, Kaplan and Zingales (1997) reach the conclusion that financially constrained firms do not have high sensitivity of investment to cash flow, but firms that have high sensitivity are the less constrained. A firm is more financially constrained when there is an increase in the wedge between its external and internal cost of funds. Unconstrained firms are the ones that have more liquid assets (cash) and rely mostly on internal funds rather than external funds to invest even though they have access to them, which make these firms to have higher cash flow sensitivity of investment.7
In accordance with Kaplan and Zingales (1997), are Alti (2003) and Moyen (2004). Alti (2003) defends that the patterns showed by Fazzari, Hubbard and Petersen (1988) are only consistent if a firm is financially unconstrained. According to Moyen (2004), if we use an unconstrained model (low dividend firms) to see if firms are constrained, we obtain the results of Fazzari et al (1988), and when we use a constrained model we reach the results of Kaplan and Zingales (1997).
Almeida and Campello (2007) develop the idea that, when firms have insufficient access to credit, variables that increase the access of firms to external financing can also increase the investment of those firms. Their main focus was the tangibility of a firm’s assets, stating that more tangible assets support more external financing. They used the Kaplan and Zingales (1997) idea that investment-cash flow sensitivities do not need to decrease with variables that relieve financing constraints. In this study, they verify their proposed hypothesis that asset tangibility increases investment-cash flow sensitivities for financially constrained firms, but this does not seem to happen when analyzing unconstrained firms. Therefore, firms with more tangible assets are less likely to be financially constrained.
7
Kaplan and Zingales (1997) are the main “rivals” of Fazzari, Hubbard and Petersen (1988) theory. These authors defend that sensitivity of investment to cash flow cannot be an indication for the existence of
B.1.3.
Cash-Cash Flow Sensitivity
One of the factors that are taken into account when evaluating firms’ financial constraints is the amount of liquid assets. According to Almeida, Campello and Weisbach (2004) firms have the tendency to save cash when they face financial constraints because the investment expenditure in the future will depend on the firms’ internal funds. They study the connection between financial constraints and firms’ demand for liquidity, and propose a new theory of the impact of financial constraints on firm policies. Their results suggest that financially constrained firms should increase their tendency to retain cash after negative economic shocks, while unconstrained firms should not. When firms have more cash flows, they should have a higher amount of liquid assets. This means that financially constrained firms should present a positive cash flow sensitivity of cash, i.e., constrained firms should have propensity to save cash out of cash inflows, while unconstrained firms should not have that propensity.
Following the idea of Almeida, Campello and Weisbach (2004), Denis and Sibilkov (2009) show that if constrained firms hold cash out of their cash flows they are increasing their value, since it gives them the opportunity to take valuable investments, and by retaining cash, they can lessen the consequences of financial constraints. So, if constrained firms have low cash then they have lower cash-cash flow sensitivity than high cash constrained firms.8
These three measures of financial constraints appear to be the most adequate for the purpose of this study. The option to use these them is due to the fact that what is done in this dissertation is very similar to the analysis of Erel, Jang and Weisbach (2015). These authors analyze the effects of acquisitions of private target firms on their financial constraints and evaluate if the financial management decisions of target firms change when the firm is acquired being consistent with the idea of a less financially constrained firm. They reach the conclusion that after an acquisition the targets’ cash holdings decrease and the sensitivities of cash and investment to cash flow also
8
decrease. Thus, before the acquisition target firms are financially constrained, but after the acquisition those constraints are reduced.
In this dissertation, instead of testing the effects of acquisitions on private target firms’ financial constraints, are tested the effects of the financial crisis and the Portuguese sovereign credit rating downgrade on private firms and, particularly, SMEs’ financial constraints. Since, Erel, Jang and Weisbach (2015) also analyze private firms, their work uses the appropriate methodology to follow in this study.
B.2.
Sovereign Credit Rating
A sovereign rating is a way of evaluating the state of a country and the conditions that it has to fulfill its commitments towards its lenders. To do a qualitative and quantitative assessment, rating agencies consider several social, political and economic factors. There are eight significant variables that S&P and Moody’s consider in their rating evaluation: income per capita, GDP growth, inflation, fiscal balance, external balance, external debt, economic development and default history.9
Although sometimes these ratings can worsen the situation of a country by giving the information to investors when a country is not capable of complying with its duties, usually governments want to have credit ratings so that they can have easier access to international capital markets. But has it happens to a country to have an upgrade in their credit rating, it can also happen to have a downgrade, which can lead investors to notice a higher country risk and to raise the risk premium charged to the borrowers, making domestic firms’ credit more costly (Arteta and Hale, 2008). This meets the results of Borensztein, Cowan and Valenzuela (2013) that sovereign credit rating changes have impact on corporate ratings. This impact can be positive or negative if there is, respectively, an upgrade or a downgrade of the sovereign credit rating. Changes in the sovereign rating have more impact on firms if there is a
downgrade instead of an upgrade10. One of the impacts that downgrades have is for example the spillover effect across countries that can lead to financial instability. A sovereign rating downgrade in a country can affect banks of another country that holds debt of that country. This happened in the 2007-2009 financial crisis where several countries experienced one after another the sovereign credit rating downgrade. There is evidence that rating downgrades of Greece had spillover effects in Portugal and Spain. These results are shown in Missio and Watzka (2011), who conclude that some of the financial problems that Greece was facing spread out to other European countries. According to Arezki, Candelon and Sy (2011), these spillover effects depend on the type of rating announcements, on the source of country experiencing the downgrade and on the rating agency where were originated the announcements.
Sovereign credit rating downgrades have several effects not only on the population of the downgraded country that sometimes go through difficulties because of the policies imposed by the government but also on companies that see their corporate rating downgrade as well because of the sovereign ceiling rule (i.e., no company can have a credit rating higher than the sovereign credit rating) and the market conditions associated to the sovereign downgrade11. So, what are the effects that sovereign credit rating downgrades have on the firms of those countries? Almeida, Cunha, Ferreira and Restrepo (2014) try to answer this question and find some important effects of sovereign credit rating downgrades on companies. For instance, credit rating downgrades can affect the access of the firm to the bond and commercial paper markets because the rating level is a way for institutional investors to see if they can invest in the firm’s securities. The fact that companies have difficulties in the access to financing makes them to save an amount of cash available to finance future investments, which is what happens when companies are financially constrained. Another effect is that when institutional investors invest in a firm, the capital requirements that they are liable to can be affected by the sovereign credit rating downgrade. The credit downgrade gives information about a firm’s credit quality to the market, which as a consequence can change a firm’s cost of
10 Borensztein, Cowan and Valenzuela (2013), p.4019 11
capital. This meets the idea of Fazzari, Hubbard and Petersen (1988) that difficulties in the access to external financing makes firms struggle to react to the changes in the cost of capital. With the firms being constrained in their capacity to increase their external financing, they have to resort to internal financing so that they can invest and, therefore, this makes their investment-cash flow sensitivity increase. The downgrade can even affect the relationship and business operations between employees and customers since it can be difficult to enter or to maintain a business contract if the company is going through a credit rating downgrade. This can have consequences as making companies reduce their debt issuances, leverage and also investment. 12
C. Data Description
The main purpose of this dissertation is to analyze the impact of economic and financial crisis on the financial constraints of Portuguese small and medium enterprises. Thus, to study this issue on privately held firms it is necessary to use a database that contains financial information of those firms. Every year, all European companies, public and private, have to make public all their financial information for everyone to have access to it, and one of the sources that place that information at our disposal is the Amadeus database. It focus mainly on private firms and contains the financial information of about 21 million European companies. Because of this large amount of companies that Amadeus provides us, I decided to use this database to collect all the data of Portuguese companies.
The private firms in analysis in this dissertation are all Portuguese. One might think that Portugal is a small market to analyze comparatively to some bigger countries that could give more accurate results because of the higher amount of observations that could be collected, but Portugal was one of the most affected countries by the global financial crisis, and so it is important to know more about how companies were affected by the crisis.
The data collected has some basic features that the companies in analysis should present. There are four characteristics that all companies should have, they should be all Portuguese, have a minimum of 10 employees, and should not be listed companies and not be subsidiaries. In what concerns subsidiaries, in Amadeus we can select two types of companies according to their ultimate owner. We can choose firms with a Global Ultimate Owner (GUO) or a Domestic Ultimate Owner (DUO). A GUO is defined as the highest parent company within a corporate family, i.e., the ultimate owner that owns more than 25% of the company. A DUO is a subsidiary within a corporate family that is the highest subsidiary located in a specific country. In this study are used only firms that fit into the definition of a GUO because the goal is to analyze only parent
companies and not their subsidiaries. This screening procedure leads to a final sample of 947 Portuguese firms.
The sample period covered in this dissertation is from 2004 to 2013. A period of ten years is used because the financial crisis hit in 2008 and with this range of years before and after 2008, will allow to have a sufficient amount of information and to obtain more accurate results.
This dissertation analyzes the financial constraints of private firms and, particularly, SMEs after the financial crisis and the Portuguese sovereign credit rating downgrade in 2011. To define properly the concept of small and medium enterprises, it was taken into account the definition presented in the article nº 2 of the Commission Recommendation 2003/361/EC of May 6, 2003. According to this, the definition of SMEs takes into account the number of employees and their turnover or annual balance sheet. It is stated in article nº 2 that small enterprises are composed by less than 50 employees and the annual turnover does not exceed the value of €10 million, and medium enterprises have less than 250 employees and a turnover lower than €50 million. When these characteristics are considered, the sample of firms is reduced to 903 SMEs.
Hence, this data sample of private firms and SMEs is used in this dissertation to analyze the impact of the financial crisis and the 2011 Portuguese sovereign credit rating downgrade on its financial constraints.
D. Methodology
Firms sometimes face financial constraints, i.e., they suffer financial frictions that make them deviate from good investment opportunities. There are several models to measure financial constraints. Followed by some critics as Kaplan and Zingales (1997), Alti (2003) or Moyen (2004), Fazzari, Hubbard and Petersen (1988) introduce one of the first measures concerning firms’ financial constraints. They estimate the sensitivity of a firm’s investment to its cash flow, i.e., variations in cash flow affect more the investment of constrained firms than that of less constrained firms, and so financial constraints have an important role on firms’ investment capacity.
Another method to measure financial constraints is to estimate a firm’s propensity to save cash from incremental cash flows.13 Almeida, Campello and Weisbach (2004) suggest that if a firm is financially constrained it will have the tendency to save cash out of cash flows, while unconstrained firms do not have a relation between cash flows and their propensity to save cash. When the firm is financially constrained, the firm will prefer to allocate additional cash flows to increase their investments now and in the future. Therefore, the influence of constraints on today’s investment is determined by the cash flow sensitivity of investment, while the cash flow sensitivity of cash reflects the management’s assessment of future constraints.
In this dissertation, the model to measure financial constraints that is followed is the one of Erel, Jang and Weisbach (2015). This because they study privately held firms and they did not follow measures of financial constraints that are used only for public firms. So, since in this dissertation I analyze small and medium size Portuguese enterprises the model should be adequate to this type of companies. Therefore, this study uses the same measures of Erel, Jang and Weisbach (2015), which are the level of cash holdings, the investment-cash flow sensitivity, and the cash-cash flow sensitivity.
To analyze the impact of the Portuguese crisis on the financial constraints
13
of SMEs, three hypotheses are tested. One hypothesis is if the demand for cash holding increases when financial constraints increase, which according to the literature if the firm is financially constrained the cash holdings of the firm should increase. Another hypothesis is whether constrained firms save cash from incremental cash flows to finance future investments. The theory suggests that in financially constrained firms the change in the cash flow sensitivity of cash should reflect changes in financial constraints, i.e., firms that are constrained should have an amount of incremental cash flows as cash so that future investments can be financed (Almeida, Campello and Weisbach, 2004). The last hypothesis is if there is a link between the investment and the cash flow of a financially constrained firm. According to the theory, when there are financial constraints, the firms’ cash flow sensitivity of investment should increase.
The procedure to estimate the three measures of financial constraints is in accordance with the methodology used by Erel, Jang and Weisbach (2015), but while they study the impact of acquisitions on target firms’ financial constraints, here I analyze the financial constraints of SMEs before and after the 2008 financial crisis and the 2011 sovereign credit rating downgrade. First, it is considered the level of cash holdings, i.e., if the demand for holding cash increases when financial constraints increase after the crisis or the downgrade, we should observe that firms’ cash holdings rise after the crisis or the downgrade. To test this, the quantity of cash is estimated as follows:
���� = � + �� ����� + �� �������� + �
In the equation, AFTER is a binary variable that has the value of zero before the crisis (or downgrade) and the value of one after the crisis (or downgrade). One of the years that is considered to this analysis is 2008 when the crisis began, and another important year is 2011 because of the sovereign credit rating downgrade that made Portugal fall to one of its lowest rating levels (Speculative grade) since the beginning of the crisis. It also includes six firm level controls (total assets, cash flow normalized by total assets, ROA, number of employees, sales growth and leverage) and three country level controls (private credit to GDP, market capitalization to GDP and GDP growth).
Second, I will analyze the cash flow sensitivity of cash. To estimate this, Erel, Jang and Weisbach (2015) follow the methodology of Almeida, Campello and Weisbach (2004), which suggests that constrained firms retain an amount in cash of incremental cash flows to finance future investments. Along with other literature, they state that the sensitivity of cash holdings to incremental cash flows is correlated with other measures of financial constraints. Therefore, the change in the cash flow sensitivity of cash when the acquisition occurs should reflect changes in financial constraints at that time.14 This is what should also occur after the financial crisis and the sovereign credit rating downgrade. To measure the change in the cash flow sensitivity of cash, I will follow the idea of Erel, Jang and Weisbach (2015) by considering the coefficient on cash flow divided by assets as the cash flow sensitivity of assets before the crisis, and the sum of this coefficient and the coefficient on cash flow interacted with the AFTER dummy variable as the sensitivity after the Portuguese crisis or the downgrade.
Therefore, the equation to analyze the cash flow sensitivity of cash is the following:
∆ ���� �������� = � + �� ����� + �� ����� � ���� ���� + �� �������� + �
Finally, the cash flow sensitivity of investment is considered. The idea underlying this is that if a firm is financially constrained, an increase in cash flow will allow the firm to accept more projects. In this way, if the firm is financially constrained, it should be noticed a link between a firm’s investment and its cash flow.15 In order to measure the cash flow sensitivity of investment, Erel, Jang and Weisbach (2015) used the same measure as for the cash flow sensitivity of cash with investment as the dependent variable, which is the gross investment16 divided by the total assets, and in this dissertation is also used this method as demonstrated in the following equation:
14
Erel, Jang and Weisbach (2015) 15
Ibid.
16 Following the theory of Erel, Jang and Weisbach (2015): Gross Investment = (Fixed Assets – Lagged Fixed Assets + Depreciation)/Total Assets
����� ���������� = � + �� ����� + �� ����� � ���� ���� + �� �������� + �
In both regressions of cash flow sensitivity of cash and cash flow sensitivity of investment, the country and firm level controls are the same as in the cash holdings regression but with the difference that, because of the high correlation between the variables Cash Flow and ROA, the firm level control ROA is replaced by the AFTER dummy interacted with cash flow, which represents the cash flow sensitivity of cash and the cash flow sensitivity of investment after 2008 or after the sovereign credit rating downgrade.
These regressions are applied in two different situations. First, are used to test the effect that the financial crisis had on the financial constraints of private firms and in particular SMEs, and to do this is considered the period of 2004 to 2013. Second, are applied to test the impact of the Portuguese sovereign credit rating downgrade in 2011 on the financial constraints of private firms and also only on SMEs’ financial constraints. In this case the period in analysis is from 2009 to 2013 so that I can analyze two years before and two years after the sovereign credit rating downgrade.
E. Results
In this section are displayed the results obtained in this study about the impact of the crisis and the sovereign credit rating downgrade on the financial constraints of Portuguese enterprises. First, the summary statistics before and after the crisis and the downgrade are presented, and finally are showed the results of the impact of the crisis and the 2011 Portuguese sovereign credit rating downgrade on the financial constraints of private firms and, particularly, of small and medium enterprises.
E.1.
Summary Statistics
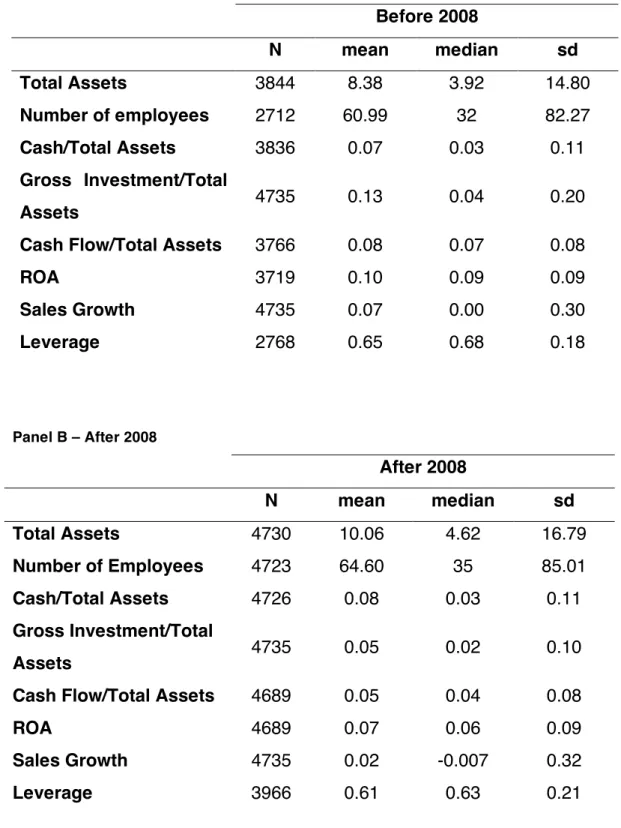
This subsection presents the data summary statics before and after 2008 financial crisis and 2011 sovereign credit rating downgrade (Table 2). Observe that after 2008 the number of observations increased probably because some values are missing mainly in the years of 2004 and 2005 of some companies. But, after the sovereign credit rating downgrade in 2011, the number of observations decreased significantly. A possible reason for this could be the entrance of European institutions and the IMF and the severe measures that came with it, which led some companies to cease their activities, as we have seen in Table 1 of section A.
The mean of Total Assets, Number of Employees and Cash increases after 2008 and after 2011 the same occurs with the exception of the Cash that decreases. The Gross Investment, Cash Flow, ROA and Leverage mean decreases after 2008 and 2011. Firms invested more of their assets before 2008 (13%) than before 2011 (11%) having these numbers decreased 8pp after each event. Similarly, the median of Total Assets and Number of Employees increases and all the other medians decrease after the two events, with the exception of Cash that does not vary. The same as the median occurs to the standard deviation of Total Assets and Number of Employees, which is defined as the degree to which the values in the sample differ from the mean, but the variable Cash, Cash flow and ROA do not change, while Leverage increases after the two events and Sales Growth decrease after 2011.
Table 2 – Firm level variables summary statistics
Summary statistics on the firm level variables before and after the 2008 financial crisis and the 2011 sovereign credit rating downgrade. Data collected from Amadeus database and the variables of Total assets, Cash/Total Assets, Gross Investment/Total Assets, Cash Flow/ Total Assets, ROA, Sales Growth and Leverage are in million EUR.
Panel A – Before 2008 Before 2008 N mean median sd Total Assets 3844 8.38 3.92 14.80 Number of employees 2712 60.99 32 82.27 Cash/Total Assets 3836 0.07 0.03 0.11 Gross Investment/Total Assets 4735 0.13 0.04 0.20
Cash Flow/Total Assets 3766 0.08 0.07 0.08
ROA 3719 0.10 0.09 0.09 Sales Growth 4735 0.07 0.00 0.30 Leverage 2768 0.65 0.68 0.18 Panel B – After 2008 After 2008 N mean median sd Total Assets 4730 10.06 4.62 16.79 Number of Employees 4723 64.60 35 85.01 Cash/Total Assets 4726 0.08 0.03 0.11 Gross Investment/Total Assets 4735 0.05 0.02 0.10
Cash Flow/Total Assets 4689 0.05 0.04 0.08
ROA 4689 0.07 0.06 0.09
Sales Growth 4735 0.02 -0.007 0.32
Panel C – Before 2011 Before 2011 N mean median sd Total Assets 6680 9.04 4.19 15.68 Number of employees 5541 63.07 34 83.76 Cash/Total Assets 6670 0.08 0.03 0.11 Gross Investment/Total Assets 7576 0.11 0.04 0.18
Cash Flow/Total Assets 6578 0.07 0.06 0.08
ROA 6531 0.09 0.08 0.09 Sales Growth 7576 0.07 0.00 0.31 Leverage 5097 0.64 0.66 0.19 Panel D – After 2011 After 2011 N mean median sd Total Assets 1894 10.26 4.62 16.85 Number of employees 1894 63.90 34 84.84 Cash/Total Assets 1892 0.07 0.03 0.11 Gross Investment/Total Assets 1894 0.03 0.01 0.09
Cash Flow/Total Assets 1877 0.04 0.03 0.08
ROA 1877 0.06 0.06 0.09
Sales Growth 1894 -0.009 -0.027 0.29
E.2.
Analysis of the Results
This subsection shows the analysis of the results. The following tables display the outcomes obtained with the estimation of the regressions described in the previous section D.
The results presented are for the period before and after the beginning of the global financial crisis in 2008 and for the period before and after the sovereign credit rating downgrade that led Portugal from Investment Grade to Speculative Grade in 2011. Besides these two periods of analysis, I also analyze separately for all the Portuguese private firms and for small and medium enterprises.
E.2.1.
Financial Crisis
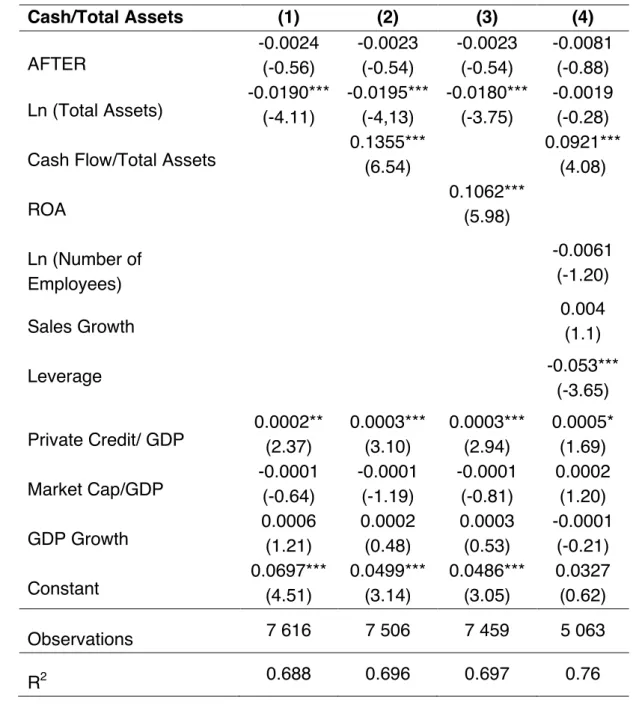
In table 3 are presented the results for the impact of the crisis on cash holdings of private firms. We can see the effect on cash holdings by looking at the AFTER dummy variable, which represents the cash holdings after the 2008 crisis. This coefficient is negative between -0.0081 and -0.0023. The meaning of this is that after the financial crisis private firms reduced their level of cash holdings between 0.23pp and 0.81pp, but this drop in cash holdings is not statistically significant.
These results are not the expected for firms facing financial constraints, since when the firms face constraints their cash holdings should increase instead of decreasing. Therefore, this is a suggestion that firms were not financially constrained after the financial crisis.
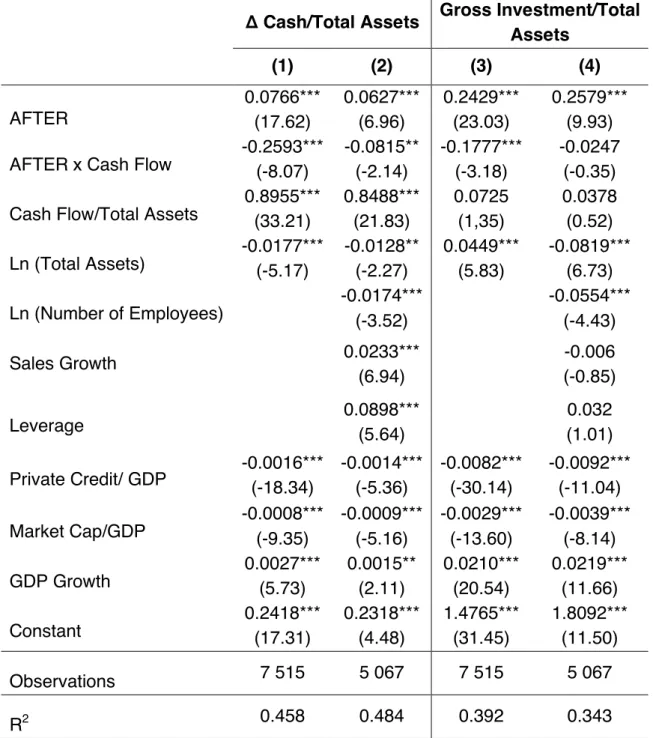
After analyzing the impact on cash holdings, the analysis of the cash flow sensitivity of cash and cash flow sensitivity of investment are displayed. Table 4 shows the results of these two factors. The cash-cash flow sensitivity is represented in the columns (1) and (2), and the investment-cash flow sensitivity is represented in the columns (3) and (4).
As mentioned in the previous section D, the coefficient on cash flow divided by assets represents the cash flow sensitivity of assets before the crisis, and the coefficient on cash flow interacted with the AFTER dummy variable represents the sensitivity of cash17 after the Portuguese crisis.
Therefore, the coefficient on cash flow normalized by assets (sensitivity before the crisis) is positive and statistically significant leading to the conclusion that before the crisis firms’ cash flow sensitivity of cash increased, i.e., firms were financially constrained. However, the AFTER coefficient interacted with the cash flow coefficient (sensitivity after the crisis) had a statistically significant decline between 8.15pp and 25.93pp, so firms were not financially constrained after the crisis. In financially constrained firms the change in the cash flow sensitivity of cash should reflect changes in financial constraints, i.e., firms that are constrained should have an amount of incremental cash flows as cash so that future investments can be financed18, and in this case this does not happen because firms do not save an amount of incremental cash flows as cash.
If we look at columns (3) and (4) of table 4, where are presented the results for the cash flow sensitivity of investment, we can see that the results are the same as in columns (1) and (2), but when all firm level variables are considered in the regression the results are not statistically significant. So, firms’ cash flow sensitivity of investment declines, which is an indication that the companies were not financially constrained after the crisis.
The results of table 4 are in accordance with the ones of table 3, since both results suggest that the firms are not financially constrained after the crisis.
17 Erel, Jang and Weisbach (2015) 18
Table 3 – The impact of the financial crisis on cash holdings of private firms
Table of results for the impact of the crisis on Portuguese private firms cash holdings normalized by total assets, being the AFTER dummy variable equal to zero before 2008 and equal to one after 2008. All the data was collected from Amadeus database and is in million EUR. The statistical significance is represented by the symbols ***, **, * for 1%, 5% and 10% of significance, respectively. Cash/Total Assets (1) (2) (3) (4) AFTER -0.0024 (-0.56) -0.0023 (-0.54) -0.0023 (-0.54) -0.0081 (-0.88) Ln (Total Assets) -0.0190*** (-4.11) -0.0195*** (-4,13) -0.0180*** (-3.75) -0.0019 (-0.28) Cash Flow/Total Assets
0.1355*** (6.54) 0.0921*** (4.08) ROA 0.1062*** (5.98) Ln (Number of Employees) -0.0061 (-1.20) Sales Growth 0.004 (1.1) Leverage -0.053*** (-3.65) Private Credit/ GDP 0.0002** (2.37) 0.0003*** (3.10) 0.0003*** (2.94) 0.0005* (1.69) Market Cap/GDP -0.0001 (-0.64) -0.0001 (-1.19) -0.0001 (-0.81) 0.0002 (1.20) GDP Growth 0.0006 (1.21) 0.0002 (0.48) 0.0003 (0.53) -0.0001 (-0.21) Constant 0.0697*** (4.51) 0.0499*** (3.14) 0.0486*** (3.05) 0.0327 (0.62) Observations 7 616 7 506 7 459 5 063 R2 0.688 0.696 0.697 0.76
Table 4 - The impact of the financial crisis on the cash flow sensitivity of cash and cash flow sensitivity of investment of private firms
Table of results for the impact of the crisis on Portuguese private firms cash-cash flow sensitivity (Δ Cash/Total Assets) and investment-cash flow sensitivity (Gross Investment/Total Assets) normalized by total assets, being the AFTER dummy variable equal to zero before 2008 and equal to one after 2008. All the data was collected from Amadeus database and is in million EUR. The statistical significance is represented by the symbols ***, **, * for 1%, 5% and 10% of significance, respectively.
Δ Cash/Total Assets Gross Investment/Total Assets (1) (2) (3) (4) AFTER 0.0766*** (17.62) 0.0627*** (6.96) 0.2429*** (23.03) 0.2579*** (9.93) AFTER x Cash Flow
-0.2593*** (-8.07) -0.0815** (-2.14) -0.1777*** (-3.18) -0.0247 (-0.35) Cash Flow/Total Assets
0.8955*** (33.21) 0.8488*** (21.83) 0.0725 (1,35) 0.0378 (0.52) Ln (Total Assets) -0.0177*** (-5.17) -0.0128** (-2.27) 0.0449*** (5.83) -0.0819*** (6.73) Ln (Number of Employees) -0.0174*** (-3.52) -0.0554*** (-4.43) Sales Growth 0.0233*** (6.94) -0.006 (-0.85) Leverage 0.0898*** (5.64) (1.01) 0.032 Private Credit/ GDP -0.0016*** (-18.34) -0.0014*** (-5.36) -0.0082*** (-30.14) -0.0092*** (-11.04) Market Cap/GDP -0.0008*** (-9.35) -0.0009*** (-5.16) -0.0029*** (-13.60) -0.0039*** (-8.14) GDP Growth 0.0027*** (5.73) 0.0015** (2.11) 0.0210*** (20.54) 0.0219*** (11.66) Constant 0.2418*** (17.31) 0.2318*** (4.48) 1.4765*** (31.45) 1.8092*** (11.50) Observations 7 515 5 067 7 515 5 067 R2 0.458 0.484 0.392 0.343
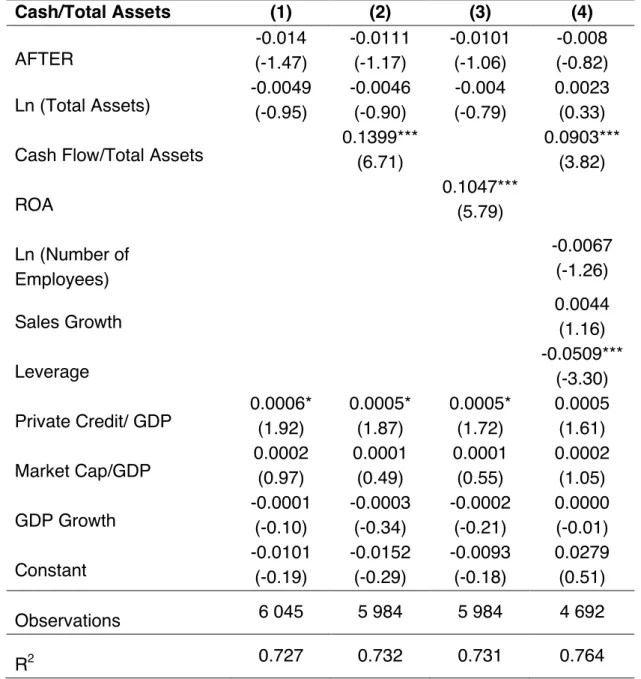
What about small and medium enterprises? Where they affected differently from private firms in general? If we look only to the amount of companies considered as being SMEs, there are about 40 companies that are excluded. In order to see how their financial constraints were affected by the financial crisis, the same analysis is performed on SMEs. Similarly to what was done to private firms in general, table 5 presents the results of the impact of the crisis on the cash holdings of SMEs.
As before, we should look at the AFTER coefficient, which tell us how companies dealt with cash after the crisis. So, if we look at the AFTER coefficient we can see that it ranges between -0.014 and -0.008, meaning that after the crisis firms had a drop on their cash holdings between 0.08pp and 1.4pp. With these results, we can say that small and medium enterprises did not save cash after the financial crisis contrary to what is expected if firms are facing financial constraints.
After testing the cash holdings of SMEs, is presented the outcome of SMEs’ cash flow sensitivity of cash and cash flow sensitivity of investment (Table 6). As we can observe, the coefficient that indicates the cash-cash flow sensitivity after the crisis (AFTER dummy interacted with cash flow) have a statistically significant drop between 7.57pp and 16.47pp and the cash flow sensitivity of investment after the crisis also decreased between 1.24pp and 6.53pp, but not statistically significant. This indicates that SMEs were not financially constrained after the crisis because, if they were, the results should show an increase in the cash flow sensitivity of cash and an increase in the cash flow sensitivity of investment.
According to Erel, Jang and Weisbach (2015), if companies are financially constrained their cash holdings, cash flow sensitivity of investment and cash flow sensitivity of cash should increase, but this is not obtained when looking to private firms and, particularly, small and medium enterprises after 2008.
Table 5 – The impact of the financial crisis on cash holdings of small and medium enterprises
Table of results for the impact of the crisis on Portuguese small and medium enterprises cash holdings normalized by total assets, being the AFTER dummy variable equal to zero before 2008 and equal to one after 2008. All the data was collected from Amadeus database and is in million EUR. The statistical significance is represented by the symbols ***, **, * for 1%, 5% and 10% of significance, respectively. Cash/Total Assets (1) (2) (3) (4) AFTER -0.014 (-1.47) -0.0111 (-1.17) -0.0101 (-1.06) -0.008 (-0.82) Ln (Total Assets) -0.0049 (-0.95) -0.0046 (-0.90) -0.004 (-0.79) 0.0023 (0.33) Cash Flow/Total Assets
0.1399*** (6.71) 0.0903*** (3.82) ROA 0.1047*** (5.79) Ln (Number of Employees) -0.0067 (-1.26) Sales Growth 0.0044 (1.16) Leverage -0.0509*** (-3.30) Private Credit/ GDP 0.0006* (1.92) 0.0005* (1.87) 0.0005* (1.72) 0.0005 (1.61) Market Cap/GDP 0.0002 (0.97) 0.0001 (0.49) 0.0001 (0.55) 0.0002 (1.05) GDP Growth -0.0001 (-0.10) -0.0003 (-0.34) -0.0002 (-0.21) 0.0000 (-0.01) Constant -0.0101 (-0.19) -0.0152 (-0.29) -0.0093 (-0.18) 0.0279 (0.51) Observations 6 045 5 984 5 984 4 692 R2 0.727 0.732 0.731 0.764
Table 6 -The impact of the financial crisis on the cash flow sensitivity of cash and cash flow sensitivity of investment of small and medium enterprises
Table of results for the impact of the crisis on Portuguese small and medium enterprises cash-cash flow sensitivity (Δ Cash/Total Assets) and investment-cash-cash flow sensitivity (Gross Investment/Total Assets) normalized by total assets, being the AFTER dummy variable equal to zero before 2008 and equal to one after 2008. All the data was collected from Amadeus database and is in million EUR. The statistical significance is represented by the symbols ***, **, * for 1%, 5% and 10% of significance, respectively.
Δ Cash/Total Assets Gross Investment/Total Assets (1) (2) (3) (4) AFTER 0.0891*** (9.98) 0.0647*** (6.77) 0.2817*** (11.89) 0.2632*** (9.72) AFTER x Cash Flow
-0.1647*** (-4.51) -0.0757* (-1.86) -0.0653 (-1.08) -0.0124 (0.17) Cash Flow/Total Assets
0.8621*** (25.92) 0.8491*** (20.63) 0.0163 (0.27) 0.0165 (0.22) Ln (Total Assets) -0.0162*** (-3.46) -0.0112* (-1.85) 0.0427*** (4.68) 0.0829*** (6.94) Ln (Number of Employees) -0.0207*** (-3.88) -0.0558*** (-4.45) Sales Growth 0.0239*** (6.77) -0,0027 (-0.37) Leverage 0.0948*** (5.60) 0.0492 (1.56) Private Credit/ GDP -0.0023*** (-8.90) -0.0015*** (-5.37) -0.0101*** (-13.45) -0.0095*** (-10.96) Market Cap/GDP -0.0013*** (-7.30) -0.0010*** (-5.20) -0.0045*** (-10.06) -0.0041*** (-8.24) GDP Growth 0.0035*** (5.07) 0.0016** (2.24) 0.0223*** (13.17) 0.0218*** (11.26) Constant 0.3831** (8.08) 0.2504*** (4.59) 1.8677*** (13.60) 1.8617*** (11.48) Observations 5 990 4 696 5 990 4 696 R2 0.438 0.486 0.339 0.36
E.2.2.
Portuguese Sovereign Credit Rating
In 2011, the Portuguese sovereign credit rating suffered a downgrade and Portugal saw its rating go from Investment Grade to Speculative Grade (or as it is commonly called “junk” bond). This was the year that Portugal had to be rescued by the International Monetary Fund, European Central Bank and European Commission. These three institutions had the purpose to economically restructure Portugal so that it could honor its commitments. But this has caused many difficulties to companies and a lot of them were not able to survive to all the austerity that the European institutions and the IMF imposed to Portugal.
The following tables show how was the impact of the 2011 Portuguese sovereign credit rating downgrade on the financial constraints of private firms in general and, in particular, of small and medium enterprises. First are displayed the results of the impact on financial constraints of private firms. In table 7 we can see that the cash holdings decreased between 0.41pp and 0.76pp after the downgrade occurred, being an indication that private firms were not financially constrained after the downgrade. Columns (1), (3) and (4) present statistically significant results of the AFTER coefficient, while column (2) result is not statistically significant.
Subsequently, table 8 shows that the cash flow sensitivity of cash declined between 4.63pp and 17.25pp. Although the cash flow sensitivity of investment also faces a drop, the values are not statistically significant.
These results on private firms indicate that after the Portuguese sovereign credit rating downgrade they were not financially constrained since their cash holdings, cash-cash flow sensitivity and investment-cash flow sensitivity decreased instead of increasing as it was expected if the firms were constrained.
Table 7 - The impact of the Portuguese sovereign credit rating downgrade on cash holdings of private firms
Table of results for the impact of the crisis on Portuguese private firms cash holdings normalized by total assets, being the AFTER dummy variable equal to zero before 2011 and equal to one after 2011. All the data was collected from Amadeus database and is in million EUR. The statistical significance is represented by the symbols ***, **, * for 1%, 5% and 10% of significance, respectively. Cash/Total Assets (1) (2) (3) (4) AFTER -0.0076*** (-2.69) -0.0041 (-1.44) -0.0053* (-1.86) -0.0063** (-2.39) Ln (Total Assets) -0.0187*** (-4.05) -0.0193*** (-4.09) -0.0177*** (-3.70) -0.0009 (-0.14) Cash Flow/Total Assets
0.1331*** (6.37) 0.0854*** (3.72) ROA 0.1042*** (5.84) Ln (Number of Employees) -0.0065 (-1.28) Sales Growth 0.0042 (1.15) Leverage -0.0564*** (-3.81) Private Credit/ GDP 0.0002*** (3.82) 0.0003*** (5.21) 0.0002*** (4.95) 0.0002*** (3.26) Market Cap/GDP -0.0001 (-0.66) -0.0001 (-1.26) -0.0001 (-0.87) 0.0001 (0.97) GDP Growth 0.0000 (0.07) 0.0000 (-0.00) -0.0001 (-0.19) -0.0003 (-0.53) Constant 0.0766*** (8.23) 0.0570*** (5.75) 0.0557*** (5.58) 0.0798*** (3) Observations 7 616 7 506 7 459 5 063 R2 0.688 0.696 0.697 0.76
Table 8 - The impact of the Portuguese sovereign credit rating on the cash flow sensitivity of cash and cash flow sensitivity of investment of private firms
Table of results for the impact of the Portuguese sovereign credit rating downgrade on private firms cash-cash flow sensitivity (Δ Cash/Total Assets) and investment-cash flow sensitivity (Gross Investment/Total Assets) normalized by total assets, being the AFTER dummy variable equal to zero before 2011 and equal to one after 2011. All the data was collected from Amadeus database and is in million EUR. The statistical significance is represented by the symbols ***, **, * for 1%, 5% and 10% of significance, respectively.
Δ Cash/Total Assets Gross Investment/Total Assets (1) (2) (3) (4) AFTER 0.0268*** (8.23) 0.0240*** (7.05) -0.0071 (-1.19) -0.0250*** (-4.02) AFTER x Cash Flow
-0.1725*** (-3.66) -0.0463 (-0.96) -0.048 (-0.63) -0.0009 (-0.01) Cash Flow/Total Assets
0.7976*** (35.42) 0.8308*** (25.68) -0,0201 (-0.46) 0.0168 (-0.29) Ln (Total Assets) -0.0254*** (-7.20) -0.0180*** (-3.26) 0.0296*** (3.77) 0.0785*** (6.26) Ln (Number of Employees) -0.0166*** (-3.37) -0.0574*** (-4.44) Sales Growth 0.0226*** (6.73) -0.0096 (-1.39) Leverage 0.1033*** (6.59) 0.0126 (0.38) Private Credit/ GDP -0.0004*** (-9.18) 0.0003*** (3,68) -0.0038*** (-27.36) -0.0018*** (-10.35) Market Cap/GDP -0.0006*** (-6.97) 0.0000 (-0.11) -0.0019*** (-9.19) 0.0005** (2.29) GDP Growth 0.0009* (1.88) 0.0000 (-0.05) 0.0061*** (6.22) 0.0031*** (2.98) Constant -0.0810** (8.73) -0.0799*** (-3.11) 0.8165*** (29.43) 0.4825*** (8.11) Observations 7 515 5 067 7 515 5 067 R2 0.431 0.486 0.337 0.318
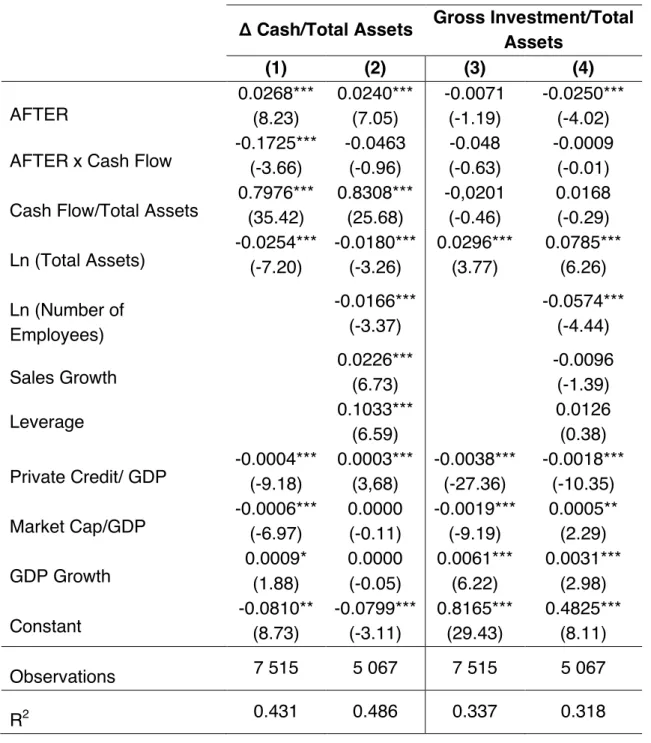
As previously referred, 40 companies are excluded when considering only small and medium enterprises. Although this may not change significantly the results, it is important to see if there are changes when we only look at SMEs. Therefore, in tables 9 and 10 are displayed the results of the sovereign credit rating downgrade impact on financial constraints of small and medium enterprises.
In this case, the after downgrade coefficient is also negative and statistically significant. Table 9 shows that there is a drop in cash holdings between 0.55pp and 0.94pp, which means that SMEs were not financially constrained after the downgrade.
Another evidence of this is the variation on cash holdings that show the cash flow sensitivity of cash. The coefficient indicating the sensitivity after the downgrade is the one that AFTER interacts with cash flow, and it is a statistically significant negative coefficient meaning that the sensitivity decreased between 5.97pp and 14.87pp, indicating that firms were not financially constrained. However, when looking to the cash flow sensitivity of investment the coefficient is positive, but these results are not statistically different from zero (see Table 10).
These results obtained are not what were expected for the hypotheses defined previously. Since cash holdings, cash flow sensitivity of cash and cash flow sensitivity of investment decrease in all scenarios analyzed, this means that after the financial crisis and after the sovereign credit rating downgrade in 2011, firms were not financially constrained.
Table 9 - The impact of the Portuguese sovereign credit rating downgrade on cash holdings of small and medium enterprises
Table of results for the impact of the Portuguese sovereign credit rating downgrade on small and medium enterprises cash holdings normalized by total assets, being the AFTER dummy variable equal to zero before 2011 and equal to one after 2011. All the data was collected from Amadeus database and is in million EUR. The statistical significance is represented by the symbols ***, **, * for 1%, 5% and 10% of significance, respectively.
Cash/Total Assets (1) (2) (3) (4) AFTER -0.0094*** (-3.29) -0.0055* (-1.93) -0.0068** (-2.38) -0.0067** (-2.40) Ln (Total Assets) -0.0042 (-0.82) -0.0041 (-0.81) -0.0035 (-0.69) 0.0032 (0.47) Cash Flow/Total Assets
0.1363*** (6.48) 0.0831*** (3.46) ROA 0.1018*** (5.6) Ln (Number of Employees) -0.0072 (-1.35) Sales Growth 0.0046 (1.22) Leverage -0.0546*** (3.47) Private Credit/ GDP 0.0002** (2.12) 0.0002*** (3.04) 0.0002*** (2.86) 0.0002*** (3.14) Market Cap/GDP -0.00003 (-0.31) -0.0001 (-0.74) -0.0001 (-0.47) 0.0001 (0.77) GDP Growth -0.0001 (-0.14) -0.0001 (-0.13) -0.0002 (-0.31) -0.0002 (-0.33) Constant 0.0630*** (4.05) 0.0432*** (2.77) 0.0439*** (2.79) 0.0749*** (2.94) Observations 6 045 5 984 5 984 4 692 R2 0.728 0.732 0.731 0.765
Table 10 - The impact of the Portuguese sovereign credit rating downgrade on the cash flow sensitivity of cash and cash flow sensitivity of investment of small and medium enterprises
Table of results for the impact of the Portuguese sovereign credit rating downgrade on small and medium enterprises cash-cash flow sensitivity (Δ Cash/Total Assets) and investment-cash flow sensitivity (Gross Investment/Total Assets) normalized by total assets, being the AFTER dummy variable equal to zero before 2011 and equal to one after 2011. All the data was collected from Amadeus database and is in million EUR. The statistical significance is represented by the symbols ***, **, * for 1%, 5% and 10% of significance, respectively.
Δ Cash/Total Assets Gross Investment/Total Assets (1) (2) (3) (4) AFTER 0.0227*** (6.49) 0.0248*** (6.92) -0.0218 (-3.64) -0.0254*** (-3.89) AFTER x Cash Flow
-0.1487** (-2.95) -0.0597 (-1.17) 0.029 (0.37) 0.00455 (0,53) Cash Flow/Total Assets
0.7999*** (30.36) 0.8363*** (24.54) -0.0472 (-1.01) -0,0234 (-0.40) Ln (Total Assets) -0.0211*** (-4.51) -0.0161*** (-2.72) 0.0353*** (3.79) 0.0788*** (6.38) Ln (Number of Employees) -0.0196*** (-3.70) -0.0577*** (-4.42) Sales Growth 0.0229*** (6.50) -0.0065 (-0.91) Leverage 0.1082*** (6.49) 0.0313 (0.94) Private Credit/ GDP -0.00005 (-0.74) 0.0002*** (3.21) -0.0021*** (-13.60) -0.0019*** (-10.42) Market Cap/GDP -0.00004 (-0.39) -0.0000 (-0.26) 0.0003 (1.61) 0.0004* (1.89) GDP Growth 0.0001 (0.15) 0.0000 (0.08) 0.0024** (2.55) 0.0027** (2.54) Constant -0.0192 (-1.34) -0.0758*** (-2.75) 0.4112*** (13.27) 0.4909*** (8.27) Observations 5 990 4 696 5 990 4 696 R2 0.428 0.488 0.309 0.333
The results obtained reject the three hypotheses proposed initially that the cash holdings, the cash flow sensitivity of cash and the cash flow sensitivity of investment should increase when firms are financially constrained. In order to withdraw all the doubts about survivorship bias that could influence the results, I performed a robustness test to confirm it. To conduct this test I excluded the firms that were not active three years before and three years after the financial crisis and the total number of firms was reduced to 654. However, even with only the companies that survived the outcome was the same, i.e., the firms’ cash holdings, cash-cash flow sensitivity and investment-cash flow sensitivity continued to decline. Therefore, the results were not influenced by a survivorship bias and this confirms that firms were actually not financially constrained after the financial crisis and the sovereign credit rating downgrade.
In a way to understand the cause of this outcome, I tested if companies were even more leveraged after the crisis and the downgrade by including the coefficient AFTER x Leverage (leverage after the crisis and the downgrade), but the results showed that the leverage of firms decreased, meaning that companies were less levered after the two events. One explanation for this could be the fact that after the crisis Portugal tried to provide some measures that could give support to SMEs by creating “PME Crescimento” (“SME Growth”), which still exists today. This program was built to help SMEs to internationalize, innovate and to help them pay debts contracted towards the Government.19 This could be one of the reasons why firms behaved this way, but it is not the only reason.
These results can also mean that companies were in a situation even worse than expected, so they could not use the cash to finance future investments and the cash flows generated were not used to invest, probably because the money was needed to pay debts and other priorities that companies had. Thus, companies were not able to save cash to prevent for future needs and therefore had to direction their money to pay urgent obligations towards lenders, employees, suppliers, etc. that needed to be fulfilled.
19 2014 Small Business Act (SBA) Fact Sheet – Portugal. The SBAs are a way to gather information about how SMEs of each Member State are evolving in a way to see which policies should be applied.