CharaCterization of ripening stages
of myrtle fruit
1DYALLA RIBEIRO DE ARAUJO2, ELISEU MARLÔNIO PEREIRA DE LUCENA3,
JOSIVANDA PALMEIRA GOMES4, ROSSANA MARIA FEITOSA DE FIGUEIRÊDO5,
CLARISSE PONTES DA SILVA6
aBstraCt-The myrtle (Eugenia gracillima Kiaersk.) is a native fruit species in the Chapada of Araripe, state of Pernambuco, Brazil. The fruits are collected from the wild and are consumed fresh or processed as
pulp, juice, jelly, liquor or desserts. Myrtle fruit production is of significant socioeconomic value for the
region and, therefore, the description of myrtle fruit ripening stages may contribute to the development of its production chain. As a result, the objective of the present study was to evaluate the physical, quality and
ripening changes of myrtle fruits at different developmental stages. The fruits were picked at five distinctive
stages and evaluated for longitudinal and transverse diameters; fresh, dry and water mass; water contents; soluble solids (SS); titratable acidity (TA); pH; SS/TA ratio; carbohydrates (starch, total, reducing and nonreducing sugars); ascorbic acid; total pectin, soluble pectins and percentage of pectin solubilization; polymeric, oligomeric and dimeric phenolics; total anthocyanins, carotenoids and chlorophyll; and yellow
flavonoids. Along fruit ripening processes increases in SS, anthocyanins and carotenoids, in the SS/TA ratio
and of percentages of pectin solubilization were determined. On the other hand, decreases in TA and total chlorophyll were observed. The ripening stage at which peel color is completely dark red (ripening stage 4) is most appropriate to harvest myrtle fruits for human consumption.
index terms: Eugenia gracillima Kiaersk, fruit quality, maturity index.
CaraCterizaÇÃo Dos estÁDios De maturaÇÃo
Dos frutos Da murta
resumo-A murta (Eugenia gracillima Kiaersk.) é uma frutífera nativa na Chapada do Araripe, PE e seu aproveitamento tem sido de forma extrativista, sendo que seu fruto pode ser consumido in natura ou processado como polpa, suco, geleia, licor e doce. Sabendo que a produção de frutas desta espécie é de grande valor socioeconômico para a região, a caracterização dos estádios de maturação do fruto da murta poderá contribuir com o desenvolvimento de sua cadeia produtiva. Desta forma, objetivou-se com o presente trabalho avaliar as mudanças físicas, de qualidade e de maturação dos frutos da murta em diferentes estádios de maturação. Os frutos foram selecionados em cinco estádios e avaliados quanto aos diâmetros longitudinal e transversal; massas fresca, seca e de água; teor de água; sólidos solúveis (SS); acidez titulável (AT); pH; relação SS/AT; carboidratos (amido, açúcares solúveis totais, redutores e não-redutores); ácido ascórbico; pectina total, solúvel e percentagem de solubilização de pectina; fenólicos dímeros, oligoméricos
e poliméricos; antocianinas, carotenoides e clorofila totais; e flavonoides amarelos. Durante a maturação dos frutos, foi verificado aumento nos teores de SST, antocianinas e carotenoides totais, na relação SST/ATT e na solubilização de pectinas, e diminuição na ATT e clorofila total. O estádio de maturação com a coloração
de casca 100% vermelho escuro (estádio de maturação 4) é o mais apropriado para a colheita dos frutos da murta destinados ao consumo humano.
termos para indexação: Eugenia gracillima Kiaersk, qualidade dos frutos, índice de maturidade.
1(Trabalho 047-15). Recebido em: 16-01-2015. Aceito para publicaçao em: 22-07-2015. 2Drª., Prof.ª do Instituto Federal do Ceará, IFCE Campus Crato. E-mail: dyalla@ifce.edu.br
3Dr., Prof. Adjunto do Curso de Ciências Biológicas, CCS/UECE, Fortaleza-CE.E-mail: eliseu.lucena@uece.br
4Drª., Prof.ª. Adjunta do Departamento de Engenharia Agrícola, CTRN/UFCG, Campina Grande-PB. E-mail: josivanda@gmail.com 5Drª., Prof.ª. Adjunta do Departamento de Engenharia Agrícola, CTRN/UFCG, Campina Grande-PB, E-mail: rossana@deag.ufcg.edu.br 6Aluna do Curso de Ciências Biológicas UECE, Bolsista de Iniciação Científica FUNCAP, Fortaleza-CE. E-mail: clarichinha@hotmail.com
2
Rev. Bras. Frutic., v. 38, n. 2: (e-712) DOI 10.1590/0100-29452016712 March/April 2016 Jaboticabal - SP D. R. de ARAUJO et al.
introDuCtion
The Brazilian fruit assortment includes many native fruit species that are still quite unknown and
unexplored. Of excellent flavor and potential for
fresh consumption, these species could be sources of vitamins and antioxidants and, as well, raw material for processing.
Myrtle (Eugenia gracillima Kiaersk.) is a Myrtaceae species with a few common names such as murta at the Northeastern region of Brazil or cambuí in the state of Paraná. Myrtle is a native and endemic species widely spread out in the Brazilian territory. The plant is a shrub ranging in height from 1.5 to 5.0 meter. The fruit is a berry, oblong in shape at unripe stages and, when ripe, with a more globular form. Peel color changes from green to red or black during ripening.
Locals value the fruit because of its unique flavor. The fruit is consumed fresh or could be processed to pulp, juices, jams, liqueurs or desserts.
The species is propagated by seeds. Each fruit has up to two seeds with a seed coat (testa) varying from membranaceous to cartaceous. The embryo is eugenoid (Lucena et al., 2015). The species occurs naturally in the Chapada do Araripe, state of Pernambuco, Brazil. The fruits are collected from the wild and are socioeconomically important in that area.
Domestication of the species towards a more structured cultivation is limited mainly due to lacking of technical knowledge to warrant a production system comprising propagation alternatives, cultivars with consistent fruit bearing and proper postharvest handling procedures. Without that information at hand to growers and to all involved with the species,
the progress strived in support of a more technified
production in the Chapada do Araripe will be challenging.
More pressing are specifics on appropriate
handling of myrtle fruit at harvest and after harvest to take in hands the potential of that species collected from the wild to be processed for off-season supply from January to August/July. For that reason, determining the adequate ripening stage to harvest the fruit at is best quality for fresh consumption and prolonged shelf life is critical. Consequently, the present work intended to evaluate physical, quality
and ripening changes of myrtle fruit picked at five
different ripening stages.
material anD methoDs
Myrtle fruit were harvested in an area of innate vegetation at the property of the Lermen family, situated in the Serra dos Paus Dóias – Chapada do Araripe, at the municipality of Exu, Pernambuco, at a latitude of 7º21’S and longitude of 39º53’W. The area lies on an altitude of 884 m and harvest proceeded from September until October 2011. During that period, maximum daily temperatures varied from 25.5°C to 33.0°C and minimum daily temperatures ranged from 14°C to 19ºC. Relative humidity ranged from 33% to 98% and in September 32 mm of rain occurred in the area while in October 89 mm of rain were registered by INPE (2013).
The fruit were harvested at five different
ripening stages based on peel color. One single harvest for every ripening stage was performed. After harvest, the fruit were transported to the Laboratorio
de Ecofisiologia Vegetal of the Universidade Estadual
do Ceará (UECE) and peel color evaluated in detail based on Munsell´s color charts (1994).
The longitudinal and transversal diameters were determined with a caliper and results are expressed in mm. Fresh weight, dry weight and water mass and water contents, all expressed in grams, were determined according to Lucena et al. (2007).
Soluble solids (SS), titratable acidity (TA) and pH of the pulp were determined according to the methodology proposed in Brasil (2005). Acidity results are expressed in percentage (%) of citric acid in fresh tissues. The SS/TA ratio is the result of the straight division of values of each variable.
The starch contents was determined according the methodology described in AOAC (2005). Results were multiplied by 0.9 to obtain the starch percentage in fresh tissues. Reducing sugars were determined by way of the 3,5-dinitrosalicylic acid (DNS) method as described in Miller (1959). The total soluble sugars (TSS) were determined according the methodology described in Yemn and Willis (1954). Results are expressed in percentage of fresh tissues. Reducing sugars (RS) were extracted in distilled water and determined as described in Miller (1959). RS results are expressed in percentage of fresh tissues. Non-reducing sugars (NRS) were obtained by subtraction of the RS values from TTS values as indicated in Lucena et al. (2011).
and McComb (1952). The hydrolysis was completed according to the recommendations of Blumenkrantz and Asboe-Hansen (1973) and the results expressed in mg pectins/100 g fresh tissue. The percentage of pectin solubilization was calculated as the fraction of soluble pectin of total pectins.
The extraction of phenolic compounds was carried out according to the method described in Swain and Hillis (1959) having as extractant methanol at 99.5% (v/v) for dimers, methanol at 50% (v/v) for oligomers and distilled water for the polymeric forms. To determine the phenolic contents the methodology described in Reicher et al. (1981) was applied and the results expressed in mg/100 g fresh tissue.
Total anthocyanins and yellow flavonoids
were determined according to the methodology described in Francis (1982). The results are expressed in mg/100 g fresh tissue. Total carotenoids were determined as described in Lichtenthaler (1987) and the results are, as well, expressed in mg/100 g fresh tissues. To determine total chlorophyll in the pulp and in the peel samples of 1 g from each were disintegrated and homogenized according to the recommendations of Bruinsma (1963). The results, expressed in mg/100 g fresh tissue, were calculated using the formula of Engel and Poggiani (1991):
Total chlorophyll = [(A652 x 1000 x V/1000 x W)/34.5] x 100
Where: A 652
– absorbance; V – final volume,
in mL, of the extract chlorophyll/acetone and W – pulp or peel mass in gram.
The experiment was conducted in a completely
randomized design with five treatments (ripening
stages 1, 2, 3, 4 or 5) and four replicates of 100 fruit/each (experimental unit). Data were submitted to analysis of variance and averages compared via Tukey test at p < 0.05 using the computer program Assistat, version 7.6 Beta (Silva and Azevedo, 2009).
results anD DisCussion
physical characteristics
During ripening of myrtle fruit five peel colors could be distinguished (Table 1): 100% green (ripening stage 1), 50% green and 50% light red (ripening stage 2), 100% light red (ripening stage 3), 100% dark red (ripening stage 4) and 100% purple (ripening stage 5).
Concerning diameter of the fruits, a small variation in all ripening stages in longitudinal diameter (LD) was recorded (Figure 1A). Highest LD
values were observed in fruit of the ripening stage 1 (11.32 mm). Lowest values of LD were determined in fruit at the ripening stage 5 (10.12 mm). Myrtle fruit with greatest transversal diameter (TD) were observed at ripening stage 3 (10.63mm) while the smallest TD was of fruit at ripening stage 5 (9.75 mm). However, differences were not statistically
significant. The values of fruit sizes determined in
the present work indicate that myrtle fruit are small-sized with a slightly ovoid shape even though fruit with a more spherical contour were also observed.
With regards to fresh weight (FW) and dry weight (DW) of myrtle fruit, the differences amongst
ripening stages were not significant (Figure 1B).
Fruit with highest determined FW were at ripening stage 1 (0.86 g) and fruit with the lowest FW were at ripening stages 2 and 4 (0.77 g). Overall the DW of myrtle fruit diminished as ripening proceeded, with exception to ripening stage 3 at which DW of the fruit was similar to DW of myrtle fruit at ripening stage 1 (0.37 g). The lowest DW values were determined at ripening stage 5.
Menezes et al. (2015) determined that in pitayas increases in fruit fresh weight were followed by decreases of the same variable towards the end of ripening periods. The authors concluded that such reduction was possibly a result of fruit dehydration. The water mass (WM) of myrtle fruit varied from 0.49 g at the ripening stage 1 to 0.40 g at ripening stage 2 (Figure 1B). No differences were determined with regards to water contents (WC) along the ripening of myrtle fruit (Figure 1C). The values determined in myrtle fruit of the present study
are lower than the values verified by Pereira et al.
(2012) in fruit from the Myrtaceae family.
Quality and ripening variables
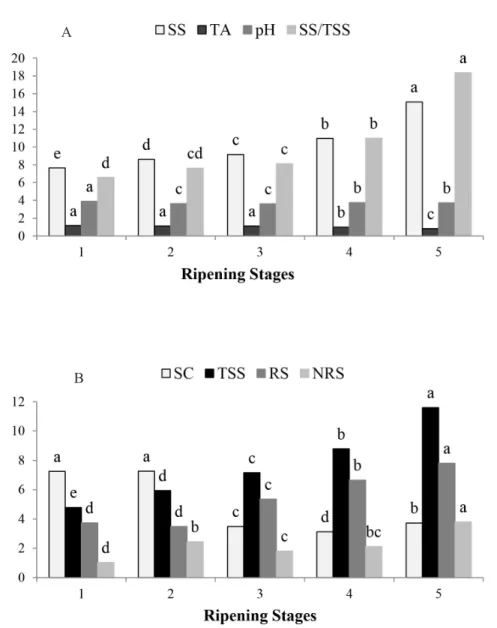
Along with the ripening processes of myrtle fruit an increase in SS contents was determined (Figure 2A). The highest values were determined in fruit at ripening stage 5 (15.08 ºBrix). Increases in sugar contents in the course ripening are common to many fruit species. According to Melo et al. (2013), SS contents tend to intensify due to biosynthesis or degradation of polysaccharides. Furthermore, a reduction in TA was observed with fruit ripening processes, however significant decreases were determined only from ripening stage 4 and onwards (Figure 2A). On the other hand, pH variation was not consistent with changes in TA contents and no coherent trend could be determined. Values ranged in between 3.90 and 3.62.
4
Rev. Bras. Frutic., v. 38, n. 2: (e-712) DOI 10.1590/0100-29452016712 March/April 2016 Jaboticabal - SP D. R. de ARAUJO et al.
progression in many other fruit species. The variable varied from 6.57 at the ripening stage 1 to 18.36 at the ripening stage 5 (Figure 2A). Menezes et al. (2015) similarly did determine an increase in the ratio SS/ TA of red pitayas during ripening. The SS/TA ratio is one of the most used indices to determine ripening and palatability of fruit because it is an indication of tastiness (Ramos et al., 2011).
Starch contents of myrtle fruit diminished with ripening (Figure 2B). A drop from 7.25% at ripening stage 1 to 3.13% at ripening stage 4 was determined. These results indicate that myrtle fruit store carbohydrates in the form of starch that is hydrolyzed to soluble solids together with ripening. On the other hand, increases in total soluble solids and reducing sugars (RS) along with ripening
processes (Figure 2B) were verified. At ripening
stage 5 myrtle fruit presented 11.6% of total soluble solids and 7.8% reducing sugars. Sharma et al. (2008) concluded that rises in total soluble solids derive from starch hydrolysis that is metabolized to sugars in the in the course of ripening. The authors also suggest that soluble sugars increases could originate from acids via the gluconeogenic pathway.
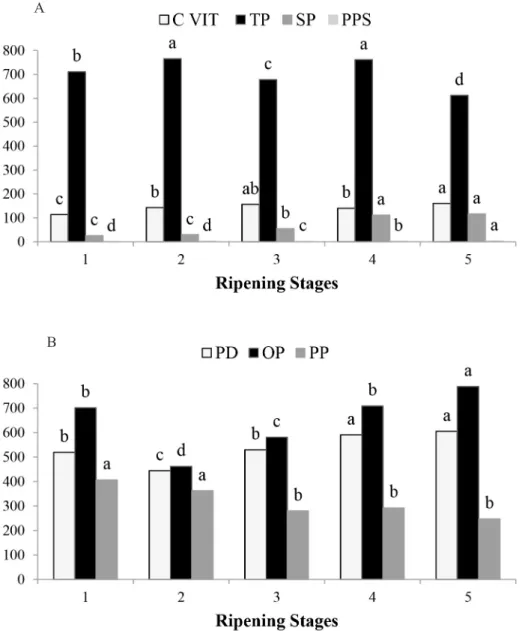
Non-reducing sugars did not change up to the ripening stage 4. The highest value of non-reducing sugars (3.8%) was determined at ripening stage 5. Ascorbic acid contents in the myrtle fruit tissues also increased alongside fruit ripening from the ripening stage 1 (113.91 mg/100 g) to 160.62mg/100 g at ripening stage 5. Exception is the ascorbic acid contents at ripening stage 4 which was similar to the contents determined in fruit at the ripening stage 2 (142.78 mg/100 g pulp tissue). Increases in ascorbic acids contents concurrently with ripening progression have been already determined in camu-camu (Myrciaria dubia) fruit by Pinto et al. (2013). According to the authors, such increases in ascorbic acid contents are associated to the synthesis metabolic intermediates that are precursors of ascorbic acid. Cavalini et al. (2015) did as well determine increases in ascorbic acid contents throughout guava ripening.
Total pectin (TP) reduction of myrtle fruit was also an expected result. TP values decreased from 711.67 mg/100 g at the ripening stage 1 to 612.66 mg/100 g at ripening stage 5 (Figure 3A). Opposed to TP values, soluble pectins (SP) concentrations increased from 25.78 mg/100 g to 118.88 mg/100 g alongside with ripening processes (Figure 3A).
Total and soluble pectins quantified for myrtle
fruit are similar to values determined by Morzelle et al. (2015) in murici fruit (Byrsonima verbascifolia) from the Brazilian Cerrado. Similarly, Souza et al. (2015) observed that the more advanced the ripening
stage the lower the total pectin contents and the higher the soluble pectin contents.
In the present work with myrtle fruit variations in phenolic compounds were determined at the different ripening stages (Figure 3B). Higher concentrations of dimers were detected at ripening stage 5 (605.03 g/100 g fresh tissue) while at ripening stage 2 the lowest concentration of phenolic dimers were attested (444.40 g/100 g fresh tissue). Oligomeric phenolics diminished from ripening stage 1 to the ripening stage 3 to increase again at ripening stages 4 and 5 at which the highest concentrations were detected (788.66 mg/100 g fresh tissue).
Polymeric phenolics presented the tendency to reduce along ripening. The contents of total phenolics in myrtle fruit was always beyond 1,200 mg/100 g fresh tissue indicating an antioxidant potential. The highest values were of oligomeric phenolics followed by dimeric and polymeric phenolics. The contents of total phenolics of myrtle fruit are similar to values determined in blueberries cultivars by Radünz et al. (2014).Total anthocyanin contents increased considerably alongside with myrtle fruit ripening varying from 4.94 mg/100 g to
125.82 mg/100 g fresh weight (Figure 4). Rufino et
al. (2010) reported 143 mg total anthocyanins in 100 g fresh tissue of myrtle fruit, a concentration very close to the values determined in the present work with fruit at the ripening stage 5.
The contents of yellow flavonoids diminished
with ripening progression up to the ripening stage 4 and at the ripening stage 5 the contents increased again. These concentrations are lower than the values detected by Rufino et al. (2010). With ripening progression, carotenoid contents increased accordingly varying from 81.0 mg/100g to 129.8 mg/100 g fresh tissue (Figure 4). Pereira et al. (2012) obtained similar values of carotenoids in uvaias (Blepharocalyx salicifolius).
5
. Bras. Frutic., v
. 38, n. 2: (e-712) DOI
10.1590/0100-29452016712
March/April 2016 Jaboticabal - SP
CharaCteriza
tion of ripening st
ages of myr
tle...
figure 1- A – Average values of longitudinal (LD) and transversal (DT) diameters (mm); B – Average values of fresh mass (MF), dry mass (MS) and water mass
(MA) (g); C – Average values of water contents (TA) (%) of myrtle fruit (Eugenia gracillima Kiaersk.) at different ripening stages.
*Columns with the same letter are not significantly different by the Tukey test (p>0.05). A
6
Rev. Bras. Frutic., v. 38, n. 2: (e-712) DOI 10.1590/0100-29452016712 March/April 2016 Jaboticabal - SP D. R. de ARAUJO et al.
taBle 1 – Peel color of myrtle fruit (Eugenia gracillima Kiaersk.) at different ripening stages.
ripening stages apparent peel color Color msCs*
Chroma Value hue angle
1 100% green 8 6 5GY
2 50% green and 50% light red 8 7 5Y
3 100% light red 6 4 5R
4 100% dark red 4 3 5R
5 100% purple 2 2,5 5P
*According to The New Munsell Student Color Set (MUNSELL, 1994).
figure 2- A – Average values of soluble solids (SS) (ºBrix) and titratable acidity (TA) (% citric acid), pH and SS/TA ratio; B – Average starch contents (SC), total soluble sugars (TSS), reducing sugars (RS) and non-reducing sugars (NRS) (in %) of myrtle fruit (Eugenia gracillima Kiaersk.) harvested at different ripening stages.
*Columns with the same letter are not significantly different by the Tukey test (p>0.05). A
figure 3 -A – Average ascorbic acid contents, total pectin (TP) and soluble pectin (SP) in mg/100 g fresh tissue and percentage of pectin solubilization (PPS); B – Average values (mg/100 fresh tissue) of phenolic dimers (PD), oligomeric phenolics (OP) and polymeric phenolics (PP) in myrtle fruit (Eugenia gracillima Kiaersk.) harvested at different ripening stages.
* Columns with the same letter are not significantly different by the Tukey test (p>0.05). A
8
Rev. Bras. Frutic., v. 38, n. 2: (e-712) DOI 10.1590/0100-29452016712 March/April 2016 Jaboticabal - SP D. R. de ARAUJO et al.
figure 4- Average values of total anthocyanin contents, yellow flavonoids, total carotenoids and total chlorophyll contents (mg/100 g fresh tissues) in myrtle fruit (Eugenia gracillima Kiaersk.) harvested at different ripening stages.
* Columns with the same letter are not significantly different by the Tukey test (p>0.05).
ConClusions
Together with ripening progression of myrtle fruit, soluble solid contents increased as did increase the ratio soluble solids:titratable acidity and soluble pectin contents. Titratable acidity decreased with ripening progression.
During ripening processes, the total chlorophyll contents reduced, though the total anthocyanin and carotenoid contents increased.
The ripening stage 4, at which peel color is 100% dark red, is the most appropriate to harvest myrtle fruit for fresh consumption.
referenCes
AOAC - Association of Official Analytical Chemists. Official methods of analysis of AOAC international. 18th ed. Gaithersburg: AOAC International, 2005. 1219p.
BLUMENKRANTZ, N.; ASBOE-HANSEN, G. New method for quantitative determination of uronic acids. analytical Biochemistry, New York, v.54, n.2, p.484-489, 1973.
BRASIL. Ministério da Saúde. Agência Nacional de Vigilância Sanitária. métodos físico-químicos para análise de alimentos. Brasília: Ministério da Saúde, 2005. 1018p.
BRUINSMA, J. The quantitative analysis of c h l o r o p h y l l s A a n d B i n p l a n t e x t r a c t s . photochemistry and photobiology, Oxford, v.2, n.2, p.241-249, 1963.
CAVALINI, F.C.; JACOMINO, A.P.; TREVISAN, M.J.; MIGUEL, A.C.A. Ponto de colheita e qualidade de goiabas ‘Kumagai’ e ‘Paluma’. revista Brasileira de fruticultura, Jaboticabal, v.37, n.1, p.64-72, 2015.
ENGEL, V.L.; POGGIANI, F. Estudo da concentração
de clorofila nas folhas e seu espectro de absorção de
luz em função do sombreamento em mudas de quatro
espécies florestais. revista Brasileira de fisiologia Vegetal, Londrina, v.3, n.1, p.39-45, 1991.
FRANCIS, F.J. Analysis of anthocyanins. In: MARKAKIS, P. (Ed.). anthocyanins as food colors. New York: Academic, 1982. p.181-207.
L I C H T E N T H A L E R , H . K . C h l o r o p h y l l s and carotenoids: pigments of photosynthetic biomembranes. In: PACKER, L.; DOUCE, R. (Ed.). methods in enzimology. London: Academic Press, 1987. v.148, p.350-81.
LUCENA, E.M.P.; ASSIS, J.S.; ALVES, R.E., SILVA, V.C.M.; ENÉIAS FILHO, J. Alterações físicas e químicas durante o desenvolvimento de mangas ‘Tommy Atkins’ não vale de São Francisco, Petrolina-PE. revista Brasileira de fruticultura, Jaboticabal, v.29, n.1, p.96-101, 2007.
LUCENA, E.M.P. de; ASSIS, J.S.; ALVES, R.E.; ENÉAS FILHO, J. Comportamento dos carboidratos e amilases de mangas Tommy Atkins durante o
desenvolvimento. Journal of the interamerican
society for tropical horticulture, San José, v.54, p.109-112, 2011.
LUCENA, E.M.P.; MAJOR, I.; BONILIA, O.H. frutas da caatinga cearense. Fortaleza: EdUECE, 2015. 156p.
McREADY, P.M.; McCOMB, E.A. Extraction and determination of total pectin materials. analytical Chemistry, Washington, v.24, n.12, p.1586-1588, 1952.
MELO, A.P.C.; SELEGUINI, A.; VELOSO, V.R.S. Caracterização física e química de frutos de araçá (Psidium guineense Swartz). Comunicata scientiae, Bom Jesus, v.4, n.1, p.91-95, 2013.
MENEZES, T.P.; RAMOS, J.D.; LIMA, L.C.O.; COSTA, A.C.; NASSUR, R.C.M.R.; RUFINI, L.C.M. Características físicas e físico-químicas de pitaia vermelha durante a maturação. semina: Ciências agrárias, Londrina, v.36, n.2, p.631-644, 2015.
MILLER, G.L. Use of dinitrosalicylic acid reagent for determination of reducing sugars. analytical Chemistry, Washington, v.31, n.3, p.426-428, 1959.
MORZELLE, M.C.; BACHIEGA, P.; SOUZA, E.C.; VILAS BOAS, E.V.B.; LAMOUNIER, M.L. Caracterização química e física de frutos de curriola, gabiroba e murici provenientes do cerrado brasileiro. revista Brasileira de fruticultura, Jaboticabal, v.37, n.1, p.096-103, 2015.
MUNSELL, A.H. the new munsell student color set. New York: Fairchild Publication, 1994. 17p.
PEREIRA, M.C.; STEFFENS, R.S.; JABLONSKI, A., HERTZ, P.F.; RIOS, A.O.; VIZZOTTO, M.; FLÔRES, S.H. Characterization and Antioxidant Potential of Brazilian Fruits from the Myrtaceae
Family. Journal of agricultural and food
Chemistry, Washington, v.60, n.12, p.3061-3067, 2012.
PINTO, P.M.; JACOMINO, A.P.; SILVA, S.R.; ANDRADE, C.A.W. Ponto de colheita e maturação de frutos de camu-camu colhidos em diferentes
estádios. pesquisa agropecuária Brasileira,
Brasília, v.48, n.6, p.605-612, 2013.
RADÜNZ, A.L.; ACUNHA, T.S.; KRÖNING, D.P.; SCHEUNEMANN, L.C.; RASSCH, C.G.; CHAVES, F.C.; HERTER, F.G. Efeito da época de poda na produção e qualidade de frutos de mirtileiro. Bragantia, Campinas, v.73, n.1, p.45-49, 2014.
RAMOS, D.P.; LEONEL, S.; SILVA, A.C.; SOUZA, M.E.; SOUZA, A.P.; FRAGOSO, A.M. Épocas de poda na sazonalidade, produção e qualidade dos frutos da goiabeira ‘Paluma’. semina: Ciências agrárias, Londrina, v.32, n.3, p.909-918, 2011.
REICHER, F.; SIERAKOWSKI, M.R.; CORREA, J.B.C. Determinação espectrofotométrica de taninos pelo reativo fosfotúngstico-fosfomolíbdico. arquivos de Biologia e tecnologia, Curitiba, v.24, n.4, p.407-411, 1981.
RUFINO, M.S.M.; ALVES, R.E.; BRITO, E.S.; PÉREZ-JIMÉNEZ J.; SAURA-CALIXTO, F.; MANCINI-FILHO, J. Bioactive compounds and antioxidant capacities of 18 non-traditional tropical fruits from Brazil. food Chemistry, Barking, v.121, n.4, p.996-1002, 2010.
SHARMA, M.; SITBON, C.; SUBRAMANIAN, J.; PALIYATHIN, G. Changes in nutritional quality of fruits and vegetables during storage. In: PALIYATH, G.; MURR, D.P.; HANDA, A.K.; LURIE, S.
(Ed.). postharvest biology and technology of
10
Rev. Bras. Frutic., v. 38, n. 2: (e-712) DOI 10.1590/0100-29452016712 March/April 2016 Jaboticabal - SP D. R. de ARAUJO et al.
SILVA, F.A.S.; AZEVEDO, C.A.V. Principal Components Analysis in the Software Assistat-Statistical Attendance. In: WORLD CONGRESS ON COMPUTERS IN AGRICULTURE, 7., Reno, 2009. proceedings... Reno: American Society of Agricultural and Biological Engineers, 2009.
SOUZA, A.V.; RODRIGUES, R.J.; GOMES, E.P.; GOMES, G.P.; VIEITES, R.L. Caracterização bromatológica de frutos e geleias de amora-preta. revista Brasileira de fruticultura, Jaboticabal, v.37, n.1, p.013-019, 2015.
STROHECKER, R.; HENNING, H.M. analisis de vitaminas: métodos comprobados. Madrid: Paz Montalvo, 1967. 428 p.
SWAIN, T.; HILLIS, E.E. The phenolic constituents of Prunus domestica: II. The analysis of tissues of the ‘victoria’ plum tree. Journal of the science of food and agriculture, London, v.10, n.2, p.135-144, 1959.