1 Received on August 28, 2016.
Accepted for publication on December 16, 2016.
2 Unidade Acadêmica de Medicina Veterinária (UAMV), Universidade Fe-deral de Campina Grande (UFCG), Av. Universitária s/n, Cx. Postal 61, Santa Cecília, Patos, PB 58700-970, Brazil. *Corresponding author: sergio@vps. fmvz.usp.br
3 Departamento de Medicina Veterinária, Centro de Ciências Agrárias (CCA), Universidade Federal da Paraíba (UFPB), Rodovia BR-079 Km 12, Areia, PB 58397-000, Brazil.
RESUMO.- [Análise de aglomerados espaciais para pa-ratuberculose bovina no Estado da Paraíba, Nordeste do Brasil.] O objetivo deste estudo foi identificar agrupa -mentos espaciais de rebanhos positivos para paratuber-culose bovina no Estado da Paraíba, Nordeste do Brasil. O estado foi dividido em três grupos amostrais: estrato
amos-tral 1 (mesorregião do Sertão), estrato amosamos-tral 2 (mesor-região da Borborema), e estrato amostral 3 (mesorregiões da Zona da Mata e Agreste). Dez animais foram amostrados em rebanhos com até 99 vacas com idade maior ou igual a 24 meses; 15 animais foram amostrados em rebanhos com 100 ou mais vacas com idade maior ou igual a 24 meses; e todos os animais foram amostrados naqueles rebanhos com até 10 vacas. No total, foram amostradas 2504 vacas com idade ≥24 meses de 480 rebanhos. Para a detecção de anticorpos anti-Mycobacterium avium subsp. paratubercu-losis (MAP) foram utilizados kits do teste imunoenzimáti-co indireto (ELISA). Um rebanho foi imunoenzimáti-considerado positivo para paratuberculose se apresentasse pelo menos um ani-mal positivo em rebanhos de até 24 fêmeas, e dois animais positivos em rebanhos com mais de 24 fêmeas. Os
agrupa-Spatial cluster analysis for bovine paratuberculosis in
Paraiba State, Northeastern Brazil
1Sérgio S. Azevedo2*, Ana L.T. Vilar2, Carolina S.A.B. Santos3, Inácio J. Clementino3,
Leise G. Fernandes2 and Clebert J. Alves2
ABSTRACT.- Azevedo S.S., Vilar A.L.T., Santos C.S.A.B., Clementino I.J., Fernandes L.G. & Al-ves C.J. 2017. Spatial cluster analysis for bovine paratuberculosis in Paraiba State, Northeastern Brazil. Pesquisa Veterinária Brasileira 37(11):1193-1197. Unidade Acadêmi-ca de Medicina Veterinária, Centro de Saúde e Tecnologia Rural, Universidade Federal de Campina Grande, Av. Universitária s/n, Cx. Postal 61, Santa Cecília, Patos, PB 58700-970, Brazil. E-mail: [email protected]
The aim of this survey was to identify spatial clustering of bovine paratuberculosis po-sitive herds in the State of Paraíba, Northeastern Brazil. The state was divided into three sampling groups: sampling stratum 1 (mesoregion of Sertão), sampling stratum 2 (meso-region of Borborema), and sampling stratum 3 (meso(meso-regions of Zona da Mata and Agreste). Ten animals were sampled in herds with up to 99 cows aged over 24 months; 15 animals were sampled in herds with 100 or more cows aged over 24 months; and all animals were sampled in those with up to 10 cows aged over 24 months. In total, 2504 cows aged ≥ 24 months were sampled from 480 herds. Indirect enzyme-linked immunosorbant assay (ELISA) test kits were used for Mycobacterium avium subsp. paratuberculosis (MAP) an-tibody detection. A herd was deemed positive for paratuberculosis if it included at least one positive animal in herds of up to 24 females, and two positive animals in herds with more than 24 females. Spatial clustering was assessed using the Cuzick-Edwards’ k-nearest neighbor method and spatial scan statistics. Two significant clustering of positive herds were detected in Northern part of Borborema mesoregion, a border region with the State of Rio Grande do Norte, in which there is a large animal movement from different locations without knowing the sanitary condition of animals. As serological tests for MAP diagnosis are not widely available and are very expensive, as well as replacement or maintenance of livestock by animal purchasing is common in the region, it is concluded that prevention measures should be applied at herd level.
mentos espaciais foram avaliados com o uso da metodolo-gia k-vizinhos mais próximos de Cuzick-Edwards e estatísti-ca espacial de varredura. Dois agrupamentos signifiestatísti-cativos de rebanhos positivos foram detectados na parte norte da mesorregião da Borborema, uma região de fronteira com o Estado do Rio Grande do Norte onde há intenso movimento de animais de diferentes locais sem o conhecimento do es-tado sanitário desses animais. Tendo em vista que os testes sorológicos para diagnóstico de MAP não são amplamente disponíveis e muito caros, bem como é comum na região a reposição e manutenção dos rebanhos por compra de ani -mais, conclui-se que medidas de prevenção devem ser apli -cadas em nível de rebanho.
TERMOS DE INDEXAÇÃO: Paratuberculose, bovinos, epidemiolo-gia, análise de cluster, controle.
INTRODUCTION
Paratuberculosis is a chronic intestinal infection of global importance in mainly domestic and wild ruminants caused by Mycobacterium avium subsp. paratuberculosis (MAP). Paratuberculosis, also known as Johne’s disease, can cau-se significant economic loscau-ses in cattle primarily related to reduced milk production and premature culling (Raizman et al. 2009), decreased value at slaughter (Kudahl & Niel-sen 2009), and eventual death (Kudahl et al. 2007), redu-ced feed efficiency, decreased fat and protein content in the milk, decreased fertility, and increased incidence of masti-tis (Nielsen et al. 2008).
MAP can be transmitted via milk and colostrum from infectious animals and intrauterine route (Streeter et al., 1995). Infected animals shed MAP in faeces and can lead to widespread contamination of environment, including the presence of viable MAP in settled dust particles suggesting potential transmission of MAP infection through bio-aero-sols (Eisenberg et al., 2010). In cattle, clinical cases can be diagnosed without difficulty because chronic diarrhea in adult animals is indicative of the disease. In the laboratory, a diagnosis can be made by isolating the agent from feces or necropsy material, by histological study of the lesions, and polymerase chain reaction (PCR) assays. Subclinical cases can be diagnosed by isolating the bacteria from the feces, serological tests, or allergy tests (Lilenbaum et al. 2007). However, the assessment of MAP infection status is subject to misclassification, especially low sensitivity of the diagnostic test used in the control programme (Nielsen & Toft 2011).
In the State of Paraíba, a cross-sectional study based on a planned sampling was carried out to determine the epi-demiological situation of the disease (Vilar et al. 2015). The herd-level prevalence in the State of Paraíba was 34.5% (95% CI=30.2%-39.1%), 26.6% (95% CI=20.2%-34.2%) in the region of Borborema, 30.5% (95% CI=23.9%-38.0%) in Agreste/Mata, and 41.4% (95% CI=34.0%-49.1%) in Ser-tão (Table 1). In understanding risk and controlling disease it is important to know the spatial distribution of the dise-ase in the environment. To date, there is no survey on spa-tial clustering analysis for bovine paratuberculosis in Bra-zil. Spatial clustering analysis is a useful tool to study the
spread of infectious diseases in animal populations, and the identification of clusters might yield important infor -mation about the transmission and/or control of such dise-ases (Carpenter 2001). Thus, in the present study a spatial cluster analysis was performed aiming to determine the spatial distribution of the disease in the State of Paraíba.
MATERIALS AND METHODS
Data used in the present study were originated from the epide-miological survey for bovine paratuberculosis in the State of Para-íba (Vilar et al. 2015). The state was divided into three sampling groups: sampling stratum 1 (mesoregion of Sertão), sampling stratum 2 (mesoregion of Borborema), and sampling stratum 3 (mesoregions of Zona da Mata and Agreste) (Fig.1). For each
sam-pling stratum, a two-stage samsam-pling survey. In the first stage, a
pre-established number of herds (primary sampling units) were randomly selected; in the second stage, a pre-established
num-ber of cows aged ≥24 months were randomly selected (secondary
sampling units).
The number of selected herds per sampling stratum was de-termined by using the formula for simple random samples
pro-posed by Thrusfield (2007). The parameters adopted for the cal
-culation were as follows: 95% confidence level, 47.4% estimated
prevalence (Sá et al. 2013), and 8% error. Further, the operational
and financial capacity of the SEDAP was taken into consideration
when determining the sample size of the sampling stratum. For the secondary units, the minimum number of animals to be examined within each herd was estimated in order to allow
its classification as positive herd. For this purpose, the concept of aggregate sensitivity and specificity was used (Dohoo et al. 2003). For the calculations, the following values were adopted: 73.6% (Hendrick et al. 2005) and 98% (Sweeney et al. 1995) for the
sen-sitivity and specificity, respectively, of the test protocol and 37.9%
(Fonseca et al. 2000) for the intra-herd estimated prevalence. Herdacc version 3 software (Jordan 1995) was used during this process, and the sample size was selected so that the herd
sensiti-vity and specificity values would be ≥ 90%. Therefore, 10 animals
were sampled in herds with up to 99 cows aged over 24 months; 15 animals were sampled in herds with 100 or more cows aged over 24 months; and all animals were sampled in those with up to 10 cows aged over 24 months. The selection of the cows within the herds was systematic. In total, 2504 animals were sampled from 480 cattle herds.
The target condition (Gardner et al. 2011) was a
seropositi-ve animal within an infected herd. The herd-leseropositi-vel case definition was based on the size of the population (cows aged ≥ 24 months),
number of females sampled, an intra-herd apparent prevalence of
37.9% (Fonseca et al., 2000), and the sensitivity and specificity of
the diagnostic test used (indirect ELISA), with the goal of
obtai-ning a herd sensitivity and specificity of ≥90%. After new simula -tions using Herdacc software, a herd was deemed positive for the presence of MAP if it included at least one positive animal in herds of up to 24 females, and two positive animals in herds with more than 24 females.
The serological examination was performed according to the protocol recommended by the kit for detection of antibodies to MAP (Pourquier-IDEXX ELISA Paratuberculosis Screening Ab Test). To calculate the results, the reactions were considered valid when the average of the positive control (PCx) had a minimum
OD450 mean value of 0.350 and the coefficient between the ave
-rage of the PCx and the negative control (NC OD450) was ≥3.00. Samples with percentages ≥70% were considered positive for the
Spatial clustering of bovine paratuberculosis positive her-ds was assessed using two methoher-ds (Ward & Carpenter 2000). First, the Cuzick-Edwards’ k-nearest neighbor method (Cuzick & Edwards 1990) was used to detect the possibility of global spa-tial clustering at herd level using the ClusterSeer 2.5.1 software (BioMedware, Ann Arbor, MI, United States). Existence of
poten-tial spapoten-tial clustering was analyzed at each of the first 10 neigh -borhood levels, and the overall p-value was adjusted for multiple comparisons with the Simes approach. Further, scan statistics by the SatScan software version 9.0 (Kulldorff & Nagarwalla 1995) was used to identify local clusters of positive herds. A Bernoulli model was applied, the scanning window was circular, and the spatial size of scan window was limited to 25% of the total popu-lation. Because of the large proportion of positive herds (Table 1), analysis was not run on herd-level, and then considering within--herd prevalence.
RESULTS AND DISCUSSION
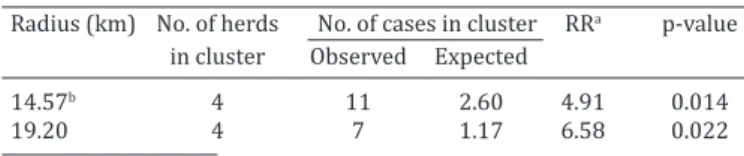
Significant clusters were not identified (Simes p>0.05) by the Cuzick and Edwards’ method for the entire Paraiba Sta-te. However, when considering the state division into se-parate strata a significant global clustering (Simes p<0.05) of positive herds was detected by the Cuzick and Edwards’ method at k=3 neighborhood level in Borborema mesore-gion. The results of the SatScan cluster analysis is shown in Table 2 and Figure 1. Using the Bernoulli model, two spatial clusters of positive herds with high within-herd prevalence were detected in Northern part of Borborema mesoregion. In the primary cluster, the number of herds was 4, the ra-dius of the cluster was 14.57 km, and the number of
ob-served and expected cases (positive animals) were 11 and 2.60, respectively, where the risk for infection was 4.91 (relative risk =4.91; p=0.014) times higher in herds loca-ted inside cluster than in those localoca-ted elsewhere. In the secondary cluster, the number of herds was 4, the radius of the cluster was 19.20 km, and the number of observed and expected cases (positive animals) were 7 and 1.17, res-pectively, and the risk for infection was 6.58 (relative risk =6.58; p=0.022).
In a survey to describe the spatial pattern of MAP preva-lence throughout Denmark it was found a number of signi-ficant clusters, identifying geographical areas with higher apparent within-herd prevalence (Bihrmann et al. 2012). This study found consistency between kriging and scan statistics results with respect to location of areas with high apparent within-herd prevalence of MAP. However, these authors did not take any covariate information into ac-count. Recently, Bihrmann et al. (2016) identified the spa -tial pattern in infection prevalence in Denmark and found a significant spatial component, suggesting that the estima -ted range of influence and the overall location of areas with increased prevalence are not very sensitive to diagnostic misclassification.
In the present study there was a lack of spatial cluster of bovine paratuberculosis positive herds throughout the Pa-raíba State, but spatial clusters were identified when con -sidering the separate mesoregions. However, it can be in-ferred that these clusters cannot be explained by spatially structured factors as referred by Ávila et al. (2013), which Fig.1. Significant clusters of cattle herds with a high within-herd prevalence of paratuberculosis in Paraíba State. Primary cluster: circu
detected cluster for bovine tuberculosis in Bahia State only when analyzed regions separately. The geographic division (Sertão, Borborema, Agreste/Zona da Mata) created in this study for analysis purposes is not subject to real parame-ters occurrence of paratuberculosis, and does not respect geographical boundaries. Thus, the clusters found in the Borborema region can be explained by being a border re-gion with the State of Rio Grande do Norte, in which there is a large movement of animals from different locations wi-thout knowing the sanitary condition of the animals, which may result in a greater number of traded animals subclini-cally infected with MAP.
The detection of spatial clustering is a complex me-thodology and has limitations, however, the obtainment of more accurate results and security for decision-making lead to a greater efficiency of sanitary defense actions (Ávi -la et al. 2013). In this context, it is not p-lausible to sug-gest measures based on animal testing prior to purchasing because serological tests for MAP diagnosis are not widely available and are very expensive, as well as replacement or maintenance of livestock by animal purchasing is common in the region. Furthermore, in general, the design quality, implementation, and reporting of test results for paratu-berculosis have been generally poor (Nielsen & Toft 2008). Therefore, measures should be based on the prevention of the disease at herd level, such as keep calves in areas free of manure and raised separate from adults until at least one year old, reducing fecal contamination in animal housing areas by elevating food and water sources, and using co-lostrum only from the dam of the calf (Nielsen et al. 2008, OIE 2016).
CONCLUSION
We detected two spatial clusters of cattle herds with a high within-herd seroprevalence of paratuberculosis in the State of Paraíba, in a border region with the State of Rio Grande do Norte, which suggests a between-states trade of infected animals.
It is also suggested that paratuberculosis prevention measures should be applied at herd level.
Acknowledgements.- This study was financed by the Conselho Nacional
de Desenvolvimento Científico e Tecnológico (CNPq), under the codes
471571/2011-3, 302131/2012-4 and 476596/2013-0.
REFERENCES
Ávila L.N., Perez A.M., Ferreira Neto J.S., Ferreira F., Telles E.O., Dias R.A.,
Amaku M. & Gonçalves V.S.P. 2013. Análise de detecção de cluster na caracterização espaço-temporal da tuberculose bovina no estado da
Bahia. Pesq. Vet. Bras. 33(11):1313-1318.
Bihrmann K., Nielsen S.S., Toft N. & Ersbøll A.K. 2012. Spatial differences in occurrence of paratuberculosis in Danish dairy herds and in control programme participation. Prev. Vet. Med. 103:112-119.
Bihrmann K., Nielsen S.S. & Ersbøll A.K. 2016. Spatial pattern in prevalence
of paratuberculosis infection diagnosed with misclassification in Danish
dairy herds in 2009 and 2013. Spat. Spatio-Temp. Epidemiol. 16:1-10. Carpenter T.E. 2001. Methods to investigate spatial and temporal
cluste-ring in veterinary epidemiology. Prev. Vet. Med. 48:303-320.
Cuzick J. & Edwards R. 1990. Spatial clustering for inhomogeneous popu-lations. J. R. Statist. Soc. B 52:73-104.
Dohoo I.R., Martin W. & Stryhn H. 2003. Veterinary epidemiologic resear-ch. Atlantic Veterinary College, Charlottetown. 706p.
Eisenberg S.W., Nielen M., Santema W., Houwers D.J., Heederik D. & Koets A.P. 2010. Detection of spatial and temporal spread of Mycobacterium avium subsp. paratuberculosis in the environment of a cattle farm throu-gh bio-aerosols. Vet. Microbiol. 143(2/4):284-292.
Fonseca L.F.L., Olival A.A., Pereira C.C., Heinemann M.B., Richtzenhain L.J. &
Santos M.V. 2000. Identificação de anticorpos anti-Mycobacterium para-tuberculosis em rebanhos bovinos leiteiros do Estado de São Paulo. Arq. Fac. Vet. UFRGS 28:51-56.
Gardner I.A., Nielsen S.S., Whittington R.J., Collins M.T., Bakker D., Harris B., Sreevatsan S., Lombard J.E., Sweeney R., Smith D.R., Gavalchin J. & Eda S. 2011. Consensus-based reporting standards for diagnostic test accuracy studies for paratuberculosis in ruminants. Prev. Vet. Med. 101:18-34.
Hendrick S.H., Duffield T.F., Kelton D.F., Leslie K.E., Lissemore K.D. & Ar -chambault M. 2005. Evaluation of enzyme-linked immunosorbent as-says performed on milk and serum samples for detection of paratuber-culosis in lactating cows. J. Am. Vet. Med. Assoc. 226:424-428.
Jordan D. 1995. Herdacc: A Program for Calculating Herd Level
(Aggre-gate) Sensitivity and Specificity. Department of population medicine,
University of Guelph, Guelph, O.N., Canada.
Kudahl A.B. & Nielsen S.S. 2009. Effect of paratuberculosis on slaughter weight and slaughter value of dairy cows. J. Dairy Sci. 92:4340-4346. Kudahl A.B., Østergaard S., Sørensen J.T. & Nielsen S.S. 2007. A
stochas-tic model simulating paratuberculosis in a dairy herd. Prev. Vet. Med. 78:97-117.
Kulldorff M. & Nagarwalla N. 1995. Spatial disease clusters: detection and inference. Stat. Med. 14:799-810.
Lilenbaum W., Marassi C.D. & Oelemann W.M.R. 2007. Paratuberculosis: an update. Braz. J. Microbiol. 38:580-590.
Table 1. Census data of the cattle population in the State of Paraíba, Northeastern Brazil, according to sampling stratum, and herd-level
prevalence for bovine paratuberculosis
Sampling stratum Total no. of herds No. of herds Prevalence (%) 95% CI
Tested Positive
Sertão 24,356 162 67 41.4 [34.0 – 49.1]
Borborema 11,603 154 41 26.6 [20.2 – 34.2]
Agreste/Zona da Mata 18,398 164 50 30.5 [23.9 – 38.0]
State of Paraíba 54,357 480 158 34.5 [30.2 – 39.1]
Source: Vilar et al. (2015).
Table 2. Statistically significant clusters of herds with a high within-herd prevalence of paratuberculosis in the
State of Paraíba
Radius (km) No. of herds No. of cases in cluster RRa p-value in cluster Observed Expected
14.57b 4 11 2.60 4.91 0.014
19.20 4 7 1.17 6.58 0.022
Nielsen S.S., Bjerre H. & Toft N. 2008. Colostrum and milk as risk factors for infection with Mycobacterium avium subspecies paratuberculosis in dairy cattle. J. Dairy Sci. 91(12):4610-4615.
Nielsen S.S. & Toft N. 2008. Ante morten diagnosis of paratuberculosis: a
review of accuracies of ELISA, interferon-γ assay ad fecal culture techni -ques. Vet. Microbiol. 129:217-235.
Nielsen S.S. & Toft N. 2011. Effect of management practices on paratuber-culosis prevalence in Danish dairy herds. J. Dairy Sci. 94:1849-1857. OIE 2016. Animal Disease Information: paratuberculosis. World
Organi-zation for Animal Health. Disponível em <http://www.oie.int/filead -
min/Home/eng/Media_Center/docs/pdf/Disease_cards/PARATUBER-CULOSIS-EN.pdf> Assessed on Jul. 22, 2016.
Raizman E.A., Fetrow J.P. & Wells S.J. 2009. Loss of income from cows she-dding Mycobacterium avium subspecies paratuberculosis prior to cal-ving compared with cows not shedding the organism on two Minnesota dairy farms. J. Dairy Sci. 92:4929-4936.
Sá L.M., Oliveira J.M.B., Santos G.R., Brandespim D.F., Silva-Júnior J.L., Mota
R.A. & Pinheiro Júnior J.W. 2013. Avaliação sorológica e de fatores de risco para a infecção por Mycobacterium avium subsp.
paratuberculo-sis em rebanhos leiteiros da Microrregião de Garanhuns, Pernambuco. Pesq. Vet. Bras. 33:310-313.
Streeter R.N., Hoffsis G.F., Bech-Nielsen S., Shulaw W.P. & Rings D.M. 1995. Isolation of Mycobacterium paratuberculosis from colostrum and milk of subclinically infected cows. Am. J. Vet. Res. 56:1322-1324.
Sweeney R.W., Whitlock R.H., Buckley C.L. & Spencer P.A. 1995. Evalu-ation of a commercial enzyme-linked immunosorbent assay for the diagnosis of paratuberculosis in dairy cattle. J. Vet. Diagn. Invest. 7:488-493.
Thrusfield M. 2007. Veterinary Epidemiology. 3rd ed. Blackwell Science,
Oxford. 624p.
Vilar A.L.T., Santos C.S.A.B., Pimenta C.L.R.M., Freitas T.D., Brasil A.W.L., Clementino I.J., Alves C.J., Bezerra C.S., Riet-Correia F., Oliveira T.S. & Azevedo S.S. 2015. Herd-level prevalence and associated risk factors for
Mycobacterium avium subsp. paratuberculosis in cattle in the State of Paraíba, Northeastern Brazil. Prev. Vet. Med. 121(1/2):49-55.