Nutrient accumulation at the initial growth
of pitaya plants according to phosphorus fertilization
1Rodrigo Amato Moreira2, Maria do Céu Monteiro da Cruz2,
Denison Ramalho Fernandes2, Enilson de Barros e Silva2, Jéssica de Oliveira2
INTRODUCTION
Pitaya is an epiphyte plant of the Cactaceae family, originally from subtropical and tropical American forests, widely distributed from Florida to Brazil. Worldwide, this fruit is known as “pitahaya” or “dragon fruit” (Ortiz-Hernández & Carrillo-Salazar 2012). The crop has a high ornamental potential and fruit production and is a rich source of compounds to the industry.
In Brazil, a significant marketing increase has
occurred, because the Companhia de Entrepostos
ABSTRACT
RESUMO
e Armazéns Gerais do Estado de São Paulo (CEAGESP), the country’s largest marketing warehouse, marketed more than 247 t of fruits in 2012, an increase of 250 %, if compared to 2007 (Watanabe & Oliveira 2014).
Although research on pitaya crop has increased, there is still too much to study (Ortiz- Hernández & Carrillo-Salazar 2012), especially in relation to the
factors that influence its growth and production.
Among them, fertilization can be highlighted, since it is critical for achieving success in the cultivation of fruits (Pegoraro et al. 2014).
1. Manuscript received in Apr./2016 and accepted for publication in Aug./2016 (http://dx.doi.org/10.1590/1983-40632016v4640813). 2. Universidade Federal dos Vales do Jequitinhonha e Mucuri, Departamento de Agronomia, Diamantina, MG, Brazil.
E-mails: amatomoreira@yahoo.com.br, mariceu@ufvjm.edu.br, denison_ramalho@yahoo.com.br, The knowledge about the amount of nutrient uptake in
pitaya plants helps the balanced fertilizer recommendation for the crop, providing adequate nutrition and contributing to the maximum expression of this species potential. This research was carried out in order to evaluate the growth, nutrient accumulation
and efficiency of absorption, transportation and use of P by pitaya
according to phosphorus fertilization. A randomized blocks
design was used, with five doses of P (0 mg dm-3, 20 mg dm-3, 40 mg dm-3, 80 mg dm-3 and 160 mg dm-3) incorporated into the soil, with four replications, three pots per plot and one cutting per pot. Differences in the nutrient accumulation of all doses were evident in the pitaya shoots and roots, as well as in the
efficiency of absorption, transport and use of P, according to
phosphorus fertilization. The nutrient accumulation in the pitaya roots was ranked in the following order: N > K > Ca > S > P >
Mg > Fe > Mn > Zn > B ≥ Cu. For the shoots, the order was: K > N > Ca > S > Mg > P > Mn > Fe > Zn > B ≥ Cu. The initial
growth of pitaya plants was maximum with 81 mg dm-3 of P, in a Red-Yellow Dystrophic Latosol. The application of 44-67 mg dm3 of P to the soil promoted the highest accumulation of macro and micronutrients in the pitaya.
KEY-WORDS: Hylocereus undatus; dragon fruit; mineral nutrition; single superphosphate.
Acúmulo de nutrientes no crescimento inicial de pitaia em função da adubação fosfatada
O conhecimento da quantidade de nutrientes acumulados na pitaia auxilia na recomendação de adubação equilibrada, a qual proporciona nutrição adequada e contribui para a máxima expressão do potencial dessa espécie. Objetivou-se avaliar o crescimento, acúmulo de nutrientes e eficiências de absorção, transporte e utilização de P pela pitaia, em função da adubação fosfatada. Utilizou-se o delineamento experimental em blocos casualizados, com cinco doses de P (0 mg dm-3, 20 mg dm-3, 40 mg dm-3, 80 mg dm-3 e 160 mg dm-3) incorporadas ao solo, com quatro repetições, três vasos por parcela e uma estaca por vaso. Foram observadas diferenças no acúmulo de todos os nutrientes na parte aérea e nas raízes da pitaia
e nas eficiências de absorção, transporte e utilização de P, em função
da adubação fosfatada. O acúmulo de nutrientes pelas raízes da pitaia obedeceu à seguinte ordem: N > K > Ca > S > P > Mg > Fe >
Mn > Zn > B ≥ Cu. Na parte aérea, a ordem foi: K > N > Ca > S > Mg > P > Mn > Fe > Zn > B ≥ Cu. O crescimento inicial da pitaia
foi máximo com 81 mg dm-3 de P, em Latossolo Vermelho-Amarelo
distrófico. A aplicação de 44-67 mg dm-3 de P ao solo promoveu os maiores acúmulos de macro e micronutrientes na pitaia.
Knowledge about the amount of nutrient uptake in the plant can aid a balanced fertilizer recommendation for the crop. Adequate nutrition contributes to the ultimate expression of the crop potential (Augostinho et al. 2008).
Phosphorus (P) is a nutrient that requires attention, because its deficiency can reduce the development of shoots and roots of crops. This macronutrient is present at low levels in tropical soils (Prado et al. 2005). In addition, P is associated with photosynthesis, cell division and use of carbohydrates (López-Bucio et al. 2002). Moreover,
P application on the soil influences initial growth and
nutrient accumulation in cladodes of pitaya (Corrêa et al. 2014).
Thus, an experiment was carried out to evaluate the growth, nutrient accumulation and
efficiency of absorption, transport and use of P by
pitaya, according to phosphorus fertilization.
MATERIAL AND METHODS
The experiment was conducted from April 2013 to February 2014, in a greenhouse with temperature of 25 ºC ± 7 ºC, at the Universidade Federal dos Vales do Jequitinhonha e Mucuri (18º14’56’’S, 43º36’0’’W), in Diamantina, Minas Gerais State, Brazil.
Pitaya [Hylocereus undatus (Haw.) Britton & Rose] cuttings (0.20 m long) were sectioned at the apex, to remove the apical dominance. Before planting, the cuttings undergone a period of healing, in a shaded environment, for three days.
The cuttings were planted in polyethylene pots with capacity of 4 dm3 of soil, in April 2013. The pots were filled with Red-Yellow Dystrophic
Latosol (Santos et al. 2013), with layers of 0-0.20 m depth, which was air dried and passed through a sieve of 5.0 mm. One subsample was taken and passed through a sieve of 2.0 mm, for chemical and soil textural analysis (Embrapa 1997) (Table 1).
Liming was performed to raise the base saturation to 60 %, with dolomitic limestone (PRNT = 87 %), equivalent to 2 t ha-1 in each pot. Thereafter,
the pots were watered and covered with polyethylene bags, for 15 days, before planting the cuttings. For fertilization, 25 mg dm-3 of the FTE BR12 fertilizer
(1.0 % of Ca, 5.7 % of S, 1.8 % of B, 0.8 % of Cu, 2.0 % of Mn, 0.1 % of Mo and 9.0 % of Zn) were applied.
A randomized complete blocks design was
used, with five doses of P (0 mg dm-3, 20 mg dm-3,
40 mg dm-3, 80 mg dm-3 and 160 mg dm-3) incorporated
into the soil, with four replications and three plants per plot and one cutting per pot. Single superphosphate (18 % of P2O5, 16 % of Ca and 8 % of S) was used as a source of P.
Ammonium sulfate (21 % of N and 24 % of S) and urea (45 % of N) were used as sources of N, aiming at providing the same amount of S for all plants, and potassium chloride (60 % of K2O) as a source of K. Then, 300 mg of N per dm3 of soil and
150 mg of K per dm3 of soil were split into three
applications, in June, September and December 2013.
The irrigation of pitayas was carried out once a
day by nebulization, to keep the soil at field capacity.
The plants were conducted with wooden stakes in each pot and polyethylene strips.
At ten months after planting, the pitaya plants were segmented and separated in shoots and roots. All parts were washed and packed in paper bags and dried in an oven with forced air circulation at a temperature
of 65 ºC, for five to seven days, until constant weight,
for dry mass (g plant-1) determination.
After evaluating the dry mass, the plant material was ground for nutrient analyses (N, P, K, Ca, Mg, S, Zn, Cu, Fe, Mn and B), according to Bataglia et al. (1983). The macro (g plant-1) and
micronutrients (mg plant-1) accumulation were
calculated by multiplying the nutrient level by mass of roots or shoots.
pH(H2O): soil-water relation 1:2.5; P and K: Mehlich-1 extractor; Ca, Mg and Al: KCl 1 mol L
-1 extractor; T: cation exchange capacity at pH 7.0; m: aluminum saturation;
V: base saturation; OM: organic matter, determined by multiplying the result of organic carbon, using the Walkey-Black method, by 1.724; sand, silt and clay: pipet method. pH
(H2O)
P K Ca Mg Al T M V OM Sand Silt Clay
____ mg dm-3 ____ _______________ mmol c dm
-3 _______________ _________ % _________ g dm-3 _____________ g kg-1 _____________
5.1 1.8 22.8 10 3 5 51 27 28 4 630 140 230
From the dry mass, the following was calculated: P content absorption efficiency = total content of the nutrient in the plant/root dry mass (mg g-1) (Swiader et al. 1994); transport efficiency = nutrient content in the shoot/total content
of the nutrient in the plant x 100, in % (Li et al.
1991); use efficiency = total dry mass produced2/total
content of the nutrient in the plant (mg g-1) (Siddiqi &
Glass 1981).
At the end of the experiment, soil samples were collected for chemical analysis, to determine the pH; P and K (Mehlich-1); Ca, Mg and Al (KCl 1 mol L-1); and H + Al (calcium acetate 0.5 mol L-1),
according to Embrapa (1997).
Data were submitted to analysis of variance and polynomial regression. The choice of the models was based on the potential to explain the biological
phenomenon in question, coefficient of determination and significance of the regression coefficients, using
the ‘t’ test (p < 0.01).The Sisvar® statistical analysis
software was used.
RESULTS AND DISCUSSION
Differences in dry mass and in the accumulation of all nutrients in the pitaya shoots and roots occurred as a function of phosphorus fertilization (p < 0.01).
The P estimated dose of 85 mg dm-3 provided
an increase of 45.3 % in the dry root mass, and 79 mg dm-3 of P in the soil increased 48.9 % the shoot
dry mass, when compared to the dry mass of plants without P application (Figure 1). The initial level of P in the soil used is very low (Table 1), with less than 6.6 mg dm-3 (Alvarez et al. 1999). This is the reason
why the phosphate fertilizer increased the growth of pitaya plants (Figure l).
Phosphorus application is recommended during the initial growth of plants, because this nutrient is important for photosynthesis and in the initiation and development of roots, increasing
the water use efficiency, as well as absorption and
use of other nutrients (Skrebsky et al. 2008). The greater formation of pitaya roots probably occurred because the addition of P provided a more adequate availability of nutrients (Dechen & Nachtigall 2007), as observed by Silva et al. (2011), in ‘Prata Anã’ banana nursery trees, as a function of phosphorus fertilization.
The highest accumulation of N and P in the roots of pitaya occurred in the estimated doses of 62 mg dm-3 and 71 mg dm-3 of P, which increased
these nutrients by 43.2 % and 90.1 %, respectively, when compared to the treatment without P. For K, the application of 53 mg dm-3 of P in the soil promoted a
24.7 % higher accumulation than the control without application of P (Figure 2a).
For the shoots, the maximum accumulation of N was observed with 69 mg of added P per dm3, K
with 70 mg of added P per dm3 and P with 75 mg dm-3
of added P. These doses of P provided increments of 72.3 % in N, 78.0 % in K and 225.0 % in P, in relation to the control with no P fertilization (Figure 2b).
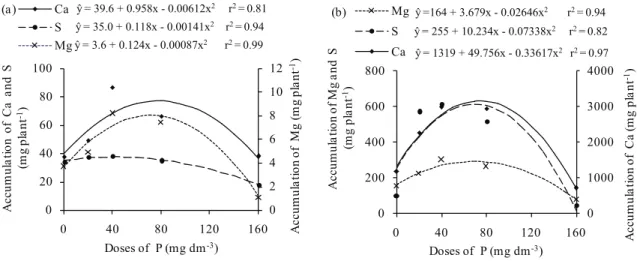
The highest values for Ca, Mg and S accumulation in roots were observed with the estimated doses of 78 mg dm-3, 71 mg dm-3 and
42 mg dm-3 of P, respectively. These doses of
P increased the accumulation of Ca, Mg and S by 94.7 %, 122.7 % and 7.1 %, respectively, if
Figure 1. Dry mass of roots (a) and shoots (b) of pitaya, as a function of doses of P applied to a Red-Yellow Dystrophic Latosol. 25
30 35 40 45 50 55
0 40 80 120 160
D
ry
m
a
ss
(
g
p
la
n
t
-1)
Doses of P (mg dm-3)
ŷ= 33.5 + 0.416x - 0.00264x2
r2= 0.96 (b)
4 5 6 7 8
0 40 80 120 160
D
ry
m
a
ss
(
g
p
la
n
t
-1)
Doses of P (mg dm-3)
ŷ= 5.0 + 0.053x - 0.00031x2
compared to the values accumulated in pitayas without application of P (Figure 3a). In the shoots, the behavior of these three nutrients was similar, with increment of 139.6 % in the estimated dose of 74 mg dm-3 of P to Ca, 78.0 % with 70 mg dm-3
of P to Mg and 139.9 % with the estimated dose of 70 mg dm-3 of P to S (Figure 3b).
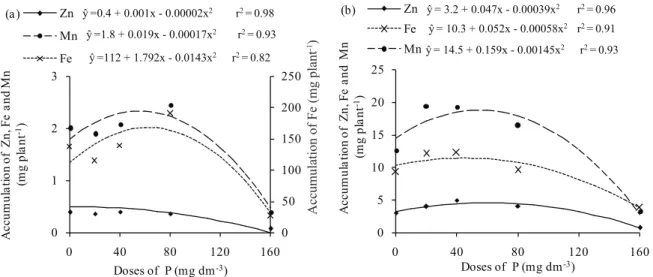
The micronutrient accumulations in the pitaya roots also showed influence of P application to the soil, because increases of 3.1 % in Zn, 50.1 % in Fe and 58.5 % in Mn occurred in the doses of 25 mg dm-3, 63 mg dm-3 and 56 mg dm-3 of P, respectively
(Figure 4a). This effect was also observed in the shoots, with increases of 44.3 % in the accumulation of Zn, 11.3 % in Fe and 30.1 % in Mn, when compared to the control, with estimated doses of 60 mg dm-3, 45 mg dm-3
and 55 mg dm-3 of P (Figure 4b).
Regarding Cu accumulation, the behavior was also quadratic, with increases of 43.3 % and 54.3 %, respectively for the roots and shoots, with estimated doses of 75 mg dm-3 and 64 mg dm-3 of P in the soil.
For B, increases of 107.1 % and 44.1 % occurred in the accumulation of this nutrient in the roots and shoots, respectively, at doses of 75 mg dm-3 and
Figure 3. Ca, Mg and S accumulation in pitaya roots (a) and shoots (b), as a function of doses of P applied to a Red-Yellow Dystrophic Latosol. 0 2 4 6 8 10 12 0 20 40 60 80 100
0 40 80 120 160 Ac
c u m u la ti o n o f M g ( m g p la n t -1) A c c u m u la ti o n o f C a a n d S (m g p la n t -1)
Doses of P (mg dm-3)
Ca S Mg
ŷ= 39.6 + 0.958x - 0.00612x2 r2 = 0.81
ŷ= 35.0 + 0.118x - 0.00141x2 r2 = 0.94
ŷ= 3.6 + 0.124x - 0.00087x2 r2 = 0.99 (a ) 0 1000 2000 3000 4000 0 200 400 600 800
0 40 80 120 160 Acc
u m u la ti o n o f C a ( m g p la n t -1) A c c u m u la ti o n o f M g a n d S (m g p la n t -1)
Doses of P (mg dm-3)
Mg
S
Ca
ŷ=164 + 3.679x - 0.02646x2 r2 = 0.94
ŷ= 255 + 10.234x - 0.07338x2 r2 = 0.82
ŷ= 1319 + 49.756x - 0.33617x2 r2 = 0.97 (b)
Figure 2. N, P and K accumulation in pitaya roots (a) and shoots (b), as a function of doses of P applied to a Red-Yellow Dystrophic Latosol. 0 2 4 6 8 10 12 14 16 18 0 100 200 300 400
0 40 80 120 160 A
c c u m u la ti o n o f P ( m g p la n t -1) A c c u m u la ti o n o f N a n d K ( m g p la n t -1)
Doses of P (mg dm-3) N
K
P
ŷ= 257 + 3.554x- 0.02845x2 r2 =
0.94
ŷ= 120 + 1.125x- 0.01069x2 r2 = 0.94
ŷ= 7.2 + 0.183x- 0.00129x2 r2 = 0.98
(a ) 0,00 0,05 0,10 0,15 0,20 0,25 0,30 0,0 0,5 1,0 1,5 2,0 2,5 3,0
0 40 80 120 160
A c c u m u la ti o n o f P ( g p la n t -1) A c c u m u la ti o n o f N a n d K ( g p la n t -1)
Doses of P (mg dm-3) N
K P
ŷ= 1.2 + 0.025x - 0.00018x2 r2 = 0.97
ŷ=1.4 + 0.031x - 0.00022x2 r2 = 0.98
ŷ= 0.05 + 0.003x - 0.00002x2 r2 = 0.94
59 mg dm-3 of P in the soil, in relation to the control
(Figures 5a and 5b).
The results observed for both macronutrient and micronutrient accumulation can be explained due to the fact that P is essential for plant growth and development (Skrebsky et al. 2008). Furthermore, this nutrient is associated with photosynthesis, cell division and use of sugar and starch (López-Bucio et al. 2002). Moreover, P is present at low levels in tropical soils (Prado et al. 2005).
However, it is evident that P should be applied in adequate amounts to promote the availability and accumulation of other nutrients in pitaya. Excessive
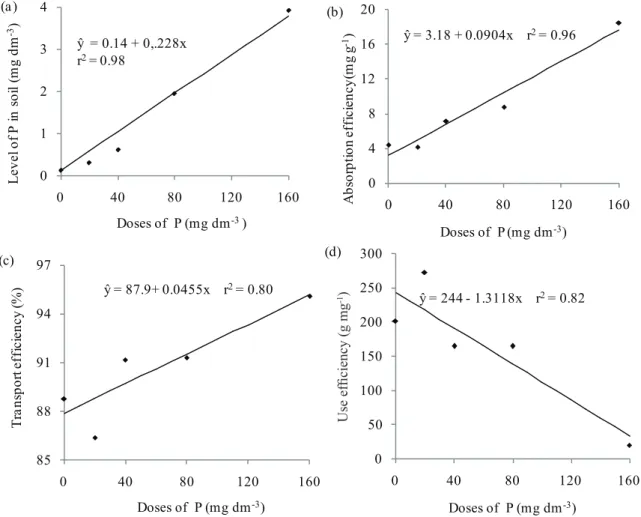
P supply can promote ions imbalance in the soil, reducing plant growth. This imbalance may occur because higher doses of P fertilization promoted a linear increase in the P availability in the soil (Figure 6a).
Higher P amounts in the dry mass of shoots of Barbados cherry seedlings and pitaya were observed by Corrêa et al. (2002) and Corrêa et al. (2014), respectively, with addition of P to the substrate. Excess of P on the substrate increases their availability in the soil solution, thus favoring a greater absorption by roots, increasing this nutrient in all plant organs.
Figure 5. B and Cu accumulation in pitaya roots (a) and shoots (b), as a function of doses of P applied to a Red-Yellow Dystrophic Latosol. 0 0,1 0,2 0,3 0,4 0,5
0 40 80 120 160
A c c u m u la ti o m o f C u a n d B (m g p la n t -1)
Doses of P (mg dm-3)
Cu
B
ŷ= 0.26 + 0.003x - 0.00002x2 r2 = 0.95
ŷ= 0.21 + 0.006x - 0.00004x2 r2 = 0.90 (a ) . . . . . 0,0 0,2 0,4 0,6 0,8 1,0 1,2 1,4
0 40 80 120 160
A c c u m u la ti o n o f C u a n d B (m g p la n t -1)
Doses of P (mg dm-3)
Cu
B
ŷ= 0.82 + 0.014x - 0.00011x2 r2 = 0.99
ŷ= 0.87 + 0.013x - 0.00011x2 r2 = 0.98 (b) . . . . . . . .
Figure 4. Zn, Fe and Mn accumulation in pitaya roots (a) and shoots (b), as a function of doses of P applied to a Red-Yellow Dystrophic Latosol. 0 50 100 150 200 250 0 1 2 3
0 40 80 120 160
A c ú m u lo d e F e ( m g p la n ta -1) A c c u m u la ti o n o f Z n , F e a n d M n (m g p la n t -1)
Doses of P (mg dm-3)
Zn
Mn
Fe
ŷ=0.4 + 0.001x - 0.00002x2 r2 = 0.98
ŷ=1.8 + 0.019x - 0.00017x2 r2 = 0.93
ŷ=112 + 1.792x - 0.0143x2 r2 = 0.82 (a ) 0 5 10 15 20 25
0 40 80 120 160
A c c u m u la ti o n o f Z n , F e a n d M n (m g p la n t -1)
Doses of P (mg dm-3)
Zn
Fe
Mn
ŷ= 3.2 + 0.047x - 0.00039x2 r2 = 0.96
ŷ= 10.3 + 0.052x - 0.00058x2 r2 = 0.91
ŷ= 14.5 + 0.159x - 0.00145x2 r2 = 0.93 (b)
Accumulation of Fe (mg plant
It is worth mentioning that the soil characteristics remained similar under the different levels of P applied (Table 2). This fact probably occurred because the same supply of nutrients occurred in all treatments, except for P, which constitutes the studied element, altered in the treatments (Figure 6a).
The high levels of P in the soil promoted a linear
increase in the P absorption efficiency (Figure 6b),
attributed to the increased P availability in the soil (Figure 6a). Moreover, there was an increase in transport
efficiency from 87.8 %, in pitaya without P application,
to 95.1 %, in plants with 160 mg dm-3 of P (Figure 6c).
Figure 6.Levels of P in the soil (a), P absorption efficiency (b), P transport efficiency (c) and P use efficiency (d) of pitaya, as a function of doses of P applied to a Red-Yellow Dystrophic Latosol.
0 4 8 12 16 20
0 40 80 120 160
A
b
so
rp
ti
o
n
e
ff
ic
ie
n
c
y
(m
g g
-1)
Doses of P (mg dm-3) ŷ= 3.18 + 0.0904x r2 = 0.96
(b)
85 88 91 94 97
0 40 80 120 160
T
ra
n
sp
o
rt
e
ff
ic
ie
n
c
y
(
%
)
Doses of P (mg dm-3) ŷ= 87.9+ 0.0455x r2 = 0.80
(c)
0 50 100 150 200 250 300
0 40 80 120 160
U
tiliz
a
tio
n
e
ff
ic
ie
n
c
y
(
g
m
g
-1)
Doses of P (mg dm-3) ŷ= 244 - 1.3118x r2 = 0.82
(d) 0
1 2 3 4
0 40 80 120 160
L
e
v
e
l
o
f
P
i
n
s
o
il
(
m
g
d
m
-3)
Doses of P (mg dm-3) ŷ = 0.14 + 0,.228x
r2 = 0.98
(a )
Averages do not differ by the F test (p < 0.01). T: cation exchange capacity at pH 7.0; m: aluminum saturation; V: base saturation.
Doses of P pH
(H2O)
K Ca Mg Al T m V
mg dm-3 mg dm-3 _______________________________ mmol c dm
-3 _______________________________ ___________ % ___________
0 5.1 50.0 6.9 0.60 0.11 1.52 7.5 34.5
20 5.6 46.3 6.7 0.50 0.06 1.33 4.0 37.5
40 5.5 23.5 6.8 0.49 0.06 1.29 4.5 33.0
80 5.0 35.0 7.2 0.66 0.12 1.59 7.5 33.0
160 5.1 27.5 7.1 0.65 0.17 1.59 10.0 28.5
CV (%) 4.9 27.8 9.8 15.20 22.40 8.20 24.9 9.5
Table 2. Chemical analysis of the Red-Yellow Dystrophic Latosol, at the end of the experiment.
Use efficiency (g mg
However, although there was an increase in the
P transport efficiency, a linear decrease was verified in the use efficiency of the same macronutrient, with
increased levels of P in the soil (Figure 6d). This behavior also highlights the importance of providing a balanced quantity of P, in order to have reasonably efficiency of absorption and transport, without
reducing the use efficiency of this nutrient.
It is evident that the greater nutrient accumulation, promoted by the higher growth of
pitaya, was affected by the nutritional efficiency. This is because the nutritional efficiency is linked to the absorption efficiency, which indicates the plant
ability to promote the extraction of nutrients from
the soil, as well as to use efficiency, which shows
the plant ability to convert absorbed nutrient into dry mass (Gerloff & Gabelman 1983, Rozane et al. 2007).
In this experiment, the application of 44-67 mg dm-3 of P to the soil promoted the highest
accumulation of macro and micronutrients in the pitaya roots and shoots. Moreover, with this P supply, the order of accumulation of nutrients by pitaya roots was: N > K > Ca > S > P > Mg > Fe > Mn > Zn >
B ≥ Cu. In the shoots, the sequence was: K > N > Ca > S > Mg > P > Mn > Fe > Zn > B ≥ Cu (Figures 2,
3, 4 and 5).
The amount of accumulated nutrients in pitaya can be attributed to absorption, which was affected by climate and soil conditions (nutrient availability and soil moisture) and genetic characteristics of the plant (morphological and physiological), as previously observed by Barbosa et al. (2003).
The highest accumulation of macro and micronutrients was obtained with levels of P available in the soil (2 mg dm-3) lower than those observed by
Corrêa et al. (2014), who reported satisfactory results of pitaya growth when there is 60-75 mg of P per dm3
of substrate. This difference may be explained by the execution time of the experiments, because Corrêa et al. (2014) evaluated the plants at six months after planting, and, at the current experiment, the pitayas and soil were evaluated at ten months after planting. Thus, in our study, the plants had more time to grow and absorb nutrients from the soil, justifying the lower values.
CONCLUSIONS
1. The initial growth of pitaya is maximum with 81 mg dm-3 of P, in a Red-Yellow Dystrophic Latosol.
2. The application of 44-67 mg dm3 of P to the soil
promotes the highest accumulation of macro and micronutrients in pitaya.
ACKNOWLEDGMENTS
The authors thank the Fundação de Amparo à Pesquisa do Estado de Minas Gerais (Fapemig), for the
financial support, and Coordenação de Aperfeiçoamento
de Pessoal de Nível Superior (Capes), for granting scholarships.
REFERENCES
ALVAREZ, V. H. V. et al. Interpretação dos resultados das análises de solos. In: RIBEIRO, A. C.; GUIMARÃES, P. T. G.; ALVAREZ, V. H. V. (Eds.). Recomendações para o
uso de corretivos e fertilizantes em Minas Gerais. Viçosa:
CFSEMG, 1999. p. 25-32.
AUGOSTINHO, L. M. D. et al. Acúmulo de massa seca e marcha de absorção de nutrientes em mudas de goiabeira ‘Pedro Sato’. Bragantia, v. 67, n. 3, p. 577-585, 2008.
BARBOSA, Z.; SOARES, I.; CRISÓSTOMO, L. A. Crescimento e absorção de nutrientes por mudas de gravioleira. Revista Brasileira de Fruticultura, v. 25, n. 3, p. 519-522, 2003.
BATAGLIA, O. C. et al. Métodos de análise química de
plantas. Campinas: Instituto Agronômico, 1983.
CORRÊA, F. L. O. et al. Acúmulo de nutrientes em mudas de aceroleira adubadas com fósforo e zinco. Revista
Brasileira de Fruticultura, v. 24, n. 3, p. 765-769, 2002.
CORRÊA, M. C. M. et al. Crescimento inicial de pitaia em função de combinações de doses de fósforo-zinco. Revista
Brasileira de Fruticultura, v. 36, n. 1, p. 261-270, 2014.
DECHEN, A. R.; NACHTIGALL, G. R. Elementos requeridos à nutrição de plantas. In: NOVAIS, R. F. et al (Eds.). Fertilidade do solo. Viçosa: SBCS, 2007. p. 91-132.
E M P R E S A B R A S I L E I R A D E P E S Q U I S A AGROPECUÁRIA (Embrapa). Centro Nacional de Pesquisa de Solos. Manual de métodos de análise do solo. Brasília, DF: Embrapa, 1997.
GERLOFF, G. C.; GABELMAN, W. H. Genetic basis of inorganic plant nutrition. In: LAÜCHLI, A.; BIELESKI, R. L. (Eds.). Encyclopedia of plant physiology. Berlin: Springer-Verlag, 1983. p. 453-486.
LI, B.; MCKEAND, S. E.; ALLEN, H. L. Genetic variation
in nitrogen use efficiency of loblolly pine seedlings. Forest
LÓPEZ-BUCIO, J. et al. Phosphate availability alters architecture and cause changes in hormone sensitivity in the Arabidopsis root system. Plant Physiology, v. 129, n. 1, p. 244-256, 2002.
ORTIZ-HERNÁNDEZ, Y. D.; CARRILLO-SALAZAR, J. A. Pitahaya (Hylocereus spp.): a short review. Comunicata
Scientiae, v. 3, n. 4, p. 220-237, 2012.
PEGORARO, R. F. et al. Macronutrient uptake, accumulation and export by the irrigated ‘Vitória’ pineapple plant. Revista Brasileira de Ciência do Solo, v. 38, n. 3, p. 896-904, 2014.
PRADO, R. M.; VALE, D. W.; ROMUALDO, L. M. Fósforo na nutrição e produção de mudas de maracujazeiro.
Acta Scientiarum Agronomy, v. 27, n. 3, p. 493-498, 2005.
ROZANE, D. E. et al. Eficiência de absorção, transporte
e utilização de macronutrientes por porta-enxertos de caramboleira, cultivados em soluções nutritivas. Ciência
e Agrotecnologia, v. 31, n. 4, p. 1020-1026, 2007.
SANTOS, H. G. et al. Sistema brasileiro de classificação
de solos. 3. ed. Brasília, DF: Embrapa, 2013.
SIDDIQI, M. Y.; GLASS, A. D. M. Utilization index: a
modified approach to the estimation and comparison of
nutrient efficiency in plants. Journal of Plant Nutrition,
v. 4, n. 3, p. 289-302, 1981.
SILVA, J. T. A.; SILVA, I. P.; PEREIRA, R. D. Adubação fosfatada em mudas de bananeira ‘Prata Anã’(AAB), cultivadas em dois latossolos. Revista Ceres, v. 58, n. 2, p. 238-242, 2011.
SKREBSKY, E. C. et al. Caracterização das exigências nutricionais de plantas de Paffia glomerata em Argissolo
Vermelho distrófico arênico pela técnica do nutriente
faltante. Ciência Rural, v. 38, n. 4, p. 989-996, 2008.
SWIADER, J. M.; CHYAN, Y.; FREIJI, F. G. Genotypic
differences in nitrate uptake and utilization efficiency in
pumpkin hybrids. Journal of Plant Nutrition, v. 17, n. 10, p. 1687-1699, 1994.