Correlation and path analysis of agronomic and morphological traits
in maize
1Correlação e análise de trilha de caracteres agronômicos e morfológicos em milho
Tallyta Nayara Silva2*, Gustavo Vitti Moro3, Fabíola Vitti Moro4, Durvalina Maria Mathias dos Santos4 and Rodolfo Buzinaro5
ABSTRACT - The efficiency of selection can be broadened for certain traits using estimative of genetic parameters, which are fundamental for plant breeding. The estimative of genetic parameters allows identifying the nature of the action of genes involved in the control of quantitative traits and evaluates the efficiency of different breeding strategies to obtain genetic gains. Therefore, this study aimed to verify the variability and correlation between morphological and agronomic traits in synthetic maize populations, in order to practice indirect selection. Thirteen populations were evaluated in field experiments at Jaboticabal-SP and Campo Alegre de Goiás-GO, using randomized block design, for lodging (LOD), culm breakage (CB), plant height (PH), ear height (EH) and grain yield (GY). The 13 populations were also sown in 1 kg-plastic bags under black shade cloth, using a randomized complete block design with nine replications, for evaluation of the morphological traits: main root length (MRL), root fresh matter (RFM), root dry matter (RDM), average root diameter (ARD), root surface area (RSA), root tissue density (RTD) and shoots dry matter (SDM). The trait GY exhibited genetic variability enough to be effective if used for selection. The selection on the morphological traits is indicated on RDM, due to the ease in obtaining data and its accuracy, high correlation with all morphological traits and association with GY. The simultaneous selection based on RFM and RDM, for gains in GY, can be performed. The highest direct effect on GY was identified in LOD and CB, being indicated for indirect selection.
Key words:Zea mays. Phenotypic correlation. Genetic parameters. Direct selection.
RESUMO- A eficiência de seleção pode ser ampliada para determinado caráter utilizando-se estimativas de parâmetros genéticos, as
quais são fundamentais no melhoramento de plantas, uma vez que permitem identificar a natureza da ação dos genes envolvidos no controle de caracteres quantitativos e avaliar a eficiência de diferentes estratégias de melhoramento para a obtenção de ganhos genéticos. Assim, objetivou-se verificar a existência de variabilidade e correlação entre caracteres agronômicos e morfológicos em populações sintéticas de milho, visando seleção indireta. Foram utilizadas 13 populações, avaliadas em experimentos de campo em Jaboticabal-SP e Campo Alegre de Goiás-GO, utilizando-se o delineamento em blocos casualizados, para acamamento (AC), quebramento de colmos (QUE), altura de plantas (AP), altura de espiga (AE), e produção de grãos (PG). As 13 populações também foram semeadas em sacos plásticos de 1 kg sob sombrite, utilizando-se delineamento em blocos casualizados com nove repetições, para avaliação das seguintes características morfológicas: comprimento da raiz principal (CR), matéria fresca de raiz (MFR), matéria seca de raiz (MSR), diâmetro médio de raiz (DMR), área de superfície da raiz (ASR), densidade de tecido radicular (DTR) e matéria seca da parte aérea (MSPA). O caráter PG apresentou grande variabilidade genética, indicando ser eficiente se utilizado para seleção. A seleção sobre os caracteres morfológicos é mais indicada sobre MSR, devido à facilidade e precisão na obtenção dos dados, alta correlação com todos os outros caracteres morfológicos e sua associação com PG. A seleção simultânea com base em MFR e MSR, para ganhos na PG, pode ser realizada. Os caracteres AC e QUE são os que apresentam maior efeito direto sobre a PG, sendo indicados para seleção indireta.
Palavras-chave:Zea mays. Correlação fenotípica. Parâmetros genéticos. Seleção direta.
DOI: 10.5935/1806-6690.20160041 *Autor para correspondência
1Recebido para publicação em 28/10/2014; aprovado em 05/11/2015
Parte da Dissertação de Mestrado do primeiro autor apresentada ao Programa de Pós-Graduação em Agronomia/Genética e Melhoramento de Plantas/ Universidade Estadual Paulista “Júlio de Mesquita Filho”/FCAV/UNESP
2Programa de Pós-Graduação em Agronomia, Departamento de Agronomia, University of Florida, Gainesville-FL, EUA, tallyta@ufl.edu
3Departamento de Produção Vegetal, Universidade Estadual Paulista “Júlio de Mesquita Filho”/FCAV/UNESP, Jaboticabal-SP, Brasil, gvmoro@fcav.unesp.br 4Departamento de Biologia Aplicada à Agropecuária, Universidade Estadual Paulista “Júlio de Mesquita Filho”/FCAV/UNESP, Jaboticabal-SP,
Brasil, fabiola@fcav.unesp.br, dumaria@fcav.unesp.br
5Programa de Pós-Graduação em Agronomia/Genética e Melhoramento de Plantas, Universidade Estadual Paulista “Júlio de Mesquita Filho”/
INTRODUCTION
High yields are directly related to the biggest depths explored by the plant root system (KOFFLER, 1986), which makes information about the root system of maize genotypes and their possible relationship with the shoots, of great interest in maize breeding programs. More developed root systems should be more efficient in absorbing nutrients and water from the soil and, thus, influence the yield, besides of ensuring proper formation and anchorage of the plant shoots.
Furthermore, the use of methods for indirect selection of root traits or early evaluation, i.e., before flowering, is also interesting. These methods accelerate the process of selection, immediately discarding undesirable genotypes, which enables focus resources on those potentially superiors (FRITSCHE-NETOet al., 2010). The selection of traits easy to measure and identify, strongly correlated with the desired parameter and with high heritability, allows the breeder to achieve greater progress and in the shortest time (CRUZ; CARNEIRO, 2006).
The efficiency of selection can be broadened for certain trait using estimates of genetic parameters, which are fundamental in the plant breeding, since they allow identifying the nature of the action of genes involved in the control of quantitative traits and evaluate the efficiency of different breeding strategies to obtain genetic gains (CRUZ; CARNEIRO, 2006). The estimates of genetic parameters as variances, coefficients of variation, heritability, genotypic, phenotypic and environmental correlations, allow knowing the magnitude of the genetic variability of a population, and the selection gains.
According to Hallauer and Miranda Filho (1988) the correlation estimated by the specific coefficient is important in plant breeding because it quantifies the degree of genetic and non-genetic association between two or more traits, allowing the indirect selection. Cruz and Regazzi (1997) also highlighted the importance of correlations, stating that these associations quantify the possibility of indirect selection gains in correlated traits.
Studies of the relationship among traits, through correlation coefficients, are important to the early selection of plants or inbred lines, or to the simultaneous selection when more than one trait is desired. That is because the indirect selection based on correlated response, by means of less complex characters with high heritability and easy evaluation, may result in higher genetic progress if compared to the use of direct selection (KUREKet al., 2001).
As the study of the correlations among traits does not consider the cause / effect relationships between primary and secondary traits, determinants of yield, the
method called path analysis was developed, and consists in studying the direct and indirect effects of traits on a basic variable (CRUZ; CARNEIRO, 2006). The path analysis provides a detailed understanding of the influences of the traits involved in a predetermined diagram and justifies the existence of positive and negative correlations, high and low magnitudes among the studied traits (SILVAet al., 2005). The correlations of cause and effect with grain yield, particularly for maize, are important tools to assist breeders in defining priority traits for the selection, and the relationship among them, such that allow choosing which genetic changes should be done to increase the yield.
Therefore, this work aimed to verify the existence of variability and correlation between morphological and agronomic traits in synthetic maize populations, in order to practice indirect selection.
MATERIAL AND METHODS
In 2009/2010 regular season crop and 2010 off-season crop, 13 synthetic populations of the FCAV/ UNESP maize breeding program were evaluated in field experiments, carried out at Jaboticabal-SP, and at Campo Alegre de Goiás-GO. Each combination location x sowing date was considered a distinct environment (Jaboticabal - regular and off-season crop, and Campo Alegre de Goiás - off-season crop), with three replications in each environment. Each replication of each environment was considered an observation, making up nine observations.
The experimental design was a randomized block design, and the plots consisted of four rows, 5-m long, spaced 0.90 m between rows and 0.20 m between plants. The two central rows were considered as useful area.
The agronomic traits evaluated were lodging (LOD, given by the number of inclined plants below 45° or fallen in the plot at the harvest), culm breakage (CB, given by the number of plants with broken culm below the main ear in the plot at the harvest), plant height (PH, in cm, obtained from the soil to the insertion of the flag leaf), ear height (EH, in cm, obtained from the soil to the insertion of the main ear) and grain yield (GY, in t ha-1, corrected to 13% of moisture content).
average root diameter (ARD, in mm), root surface area (RSA, in mm2) root tissue density (RTD, in mm mL-1)
and shoots dry matter (SDM, in g).
Twenty days after sowing, when the seedlings exhibited four developed leaves, the root samples were washed in running water over a sieve, maintained in aqueous solution of 20% alcohol and taken to the refrigerator at 4 °C until the evaluation. Each sample was spread in a 1 cm layer of water in transparent trays and imaged with a scanner. The determination of MRL, ARD and RSA was done by the image processing software Delta-T Devices, using a 400 dpi definition. The RTD was calculated as main root length per substrate volume in each unit, and roots and shoots were dried in a forced-air drying oven at 65 °C, for 120 h, to obtain RDM and SDM.
Individual analysis of variance was performed for each trait, considering the effects of populations as fixed. The estimates of genotypic and phenotypic correlation between agronomic and morphological traits were obtained, tested at 1% and 5% probability by the t test. The correlations between the 10 traits and grain yield (dependent variable) were deployed in direct and indirect effects through path analysis, establishing relationships of cause and effect among the traits as described in the literature.
All analyzes were performed using the software GENES (CRUZ, 2006). The assumptions for the analysis of variance have been met. For the parameters it did not occur, the transformation of data was performed.
RESULTS AND DISCUSSION
It was not detected significant genotype x environment interaction in the joint analysis of variance of the agronomic traits (data not shown), so the three replications of each environment were considered as nine observations.
The individual analysis of variance presented significant differences (p 0.01) among populations regarding the agronomic traits of LOD, CB, PH, EH and GY, and morphological traits of RFM, RDM, RSA, MRL, RTD and SDM (Table 1). The trait ARD did not present significant difference among the populations, and was eliminated from the estimates of parameters and path analysis.
The high CVs observed for morphological traits are within the acceptable limits for such traits. This is due to the difficulty in obtaining the samples, which has large influence of the handling, leading to increase in the environmental variance. The CV values of RDM and SDM are consistent with those identified by Gondimet al. (2010), of 25.6% and 24.3%, respectively.
For the traits RSA, ARD and MRL, Bergamin et al.
(2010) found CVs of 38.59%; 10.35% and 37.39%, respectively, similar to those observed in this study.
Genotypic quadratic component values higher than the environmental variance at mean level values indicated the existence of genetic variability for all traits
DF Agronomic traits
LOD CB PH EH GY
Blocks 8 1.35 44.18 3704.42 970.06 10.73
Populations 12 5.28** 4.27** 946.85** 845.68** 3.76**
Error 96 1.08 1.36 117.01 112.13 0.21
Means 4.69 14.38 206.51 118.20 3.97
CV (%) 54.15 36.26 5.24 8.96 11.64
DF Morphological traits
RFM RDM RSA ARD MRL RTD SDM
Blocks 8 0.27 0.0003 244193 0.0023 1431977 0.92 0.0044
Populations 12 0.61** 0.0006** 628826** 0.0051ns 3481403** 4.1** 0.0065**
Error 96 0.13 0.0002 195252 0.0028 1004555 1.18 0.0015
Means 1.04 0.0393 1089.24 0.428 2561.68 2.63 0.1135
CV (%) 35.21 33.20 40.57 12.36 39.13 41.23 33.82
Table 1 - Values and significances of mean squares, mean value and coefficient of variation for the 11 traits evaluated in 13 maize populations
LOD: lodging, CB: culm breakage, PH: plant height in cm, EH: ear height in cm, GY: grain yield in t ha-1, RFM: root fresh matter in g, RDM: root dry
matter in g, RSA: root surface area in mm2, ARD: average root diameter in mm, MRL: main root length in mm, RTD: root tissue density in mm mL-1,
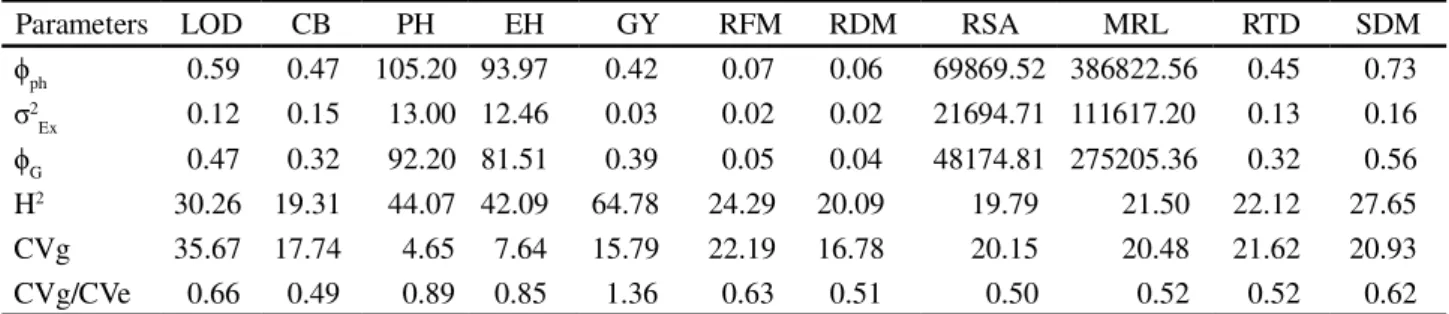
analyzed. Genotypic determination coefficients (Table 2) ranged from 19.31% to 64.78% for the agronomic traits, and 19.79% to 27.65% for morphological ones, revealing that selection can be performed, with greater possibility of success, for grain yield, which reached genotypic determination coefficient of 64.78%. The morphological traits showed low genotypic determination coefficients, as reported by Mehdi and Ahsan (2000), who found values of 25.08% and 25.49% for the traits RFM and SDM, respectively.
For maize, in the Brazilian conditions, CVg values above 7% are considered good indicators of the germplasm genetic potential for breeding (RODRIGUESet al., 2011). So for the traits considered, both as agronomic as morphological, except for PH, it was possible to detect genetic variation potential for selection (Table 2). The CVg for PH and EH, of 4.65% and 7.64%, respectively, although low regarding the other traits, are in agreement with the values obtained
by Rovaris et al. (2011), of 3.02% and 4.40%. The
magnitudes of CVg found for the morphological traits RFM, RDM and SDM are similar to those reported by Mehdi and Ahsan (2000), which reinforces the potential of these traits for selection.
Considering the ratio CVg/CVe, the trait is preferable for selection when it is greater than 1 (VENCOVSKY, 1987), and has high genotypic quadratic component, which indicate more favorable situation for selection only in GY in this study.
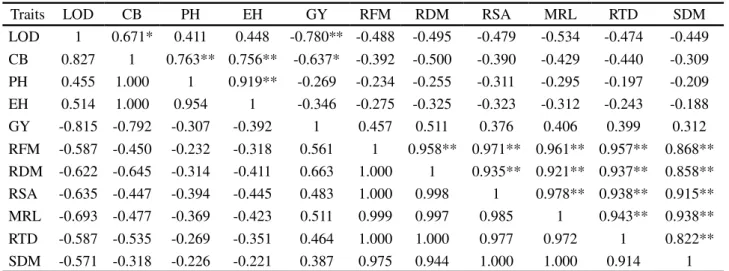
To facilitate the selection of promising genotypes, the estimates of coefficients of correlation are used. In this study, phenotypic and genotypic correlations (Table 3) with the same sign and similar magnitudes were observed, which suggests reliability to use the phenotypic correlations for data interpretation.
Table 2 - Estimates of phenotypic quadratic components ( ph), environmental variance components at mean level ( 2
Ex), genotypic quadratic components ( G), genotypic determination coefficients (H2), coefficients of genetic variation (CV
g) and ratio between coefficients of genetic and environmental variation (CVg/CVe) of the 11 traits evaluated in the 13 maize populations
LOD: lodging, CB: culm breakage, PH: plant height in cm, EH: ear height in cm, GY: grain yield in t ha-1, RFM: root fresh matter in g, RDM:
root dry matter in g, RSA: root surface area in mm2, ARD: average root diameter in mm, MRL: main root length in mm, RTD: root tissue
density in mm mL-1, SDM: shoots dry matter in g
Although the coefficients of genotypic correlation are higher than the coefficients of phenotypic correlations, evidencing greater contribution of genetic factors, the values found for genotypic correlations may be overestimated, since it comes from indirect calculations from components of variance and
covariance (ESPÓSITOet al., 2012).
According to Lopeset al. (2002), there is a tendency among plant breeders to focus more on the sign (positive or negative) and magnitude of the values in the applied interpretation of the correlations than in the significance of them, valuing thus correlations estimates above ±0.5.
The correlation between PH and EH was high and positive, as reported in the literature. Carpici and Celik (2010) identified correlation coefficient of 0.847 between these traits and Cancellier et al. (2011) reported values of 0.829. Regarding the GY, only LOD and CB had high correlations, pointing out that the selection of plants with lower incidence of LOD and CB may result in more productive plants. Although PH presented low correlation, the values and signs corroborate with those
reported by Paziani et al. (2009) and Sreckov et al.
(2011). The correlation between PH and CB was positive and high, which was expected because of low stature cultivars are characterized by having greater resistance to culm breakage. Magalhães, Duraes and Oliveira (1998) observed in their study that the tallest plants were obtained in materials likely to culm breakage, which confirms the high correlation between these traits.
Among the morphological traits, there was high, positive and significant correlation among all combinations of traits (Table 3). So, the trait RDM, which has high correlation with all morphological traits, is preferable for selection because of the savings in time and labor in the measurements, besides of its accuracy. Furthermore,
Parameters LOD CB PH EH GY RFM RDM RSA MRL RTD SDM
ph 0.59 0.47 105.20 93.97 0.42 0.07 0.06 69869.52 386822.56 0.45 0.73
2
Ex 0.12 0.15 13.00 12.46 0.03 0.02 0.02 21694.71 111617.20 0.13 0.16
G 0.47 0.32 92.20 81.51 0.39 0.05 0.04 48174.81 275205.36 0.32 0.56
H2 30.26 19.31 44.07 42.09 64.78 24.29 20.09 19.79 21.50 22.12 27.65
CVg 35.67 17.74 4.65 7.64 15.79 22.19 16.78 20.15 20.48 21.62 20.93
Table 3 -Estimates of phenotypic correlations (above the diagonal) and genotypic correlations (below the diagonal) among the variables studied, obtained of 13 maize populations
LOD: lodging; CB: culm breakage; PH: plant height in cm; EH: ear height in cm; GY: grain yield in t ha-1; RFM: root fresh matter in g; RDM: root dry
matter in g; RSA: root surface area in mm2; MRL: main root length in mm; RTD: root tissue density in mm mL-1; SDM: shoots dry matter in g;** and *
Significant at 1 and 5%, respectively, byttest
Traits LOD CB PH EH GY RFM RDM RSA MRL RTD SDM
LOD 1 0.671* 0.411 0.448 -0.780** -0.488 -0.495 -0.479 -0.534 -0.474 -0.449
CB 0.827 1 0.763** 0.756** -0.637* -0.392 -0.500 -0.390 -0.429 -0.440 -0.309
PH 0.455 1.000 1 0.919** -0.269 -0.234 -0.255 -0.311 -0.295 -0.197 -0.209
EH 0.514 1.000 0.954 1 -0.346 -0.275 -0.325 -0.323 -0.312 -0.243 -0.188
GY -0.815 -0.792 -0.307 -0.392 1 0.457 0.511 0.376 0.406 0.399 0.312
RFM -0.587 -0.450 -0.232 -0.318 0.561 1 0.958** 0.971** 0.961** 0.957** 0.868**
RDM -0.622 -0.645 -0.314 -0.411 0.663 1.000 1 0.935** 0.921** 0.937** 0.858**
RSA -0.635 -0.447 -0.394 -0.445 0.483 1.000 0.998 1 0.978** 0.938** 0.915**
MRL -0.693 -0.477 -0.369 -0.423 0.511 0.999 0.997 0.985 1 0.943** 0.938**
RTD -0.587 -0.535 -0.269 -0.351 0.464 1.000 1.000 0.977 0.972 1 0.822**
SDM -0.571 -0.318 -0.226 -0.221 0.387 0.975 0.944 1.000 1.000 0.914 1
the trait RDM presented correlation of 0.511 with GY, indicating possibility of gains also in this agronomic trait. Concerning the correlation between RDM and SDM, the high magnitude found (0.858) is probably due to the close association of both parties, since problems in the supply of carbohydrates (by decreasing its availability or transport) to the roots result in nutritional problems for the development of the plant root system (WINKLER, 2006), as an example.
Except the correlations that include the GY, all correlations between agronomic and morphological traits were negative (Table 3). This indicates that the simultaneous selection of plants with roots with greater fresh matter, dry matter, surface area, length, tissue density, besides of greater shoots dry matter, would result in low stature plants, with lower ear height, lower incidence of lodging and culm breakage, and consequently, would cause increase in grain yield. However, overall, the magnitudes of simple correlation between morphological and agronomic traits were low, precluding indirect selection for gains in GY.
The correlation between RFM and RDM with GY (0.457 and 0.511, respectively), although not significant, were the highest values among the positive correlations between morphological and agronomic traits, which suggests their use in selection indexes. For maize, an ideotype root architecture for efficient nitrogen acquisition has deeper roots (MIet al., 2010), consequently resulting in higher dry matter. So, the higher the dry matter, the higher is the nitrogen acquisition, which maximizes grain yield, explaining the correlation identified in this study.
There was negative correlation between MRL and LOD (-0.534), indicating that the selection of plants with greater MRL may decrease the occurrence of LOD at the end of the crop cycle.
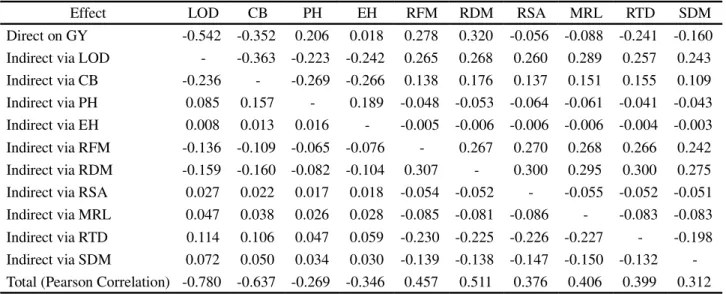
In path analysis, high degree of multicollinearity among the traits in the phenotypic correlation matrix of explanatory variables was detected (MONTGOMERY; PECK, 1982). Therefore, the methodology called ridge path analysis, which suggests path analysis with collinearity without needing to eliminate variables, was used to estimate the parameters. The result of the path analysis of GY with the explanatory variables is shown in Table 4, with k value of 0.11.
The coefficient of determination (R2) of path analysis
model was equal to 0.67, characterizing that 67% of the variation in the dependent variable GY in the model is explained by the variables used in the causal diagram. The direct effects of the variables analyzed were inferior to the residual variable effect (0.57), indicating that the variables analyzed in this study are not the main determinants of GY, although they have influence on this trait.
The selection of plants with higher RFM and RDM has representative direct effect on the increase of the GY. Moreover, the effects of all traits on the GY occur indirectly through these two traits. In rice, Mohankumaret al. (2011) showed that RDM has direct positive effect on grain yield. In studies based on canonical correlation in rice as well, Toorchi, Shashidhar and Sridhara (2006) and Kanbar, Toorchi and Shashidhar (2009) suggested that maximum RDM conferred advantage to GY. This reinforces the potential of selection of high RDM for gains in GY.
In breeding programs, the discard of the traits of lower direct effect is important for an efficient indirect selection, so the traits RSA, MRL and EH were not appropriated for indirect selection, since they have low direct effects on GY (-0.056; -0088; 0018, respectively).
However, the initial results obtained in this study require further tests in a wide number of genotypes to represent the maize crop.
CONCLUSIONS
1. According to the genetic parameters, the trait grain yield exhibited genetic variability enough to be effective if used for selection;
2. The selection on the morphological traits is indicated on root dry matter, due to the ease in obtaining data and its accuracy, high correlation with all morphological traits and association with grain yield;
Table 4 - Estimates of direct and indirect effects of the traits lodging (LOD), culm breakage (CB), plant height (PH), ear height (EH), root fresh matter (RFM), root dry matter (RDM), root surface area (RSA), main root length (MRL), root tissue density (RTD) and shoots dry matter (SDM) on the trait grain yield (GY)
3. Simultaneous selection based on root fresh matter and root dry matter for gains in grain yield may be carried out, since they present moderate simple correlation and influence it positively by indirect pathways; 4. The agronomic traits lodging and culm breakage are
those with highest direct effect on grain yield, being indicated for indirect selection for this trait.
ACKNOWLEDGMENTS
To the Coordenação de Aperfeiçoamento de Pessoal de Nível Superior (CAPES), for financial support.
REFERENCES
AKBAR, M.et al. Evaluation of maize 3-way crosses through
genetic variability, broad sense heritability, characters association and path analysis. Journal of Agriculture Research, v. 46, n. 1, p. 39-45, 2008.
BERGAMIN, A. C. et al. Compactação em um latossolo vermelho distroférrico e suas relações com o crescimento radicular do milho.Revista Brasileira de Ciência do Solo, v. 34, p. 681-691, 2010.
CANCELLIER, L. L.et al. Potencial forrageiro de populações de milho no sul do estado de Tocantins. Bioscience Journal, v. 27, n. 1, p. 77-87, 2011.
Effect LOD CB PH EH RFM RDM RSA MRL RTD SDM
Direct on GY -0.542 -0.352 0.206 0.018 0.278 0.320 -0.056 -0.088 -0.241 -0.160
Indirect via LOD - -0.363 -0.223 -0.242 0.265 0.268 0.260 0.289 0.257 0.243
Indirect via CB -0.236 - -0.269 -0.266 0.138 0.176 0.137 0.151 0.155 0.109
Indirect via PH 0.085 0.157 - 0.189 -0.048 -0.053 -0.064 -0.061 -0.041 -0.043
Indirect via EH 0.008 0.013 0.016 - -0.005 -0.006 -0.006 -0.006 -0.004 -0.003
Indirect via RFM -0.136 -0.109 -0.065 -0.076 - 0.267 0.270 0.268 0.266 0.242
Indirect via RDM -0.159 -0.160 -0.082 -0.104 0.307 - 0.300 0.295 0.300 0.275
Indirect via RSA 0.027 0.022 0.017 0.018 -0.054 -0.052 - -0.055 -0.052 -0.051
Indirect via MRL 0.047 0.038 0.026 0.028 -0.085 -0.081 -0.086 - -0.083 -0.083
Indirect via RTD 0.114 0.106 0.047 0.059 -0.230 -0.225 -0.226 -0.227 - -0.198
Indirect via SDM 0.072 0.050 0.034 0.030 -0.139 -0.138 -0.147 -0.150 -0.132
-Total (Pearson Correlation) -0.780 -0.637 -0.269 -0.346 0.457 0.511 0.376 0.406 0.399 0.312
CARPICI, E. B.; CELIK, N. Determining possible relationships between yield and yield-related components in forage maize (Zea mays L.) using correlation and path analyses. Notulae Botanicae Horti Agrobotanici Cluj-Napoca, v. 38, n. 3, p.
280-285, 2010.
CRUZ, C. D. Programa genes: biometria. Viçosa, MG: Editora UFV, 2006. 382 p. 2006.
CRUZ, C. D.; CARNEIRO, P. C. S.Modelos biométricos aplicados ao melhoramento genético. 2.ed.. Viçosa, MG: Editora UFV, 2006. v. 2, 585 p.
CRUZ, C. D.; REGAZZI, A. J. Modelos biométricos aplicados ao melhoramento genético. Viçosa, MG: Editora da UFV, 1997. 390 p.
ESPÓSITO, D. P. et al. Análise de trilha usando valores
fenotípicos e genotípicos para componentes do rendimento na seleção de famílias de cana-de-açúcar.Ciência Rural, v. 42, n. 1, p. 38-44, 2012.
FRITSCHE-NETO, R.et al. Herança de caracteres associados
à eficiência de utilização do fósforo em milho. Pesquisa Agropecuária Brasileira, v. 45, n. 5, p. 465-471, 2010. GONDIM, A. R. O.et al. Eficiência nutricional do milho cv.
BRS 1030 submetido à omissão de macronutrientes em solução nutritiva.Revista Ceres, v. 57, n. 4, p. 539-544, 2010. HALLAUER, A. R.; MIRANDA FILHO, J. B.Quantitative genetics in maize breeding. 2nd ed. Ames, Iowa: Iowa State University Press, 1988. 468 p.
KANBAR, A.; TOORCHI, M.; SHASHIDHAR, H. E. Relationship between yield and root morphological characters in rainfed lowland rice (Oryza sativa L).Cereal Research Communications, v. 37, n. 2, p. 261-268, 2009.
KOFFLER, N. F. A profundidade do sistema radicular e o suprimento de água às plantas no Cerrado. Piracicaba:
POTAFOS, 1986. 12 p. (Informações Agronômicas, 33). KUREK, A. J. et al. Análise de trilha como critério de seleção indireta para rendimento de grãos em feijão.Revista Brasileira de Agrociência, v. 7, n. 1, p. 29-32, 2001. LOPES, A. C. A. et al. Variabilidade e correlações entre
caracteres em cruzamentos de soja.Scientia Agrícola, v. 59, n. 2, p. 341-348, 2002.
MAGALHÃES, P. C.; DURAES, F. O. M.; OLIVEIRA, A. C. Efeitos do quebramento do colmo no rendimento de grãos
de milho.Ciência e Agrotecnologia, v. 22, n. 3, p. 279-289, 1998.
MEHDI, S. S.; AHSAN, M. Genetic coefficient of variation, relative expected genetic advance and inter-relationships in maize (Zea mays L.) for green fodder purposes at seedling
stage. Pakistan Journal of Biological Sciences, v. 3, n. 11, p. 1890-1891, 2000.
MI, G. H.et al. Ideotype root architecture for efficient nitrogen
acquisition by maize in intensive cropping systems. Science China Life Sciences, v. 53, n. 12, p. 1369-1373, 2010.
MOHANKUMAR, M. V.et al. Correlation and path analysis
of drought tolerance traits on grain yield in rice germplasm accessions.ARPN Journal of Agricultural and Biological Science, v. 6, n. 7, p. 70-77, 2011.
MONTGOMERY, D. C.; PECK, E. A. Introduction to linear regression analysis. New York: John Wiley e Sons, 1982. 504 p. PAZIANI, S. F. et al. Características agronômicas e
bromatológicas de híbridos de milho para produção de silagem.
Revista Brasileira de Zootecnia, v. 38, n. 3, p. 411-417, 2009.
RODRIGUES, F. et al. Índice de seleção e estimativa de parâmetros genéticos e fenotípicos para características relacionadas com a produção de milho-verde. Ciência e Agrotecnologia, v. 35, n. 2, p. 278-286, 2011.
ROVARIS, S. R. S.et al. Estimates of genetic parameter in
maize commercial variety IPR 114 at Paraná State, Brazil.
Acta Scientiarum. Agronomy, v. 33, n. 4, p. 621-625, 2011. SILVA, S. A. et al. Análise de trilha para os componentes de
rendimento de grãos em trigo.Bragantia, v. 64, n. 2, p. 191-196, 2005.
SRECKOV, Z. et al. Correlation and path analysis of grain
yield and morphological traits in test–cross populations of maize. Pakistan Journal of Botany, v. 43, n. 3, p.
1729-1731, 2011.
TOORCHI, M.; SHASHIDHAR, H. E.; SRIDHARA, H. Influence of the root system on grain yield and related traits in rainfed lowland rice (Oryza sativa L.).Pakistan Journal of Biological Sciences, v. 9, n. 12, p. 2267–2272, 2006.
VENCOVSKY, R. Herança quantitativa. In: PATERNIANI,