DETERMINATION OF HYDRAULIC PROPERTIES OF A
TROPICAL SOIL OF HAWAII USING COLUMN
EXPERIMENTS AND INVERSE MODELING
(1)Martina Sobotkova(2), Michal Snehota(2), Michal Dohnal(2) & Chittaranjan Ray(3)
SUMMARY
A method for determining soil hydraulic properties of a weathered tropical soil (Oxisol) using a medium-sized column with undisturbed soil is presented. The method was used to determine fitting parameters of the water retention curve and hydraulic conductivity functions of a soil column in support of a pesticide leaching study. The soil column was extracted from a continuously-used research plot in Central Oahu (Hawaii, USA) and its internal structure was examined by computed tomography. The experiment was based on tension infiltration into the soil column with free outflow at the lower end. Water flow through the soil core was mathematically modeled using a computer code that numerically solves the one-dimensional Richards equation. Measured soil hydraulic parameters were used for direct simulation, and the retention and soil hydraulic parameters were estimated by inverse modeling. The inverse modeling produced very good agreement between model outputs and measured flux and pressure head data for the relatively homogeneous column. The moisture content at a given pressure from the retention curve measured directly in small soil samples was lower than that obtained through parameter optimization based on experiments using a medium-sized undisturbed soil column.
Index terms: automated apparatus, infiltration experiment, retention curve, hydraulic conductivity, Oxisol; structured soil.
(1) Received for publication in July 28, 2010 and approved in May 20, 2011.
(2) Czech Technical University in Prague, Faculty of Civil Engineering, Thakurova 7, 166 29, Prague 6, Czech Republic. E-mail:
michal.snehota@fsv.cvut.cz
(3) University of Hawaii at Manoa, Department of Civil & Environmental Engineering and Water Resources Research Center,
RESUMO: DETERMINAÇÃO DAS PROPRIEDADES HIDRÁULICAS DE UM SOLO TROPICAL DE HAVAÍ COM UM EXPERIMENTO INFILTRAÇÃO E MODELAGEM INVERSA
É apresentado neste estudo um método para determinar as propriedades hidráulicas de um solo tropical (um Oxisol) utilizando uma coluna de tamanho médio e amostras não amolgadas desse solo. O método foi utilizado para determinar parâmetros de ajuste da curva de retenção de água e funções de condutividade hidráulica em uma coluna de solo para um estudo da mobilidade de pesticidas nesses solos. A coluna de solo foi extraída de um sítio utilizado para pesquisa na região central de Oahu (Havaí, EUA), e sua estrutura interna foi examinada por meio de tomografia computadorizada de raios X. O experimento baseia-se na infiltração sob sucção em uma coluna de solo com saída livre na extremidade oposta. O fluxo de água foi simulado por um programa de computador que resolve a equação de Richards em uma dimensão. A simulação direta foi realizada usando parâmetros hidráulicos medidos, e os parâmetros da curva de retenção e condutividade hidráulica foram estimados por modelagem inversa. O procedimento de modelagem inversa produziu bom ajuste entre os resultados da análise numérica e valores de carga de pressão para a coluna homogênea de solo. Valores de umidade para uma dada pressão, adquiridos de uma curva de retenção determinada em amostras de pequenas dimensões, mostraram-se menores que aqueles obtidos por meio da otimização de parâmetros dos ensaios realizados em colunas de dimensão média.
Termos de indexação: aparato automatizado, experimento de infiltração, curva de retenção, condutividade hidráulica, Oxisol, solo estruturado.
INTRODUCTION
In the mid 1970s, nematicides were detected in the principal drinking water aquifer on Oahu, Hawaii, USA. Despite a subsequent ban on their use, concentrations of these chemicals remain near peak levels to this day. Concerns about pesticide leaching through the extensive (up to 300 m deep) vadose zone to groundwater motivated state officials to implement an evaluation program of the fate and transport of newly-registered pesticides in Hawaii. Accurate predictions of flow and contaminant transport through the vadose zone require in-depth knowledge of soil hydraulic properties, specifically of the functions of
hydraulic conductivity K(h) and the soil water
retention θ(h).
Direct measurements of water retention curves using sand tables and pressure plate extractors (Klute, 1986) are time-consuming, as equilibrium must be achieved at each step. This is especially true in the case of the fine-grained weathered soils as typical of tropical regions. The retention curves based on equilibrium experiments describe water-soil dynamics under transient conditions unsatisfactorily. Vachaud et al. (1972) showed that the retention curves measured in equilibrium and dynamic drainage experiments differed. In dynamic column experiments of infiltration-outflow processes it is possible to mimic a particular hydrological process of interest (e.g. infiltration), and in combination with inverse modeling this can be used to estimate soil hydraulic properties. Over the last two to three decades, several field and laboratory methods were developed to evaluate
top and free outflow at the bottom was presented by Snehota et al. (2002, 2008).
Tropical soils have some unique properties. Yamamoto (1963) reported that many soils from Hawaii are finely textured and composed of aggregated clay and colloidal particles. The average particle density is 2.86 g cm-3 and bulk density usually low
(around 1.0 g cm-3), indicating high porosity of most
surface soils. Studies on hydraulic properties of Hawaiian soils are limited to a few research reports (Green & Guernsey, 1981; Green et al., 1982; Gavenda et al., 1996). However, a number of studies have investigated Oxisols in other parts of the world. Larson & Padilla (1990) studied the relation between clay mineralogical composition and bulk density, water retention, saturated hydraulic conductivity, and aggregate stability of a Colombian Oxisol in comparison with two soils from temperate regions (Mollisol and Inceptisol). The aggregate stability of the Oxisol, with kaolinite as predominant clay mineral, was higher than of the other soils. In a field experiment, studying a Typical Hapludox under five simulated rainfalls (Simulator type Swanson) in the south of Brazil, Bertol et al. (2008) experimentally verified that water infiltration in the soil was influenced by the surface roughness, varying from 42 to 63 mm h-1.
Tropical soils typically contain large amounts of Fe and Al oxides (Rolim et al., 2009) which contribute to the soil micro-aggregate structure. Pochet et al. (2007) reported that iron oxides were highly concentrated in the clay fraction of Andosols and Ferrasols developed in a humid tropical area from volcanic ash, on Tongatapu Island, in the South Pacific. The high charge density of the clay minerals and large surface area of ferrihydrite induce micro-aggregation, resulting in exceptionally high saturated hydraulic conductivity and large water storage in micropores. Further evidence of the distinction between soils from temperate and tropical regions is given by the possibility of predicting the hydraulic function of these soils by various pedotransfer functions from readily available data, e.g. grain size distribution, bulk density, and organic matter content. Hodnett & Tomassella (2002) reported that the pedotransfer functions developed for soils from temperate regions often fail to predict the properties of tropical soils. These findings reinforce the need of a careful characterization of soil hydraulic properties. The results of this study will be useful for tropical regions such as Brazil, India and Southeast Asia, where agriculture is intensive.
The objective of this study was to develop a method for hydraulic property characterization of an Oxisol based on a combination of laboratory tension infiltration-outflow experiments on an undisturbed soil column with full water balance control, and inverse modeling of this type of experiment. A new semi-automated installation, a modification of a device
designed by Snehota et al. (2002), was built to conduct the experiment. Computed tomography imaging of the soil sample was used to qualitatively check the internal structure and thus inspect the sample for possible failures caused by the excavation procedure. The method presented was tested as part of ongoing research to verify the mobility of new chemicals in tropical soils (Alavi et al., 2008; Dusek et al., 2010a,b). This also involved measurements of water retention curves by equilibrium methods. In this study, the parameters of the retention curve and hydraulic conductivity function were determined based on a set of laboratory infiltration-outflow experiments on a medium-sized undisturbed column.
The resulting parameters were compared with retention data obtained by standard equilibrium methods.
MATERIALS AND METHODS
Soil and undisturbed columns
The soil column was collected from the Poamoho Agricultural Experiment Station of the University of Hawaii, located on the island of Oahu, Hawaii, USA (henceforth Poamoho site), located in the northwest quadrant of central Oahu; latitude 21 ° 32 ´ 16.81 North and longitude 158 ° 05 ´ 21.3 West. The annual rainfall is approximately 1,000 mm. The typical soil type in the area is Oxisol of the Wahiawa series (Gavenda et al., 1996). Particle-size distribution was analyzed in a grab soil sample from the Poamoho site from 32 cm depth, by sieving and sedimentation methods. The soil is composed of 7.6 % sand (2– 0.05 mm), 58 % silt (0.05–0.002 mm) and 34.4 % clay particles (< 0.002 mm).
The Oxisol at the Poamoho site consists of three layers of parent material. The A horizon developed from Asian aerosol dust, the B horizon developed from volcanic ash, and the 2B horizon developed from basaltic residuum (Gavenda et al., 1996). This layering may affect water movement through the profile. Basic physical properties of the soil horizons are given in table 1.
The A horizon (surface) is visually darker than the B horizon (subsoil). The soil consists principally of kaolinite, metal oxides, and minimal amounts of quartz. Organic matter content is low, ranging from 1.5 % at the soil surface to 0.7 % at 0.8 m below the soil surface.
Soil core imaging
Computed tomography (CT) is an imaging technology based on the attenuation of X ray or gamma beams in materials (see Duliu (1999) for the physical principle of image acquisition and method of image reconstruction). The application of CT imaging in the examination of soil columns was reported by Cislerova & Votrubova (2002). CT image intensities are usually expressed in Hounsfield units (HU) - a measure of linear transformation of the attenuation coefficient, and are calibrated to obtain 0 HU for air and +1,000 HU for water. The result of a CT scan is digital three-dimensional (3D) image. The soil column from the Poamoho site was scanned on a Toshiba Aquillion 16 medical CT scanner at a hospital in Honolulu, Hawaii. CT scanning was done as a last step, after completion of all flow experiments.
In order to enable the X ray CT scanning, the sample was transferred from stainless steel casings to PVC tubes with the same inner diameter. Both ends were sealed with plastic covers with small threaded openings. Based on single energy-level CT scanning, it is only possible to adequately interpret the images of a two-phase system (Rogasik et al., 1999). That means the soil should be either completely dry (solid – air system) or fully water-saturated (solid – water system) prior to scanning. Since oven-drying would cause irreversible changes in the soil structure, the sample was fully saturated with water prior to CT imaging. The sample was first flushed with more than 10 pore volumes of CO2 using the openings in
the top and bottom plastic covers and then saturated with deaerated (boiled) water from the bottom. Approximately one pore volume of water was passed through the sample until no more bubbles were observed in the effluent. The openings were closed with threaded plastic stoppers and sealed. The field of view 170 mm and the voxel (three-dimensional pixel) size 0.3315 × 0.3315 × 0.5 mm3. Images were
captured with a beam energy of 120 kV and current of 300 mA.
Infiltration-outflow experiment
The experimental set-up, built at the University of Hawaii, was based on the design of a previously
developed automated apparatus (Snehota et al., 2002). The design was modified to some extent in this study to simplify the handling and improve the precision of the tension control on the top. In the current set-up, pressure is controlled by a highly accurate pressure controller instead of a double Mariote’s bottle (bubble tower). Moreover, a new design for the custom-made tensiometers was used to allow easy and frequent checking of zero shift of the pressure transducer without requiring disassembly of the tensiometer.
The experiment consisted of a series of pressure-controlled infiltrations into the soil column with free water outflow at the bottom. This system was chosen because it was considered to approximate the infiltration process from rain or irrigation (i.e., soil wetting) more accurately than the commonly used multiple-step outflow experiment (i.e. soil drainage). The constant head at the top of the sample represents a boundary commonly used in field infiltration studies. The lower face of the column was supported by coarse stainless steel mesh open to the atmosphere. This permits initiation of an infiltration runat any water content of the soil column and allows air flow ahead of the wetting front through the sample in the initial stages of infiltration. Using this set-up, water outflow can reach high local velocities without the restriction that would be caused by a porous plate or membrane. Infiltration experiments with free outflow from the lower end of a soil column were presented and tested by Cislerova et al. (1988) and Votrubova et al. (2003). This combination of two boundary conditions allowed us to perform the infiltration experiments on initially field-moist samples with the advantage of being able to monitor all components of the water balance.
The mass of the soil sample, which is closely related to the mean water content of the soil, was monitored using an electronic scale (A&D GP-40K, A&D Engineering, Inc.) to check the water balance. A rigid aluminum frame was constructed on the weighing pan to support the soil core. The soil core itself was positioned on a stainless steel sieve built on a glass funnel (see Figure 1). Outflow from the column was collected in the funnel and directed into a weighed tipping-bucket flow meter. A tension infiltrometer disc, similar to the one used by Perroux & White (1988) was used to infiltrate water into the soil core. The tension infiltrometer disc was supplied with water from a rigid plastic carboy, which functioned as a Mariotte’s bottle. The bottom part of the disc was covered with a nylon membrane (Nybolt, 120 HD), with an air entry value of approximately -20 cm of water. A thin layer of fine quartz sand was interposed between the soil surface and the disc to provide good hydraulic contact. The water pressure head at the disc was monitored using a pressure transducer (236 PC Honeywell Microswitch, USA). Three microtensiometers were inserted into the soil sample to measure soil water pressure heads during the experiments. The microtensiometers were placed 5, 10 and 14 cm below the upper surface of the soil
column. Each tensiometer consisted of a high-flow ceramic cup (0652X03-B01M3, Soil Moisture, CA, USA.) and a pressure transducer (236 PC Honeywell Microswitch, U.S.A.). Precision of the microtensiometers was ±0.25 % (hysteresis and repeatability), the null shift was re-set prior to each infiltration and temperature dependency was assumed to be negligible since temperature was maintained constant during the experiments. The amount of water leaching from the soil core was measured using a tipping bucket equipped with a reed switch to electronically detect each tip-over event. The tipping bucket was attached to a load cell (LCAE-2KG, OMEGA Engineering, USA) in order to provide detailed outflow data (i.e., mass of water) even during periods between tips. The inflow and outflow rates over time were calculated from the records of soil core weight changes and flow meter readings. The tipping bucket, where the outflow was collected, was placed in a Perspex box so evaporation was negligible.
Three infiltration runs with upper boundary conditions -10 cm (run A), -10 cm (run B) and -3 cm were performed. The upper boundary conditions were determined so as to simulate water flow at two levels of close-to-saturation water content. Infiltration tests with set pressure head of -10 cm were repeated twice, while the initial water content prior to infiltration differed. There was only one run for tension -3 cm. The initial pressure heads in the soil sample measured by tensiometers ranged from -200 to -400 cm (see Table 2). Sets of experimental data, e.g. observed cumulative fluxes, pressure heads measured by the tensiometers and the mass of the soil core recorded over time, comprised the results of the infiltration-outflow experiments.
Numerical model
The movement of water in a variably saturated soil column during experiments was modeled by the S1D model developed at the Czech Technical University in Prague, Czech Republic. S1D is a follow-up version of the HYDRUS 5 code (Vogelet al.,1996; see Ray et al., 2004 or Vogel et al., 2007 for recent application of the S1D code). Water flow is described by the one dimensional Richards equation:
(1)
where θ is volumetric water content (cm3 cm-3), h is
pressure head (cm), z is spatial coordinate (cm), t is
time (h) and K is the unsaturated hydraulic
conductivity (cm h-1). The S1D code employs a modified
expression of van Genuchten’s parameterization of the
Figure 1. Diagram of soil column laboratory apparatus
retention curve (van Genuchten 1980; Vogel & Cislerova, 1988) to add extra flexibility to the description of the hydraulic properties near saturation by introduction of parameter θm. The modified van Genuchten parameterization of the water retention curve is expressed as:
θ(h) = θr + (θm - θr) (1 + (-αh)n)-m (2)
This function is used to describe the retention curve in the unsaturated pressure head range h ε (-∞, hs). For pressure heads larger than the air entry value hs (cm), the water content becomes equal to the saturated water content θs.
Retention function (2) in combination with Mualem’s statistical pore-size distribution model (Mualem, 1976) results in the unsaturated hydraulic conductivity function:
(3)
where:
(4)
In the above expressions n, m, α (cm-1) are empirical
parameters and m = 1 - 1/n and n is larger than 1. Ks is the saturated hydraulic conductivity, θr and θs denote the residual and saturated water contents. The parameter θm is related to the air entry value hs
through the relationship:
θ = θr + (θs - θr) (1 + (-αhs)n)m (5)
A constant (negative) pressure head (Dirichlet boundary condition) was assigned at the top of the soil column, corresponding to the suction applied by the tension disc. A seepage face boundary condition (triggered Neumann and Dirichlet boundary condition) was set at the bottom of the column. The initial pressure head distribution, required for the numerical simulations, was derived from the tensiometric observations before each infiltration run. For the upper and lower parts of the soil column, where the values of the boundary suction pressure head were unknown, the initial pressure heads were estimated by a linear extrapolation of measured values.
Reference soil hydraulic characteristics
The water retention curves were measured in the laboratory on undisturbed 100 cm3 soil samples by
means of the hanging water column desorption method combined with the pressure plate apparatus method (Klute, 1986) for details see (Dusek et al., 2010a). The soil hydraulic parameters were derived from the retention data using a modified van Genuchten approach (Vogel & Cislerova, 1988). In the following text, a set of reference soil hydraulic parameters will be marked with letter R: θr = 0.3390, θs = 0.5830, α =
0.2067 cm-1, n = 1.47, h
s = -0.1 cm. Initial estimate of the saturated hydraulic conductivity was assumed to be equal to Ks= 6.09 cm h-1, as published for the
same soil at the Poamoho site by Gavenda et al. (1996).
Model calibration and inverse modeling
The experiment was initially simulated with the reference set of parameters R. Then the reference set of parameters R was used as the initial parameter estimate for inverse modeling by parameter estimation software for automated calibration.
The parameter estimator PEST (Doherty et al., 1995) coupled with the S1D code was used to perform inverse modeling of the measured data. The non-linear estimation technique known as the Gauss-Marquardt-Levenberg method was used to optimize the objective function:
(6)
where wi, vj, fl are weight factors of respective parts of the objective function, qi(ti) is the observed cumulative inflow at time ti, qj(tj) is the observed cumulative outflow at time tj, hl(tl) is the pressure head at time tl, representing the observed tensiometric pressure of three tensiometers, qio(b, ti) is the simulated cumulative inflow at time ti corresponding to the trial parameter vector b, qjo(b, tj) is the simulated cumulative outflow at time tj, corresponding to the trial parameter vector b, and hlo(b, tl) is the simulated pressure head at time tl corresponding to the trial parameter vector b. The parameters were optimized by means of the least square method. Weight factors of individual measurements and datasets (cumulative inflow, cumulative outflow and pressure heads) in the objective function were chosen to counterbalance different absolute values and numbers of measurement in the datasets involved.
The empirical parameters α, n, and saturated
hydraulic conductivity Kswere optimized and
determined by inverse modeling. The remaining parameters were fixed to their initial estimates. Wide (but yet physically meaningful) upper and lower bounds of the optimized soil hydraulic parameters were pre-set to minimize the impact of bounds on inversion process. The success of the optimization procedure was expressed by means of the root mean square error (RMSE).
(7)
RESULTS AND DISCUSSION
CT imaging of the soil column
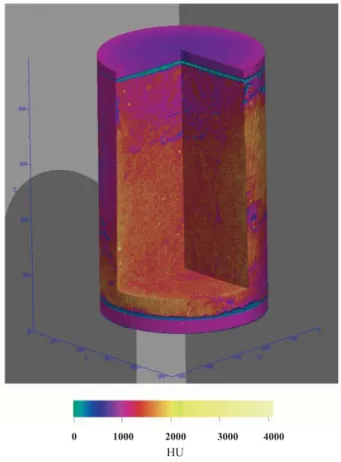
The 3D reconstructed CT image of the soil column is shown in figure 2. The image shows the attenuation coefficient expressed as HU units, which is related to the material density. The lowest HU values represent voids while the highest HU values indicate stone. The image shows that the soil column contained no large cracks, which is a good indication that the samples were not disturbed during extraction. The soil contained a number of small biopores. The diameter of the largest cavity was about 10 mm, but the size of most biopores, detected by CT was in the range of 0.5 to 2.0 mm in diameter and several centimeters in length. Some of these structures were even vertically interconnected from the top to the bottom of the column.
Results of forward modeling
Results of forward modeling with tension infiltration under pressure head h = -10 cm (run B)
(based on the reference set of parameters R), are shown in figure 3. The figure shows the poor agreement between measured and fitted data. The measured pressure heads seen in the figure increased relatively quickly in all three tensiometers, indicating a much faster propagation of the actual wetting front than predicted by the model. Also, the simulated cumulative infiltration was relatively low compared to the measured values. The model predicted the start of outflow more than 12 h later than actually observed during the experiments. A similarly poor fit was obtained for all experimental runs, with RMSE ranging from 8.9 to 26.1 cm.
Results of inverse modeling
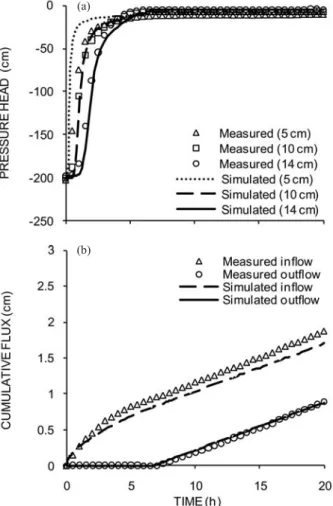
The parameter estimation method significantly improved the fit of the observed data and simulated values for all infiltration runs. Results of inverse modeling based on cumulative fluxes and pressure heads in objective function are shown in the figures 4, 5 and 6. In the run shown in figure 4 (infiltration
Figure 2. Reconstructed 3D CT image of water saturated soil column. Colors show CT value in Hounsfield units (HU), which are related to macroscopic density. The pink layers at both ends of the column are the plastic covers. The PVC column casing was removed from the picture.
run: h = -10 cm run A) the simulated wetting front passed the uppermost tensiometer slightly sooner than experimentally measured. The simulated pressure change in the lowest tensiometer occurred slightly later than the measured. Almost every infiltration run showed a similar behavior. The simulated start of the outflow fit the observed start of outflow well. Simulated cumulative infiltration did not match the observed cumulative infiltration in the initial stages of the experiment, but after outflow began, the fit was very good. Parameter values of the hydraulic functions and their uncertainty are presented in table 3 for all runs. The use of linear 95 % confidence limits (see Table 3) in a highly non-linear problem is always problematic (Vecchia & Cooley, 1987). In our case, no significant difference between non-linear and linear confidence limits was found (infiltration run h = -10 cm run A - not shown here); thus, the linear 95 % confidence intervals are reported.
A comparison of the hydraulic functions obtained by a standard equilibrium method and by parameter optimization is shown in figure 7. Compared to the
reference retention curve measured with a standard equilibrium method (sand table, and pressure extractor), the optimized retention curves show substantially higher air entry values and generally higher water content for suction pressure heads above the air entry value. Similar differences between retention curves measured under static and dynamic conditions (soil draining) were reported by Topp et al. (1967) and later by Wildenschild et al. (2001). In contrast to these previous studies, soil wetting is the dominant process in the current experiment. It is evident from the results, that the pore space available for water during the dynamic infiltration experiment was significantly smaller than the pore space accessible to water during the static equilibrium retention curve measurements. One possible explanation for the described non-uniqueness is the effect of air entrapment as discussed by Schultze et al. (1999). When water infiltrates soil at water content close to saturation the air phase loses its continuity, and residual entrapped air then occupies a portion of the pore space, thereby lowering the retention capacity of the soil (Snehota et al., 2010).
Figure 4. Comparison of observed and simulated (optimized simulation series) pressure heads 5, 10 and 14 cm below the surface (a), and cumulative infiltration and outflow (b) for infiltration run (h = -10 cm run A).
Figure 7. Measured hydraulic functions and obtained by presented method. Circles represent measured data by standard equilibrium method.
Table 3. Soil hydraulic parameters obtained from parameter optimization compared to initial estimates. 95 % linear confidence limits in brackets
The optimized Ks was consistent with the Ks, measured by Gavenda et al. (1996) in the field. Even when the upper boundary condition was tension (not a ponding), the measured experimental data also contain the information about saturated water flow. This is because the seepage face boundary condition allowed to saturate the soil locally at the bottom of soil column.
CONCLUSIONS
1. The experiments with a semi-automated set-up proved to be considerably faster than the standard technique of measuring retention curves using sand table and pressure extractor methods. This applies even if the time needed for evaluation by inverse modeling is included. The duration of the actual
infiltration runs was about one day, while three runs took about three weeks including sample drying between runs, whereas measurements of Oxisols by standard techniques could have taken over three months to analyze one sample set.
2. A soil water flow model in a single domain mode (without preferential flow effects) based on the one-dimensional Richards equation was used to simulate fluxes and pressure head data, which produced a reasonably good fit and consistent parameter values between experimental runs.
3. Although the parameters of hydraulic functions obtained from individual infiltration runs were consistent for the soil column, the shapes of the retention curves estimated from the infiltration experiments show systematically higher water content values than those measured using the standard equilibrium method. More work and possibly comparison with field infiltration data will be needed to fully understand the causes of this effect.
ACKNOWLEDGEMENTS
Laboratory experiments were conducted at the University of Hawaii in the framework of the project “Evaluation of the fate and transport of selected chemicals in Hawaii soils”, Hawaii Department of Agriculture, 6/02-7/05. The study was also supported by research project No. 103/08/1552 of the Czech Science Foundation and by the CTU in Prague project No. SGS10/146/OHK1/2T/11. We acknowledge the help of Philip Moravcik and Richard E. Green in improving the quality of this manuscript. This paper was published as part of the continuing “Contributed Papers” series of the Water Resources Research Center, University of Hawaii at Manoa.
LITERATURE CITED
ALAVI, G.; SANDA, M.; LOO, B.; GREEN, R.E. & RAY, C. Movement of bromacil in a Hawaii soil under pineapple cultivation - a field study. Chemosphere, 72:45-52, 2008. ANKENY, M.D.; AHMED, M.; KASPAR, T.C. & HORTON, R. Simple field method for determining unsaturated hydraulic conductivity. Soil Sci. Soc. Am. J., 55:467-470, 1991.
BERTOL, I.; ZOLDAN JÚNIOR, W.A.; FABIAN, E.L.; ZAVASCHI, E.; PEGORARO, R. & PAZ GONZÁLEZ, A. Efeito de escarificação e da erosividade de chuvas sobre algumas variáveis de valores de erosão hídrica em sistemas de manejo de um Nitossolo Háplico (Effect of chiseling and rainfall erosivity on some characteristics of water erosion in Nitosol under distinct management systems). R. Bras. Ci. Solo, 32:747-757, 2008.
CISLEROVA, M.; SIMUNEK, J. & VOGEL, T. Changes of steady-state infiltration rates in recurrent ponding infiltration experiments. J. Hydrol., 104:1-16, 1988.
CISLEROVA, M. & VOTRUBOVA, J. CT derived porosity distribution and flow domains. J. Hydrol., 267:186-200, 2002.
CLOTHIER, B.E.; KIRKHAM, M.B. & MCLEAN, J.E. In situ measurement of the effective transport volume for solute moving through soil. Soil Sci. Soc. Am. J., 56:733-736, 1992.
DOHERTY, J.; BREBBER, L. & WHYTE, P. PEST, Model-independent parameter estimation. Townsville, Australian Centre for Tropical Freshwater Research, James Cooke University, 1995. 336p.
DULIU, O.G. Computer axial tomography in geosciences: An overview. Earth-Sci. Rev., 48:265-281, 1999.
DUSEK, J.; SANDA, M.; LOO, B. & RAY, C. Field leaching of pesticides at five test sites in Hawaii: Study description and results. Pest Manag. Sci., 66:596-611, 2010a. DUSEK, J.; RAY, C.; ALAVI, G.; VOGEL, T. & SANDA, M.
Effect of plastic mulch on water flow and herbicide transport in soil cultivated with pineapple crop: A modeling study, Agric. Water Manag., 97:1637-1645, 2010b.
GAVENDA, R.T.; GREEN, R.E. & SCHNEIDER, R.C. Leaching of pesticides in selected Hawaii Oxisols and Andosols as influenced by soil profile characteristics. Honolulu, University of Hawaii, 1996. (HITAHR Research Series, 75)
GREEN, R.E. & GUERNSEY, C.W. Soil-water relations and physical properties of irrigated soils in the Kula area, Island of Maui, Hawaii. Honolulu, College of Tropical Agriculture and Human Resources, University of Hawaii, 1981. (Research Bulletin, 173)
GREEN, R.E.; AHUJA, L.R.; CHONG, S.K. & LAU, L.S. Water conduction in Hawaii Oxic soils. Honolulu, Water Resources Research Center, University of Hawaii, 1982. (Technical Report, 143)
HAVERKAMP, R.; ROSS, P.J.; SMETTEM, K.R.J. & PARLANGE, J.-Y. Three dimensional analysis of infiltration from the disc infiltrometer: 2. Physically-based infiltration equation. Water Res. Res., 30:2931-2935, 1994. HODNETT, M.G. & TOMASELLA, J. Marked differences between van Genuchten soil water-retention parameters for temperate and tropical soils: a new water-retention pedo-transfer function developed for tropical soils. Geoderma, 108:155-180, 2002.
KLUTE, A. Water retention: Laboratory methods. In: KLUTE, A. Methods of soil analysis; Physical and mineralogical methods. Madison, American Society of Agronomy, Soil Science Society of America, 1986. Part 1. p.635-662. LARSON, W.E. & PADILLA, W.A. Physical-properties of a
Mollisol, an Oxisol and an Inceptisol. Soil Tillage Res., 16:23-33, 1990.
PERROUX, K.M. & WHITE, I. Designs for disk permeameters. Soil Sci. Soc. Am. J., 52:1205-1215, 1988.
POCHET, G.; van der VELDE, M.; VANCLOOSTER, M. & DELVAUX, B. Hydric properties of high charge, halloysitic clay soils from the tropical South Pacific region. Geoderma, 138:96-109, 2007.
RAY, C.; VOGEL, T. & DUSEK, J. Modeling depth-variant and domain-specific sorption and biodegradation in dual-permeability media. J. Contam. Hydrol., 70:63-87, 2004. RAY, C.; SNEHOTA, M.; LICHWA, J. & SOBOTKOVA, M.
Leaching behavior of selected pesticides: Column study of Wahiawa Oxisol from Poamoho. Oahu, Hawaii, WRRC, University of Hawaii at Manoa, 2007. (Final report for HDOA)
ROGASIK, H.; CRAWFORD, J.W.; WENDROTH, O.; YOUNG, I.M.; JOSCHKO M. & RITZ K. Discrimination of soil phases by dual energy x-ray tomography. Soil Sci. Soc. Am. J., 63:741-751, 1999.
REYNOLDS, W.D. & ELRICK, D.E. Determination of hydraulic conductivity using a tension infiltrometer. Soil Sci. Soc. Am. J., 55:633-639, 1991.
ROLIM, F.C.; SCHAEFER, C.E.G.R.; FERNANDES, E.I.; CORREA, M.M.; DA COSTA, L.M.; PARAHYBA R.D.V.; GUERRA, S.M.S. & HECK, R. Topolitosequences of soils in the Alto Paranaiba region: Physical, chemical and mineralogical properties. R. Bras. Ci. Solo, 33:1795-1809, 2009.
SCHULTZE, B.; IPPISCH, O.; HUWE, B. & DURNER, W. Dynamic nonequilibrium during unsaturated water flow. In: van GENUCHTEN, M.TH.; LEIJ, F.J. & WU, L., eds. WORKSHOP ON CHARACTERIZATION AND MEASUREMENT OF THE HYDRAULIC PROPERTIES OF UNSATURATED POROUS MEDIA, Proceedings… Riverside, University of California, 1999. p.877-892. SIMUNEK, J. & van GENUCHTEN, M.TH. Estimating
unsaturated soil hydraulic properties from tension disc infiltrometer data by numerical inversion. Water Res. Res., 32:2683-2696, 1996.
SNEHOTA, M.; CISLEROVA, M. & ROBOVSKA, A. Automated set-up designed to measure hydraulic parameters in heterogeneous soil close to saturation. J. Hydrol. Hydromech.,50:247-257, 2002.
SNEHOTA, M.; SOBOTKOVA, M. & CISLEROVA, M. Impact of the entrapped air on water flow and solute transport in heterogeneous soil: Experimental set-up. J. Hydrol. Hydromech., 56:247-256, 2008.
SNEHOTA, M.; CISLEROVA M.; AMIN, M.H.G. & HALL L.D. Tracing the entrapped air in heterogeneous soil by means of magnetic resonance imaging. Vadose Zone J., 9:373-384, 2010.
TOPP, G.C.; KLUTE, A. & PETERS, D.B. Comparison of water content-pressure head data obtained by equilibrium steady-state and unsteady-state methods. Soil Sci. Soc. Am. Proc., 31:312-314, 1967.
VACHAUD, G.; VAUCLIN, M. & WAKIL, M. A study of the uniqueness of the soil moisture characteristic during desorption by vertical flow in unsaturated porous media. Soil Sci. Soc. Am. Proc., 36:531-532, 1972.
van GENUCHTEN, M.TH. A closed-form equation for predicting the hydraulic conductivity of unsaturated soils. Soil Sci. Soc. Am. J., 44:892-898, 1980.
VECCHIA, A.V. & COOLEY, R.L. Simultaneous confidence and prediction intervals for nonlinear regression models with application to a groundwater flow model. Water Res. Res., 23:1237-1250, 1987.
VOGEL, T. & CISLEROVA, M. On the reliability of unsaturated hydraulic conductivity calculated from the moisture retention curve. Transp. Porous Media, 3:1-15, 1988.
VOGEL, T.; HUANG, K.; ZHANG, R. & van GENUCHTEN, M.TH. The HYDRUS code for simulating one-dimensional water flow, solute transport, and heat movement in variably-saturated media. Version 5.0. Riverside, U.S. Salinity Lab. ARS, USDA, 1996. (Research Report, 140) VOGEL, T.; NAKHEI M. & CISLEROVA, M. Description of
soil hydraulic properties near saturation from the point of inverse modeling. In: van GENUCHTEN, M.TH.; LEIJ, F.J. & WU, L., eds. INTERNATIONAL WORKSHOP ON CHARACTERIZATION AND MEASUREMENT OF THE HYDRAULIC PROPERTIES OF UNSATURATED POROUS MEDIA, Riverside, 1999. p.693-703.
VOGEL, T.; LICHNER, L.; DUSEK, J. & CIPAKOVA, A. Dual-continuum analysis of a cadmium tracer field experiment. J. Contam. Hydrol., 92:50-65, 2007.
VOTRUBOVA, J.; CISLEROVA, M.; AMIN, M.H.G. & HALL, L.D. Recurrent ponded infiltration into structured soil: A magnetic resonance imaging study. Water Res. Res., 39: 1371, 2003.
WILDENSCHILD, D.; HOPMANS, J.W. & SIMUNEK, J. Flow rate dependence of soil hydraulic characteristics. Soil Sci. Soc. Am. J., 65:35-48, 2001.
WOODING, R.A. Steady infiltration from a shallow circular pond. Water Res. Res., 4:1259-1273, 1968.