Escola de Ciências
Paulo Jorge Passos Geraldes
Fungal communities and functional
measures as indicators of stream
ecosystem health
Master Thesis
Master in Ecology
Work supervised by:
Prof. Dra. Fernanda Cássio
Prof. Dra. Cláudia Pascoal
ii
É AUTORIZADA A REPRODUÇÃO INTEGRAL DESTA TESE/TRABALHO APENAS PARA EFEITOS DE INVESTIGAÇÃO, MEDIANTE DECLARAÇÃO ESCRITA DO INTERESSADO, QUE A TAL SE COMPROMETE.
Universidade do Minho, Outubro de 2011
___________________________ (Paulo Jorge Passos Geraldes)
iii
I would like to say few words to some people that helped me during this time and contributed somehow to this work:
To my supervisors Prof. Fernanda Cássio and Prof. Cláudia Pascoal for all scientific knowledge transmitted and all support, patience and dedication during this entire master; thank you for showing me that it is possible to do good science in my country;
To Sofia and Isabel that welcomed me in the lab and for their help, support and friendship. A special thank you for Isabel, I don’t have words enough to thank you;
To Ana and Eva, for their collaboration, friendship and good times spent together; for all of the other people that shared lab with me: Seena, Arunava and more recently Francisco, Bárbara, Zé and Bruno.
To some people that began this journey with me, especially Fred, Gina, Joana Silva, Aidé, Eva, Ana and Joana Duarte, thanks for good moments spent together;
To all my friends that always surround me, in good or bad moments; thanks for not letting me give up to persecute my objectives. We had lots of good moments together and I want to thank you for all that;
To my family, for all their support; sorry for the missed moments;
To Diana, my muse.
The project FRESHBIOFUN: Biodiversity and the functioning of detritus food-webs in freshwaters (PTDC/AAC-AMB/117068/2010) supported this study.
v
Eutrophication, caused by nutrient loads from agricultural and urban sewages, is an important threat to freshwater ecosystems. In low-order forested streams, plant-litter decomposition is a key ecosystem process linking the riparian vegetation, microbial and invertebrate activity and environmental factors. Microorganisms in freshwaters, particularly aquatic fungi, are important components of food webs because they degrade plant litter and make it more suitable to invertebrates and higher trophic levels.
Leaf-litter decomposition in streams is strongly influenced by leaf quality and concentration of dissolved nutrients, primarily inorganic nitrogen (N) and phosphorus (P), in the stream water. To better understand the mechanisms by which leaf decomposition responds to water-quality degradation, we evaluated the diversity, reproduction and biomass of fungal decomposers, and leaf-litter decomposition of five leaf types along a gradient of eutrophication in seven streams of Northwest Portugal.
The increase in concentration of inorganic nutrients in the stream water was responsible for shifts in fungal-community structure and for differences in microbial activity among the seven streams. Intermediate eutrophic streams exhibited higher fungal biomass and sporulation than the oligotrophic and the most eutrophic streams. Leaf decomposition responded in a similar way, but differed among the five leaf types. Alder and chestnut leaves had high nutritional value (higher N content and lower C:N) and decomposed faster than eucalypt leaves with low nutritional value.
Overall, results indicated that aquatic fungal communities and litter decomposition respond to eutrophication and have potential to be used for assessing stream ecosystem health.
vii
A eutrofização causada pelas descargas de nutrientes, provenientes das actividades agrícolas e dos esgotos urbanos, é uma das principais ameaças para os ecossistemas dulciaquícolas. Em rios de cabeceira florestados, a decomposição da folhada é um processo chave no ecossistema que depende da vegetação ribeirinha, da actividade do biota aquático e dos factores ambientais. Nos rios e ribeiros, os fungos decompositores são componentes importantes das cadeias alimentares, uma vez que promovem a transferência de carbono e energia para os níveis tróficos superiores.
A decomposição da folhada nos rios é fortemente influenciada pela qualidade da folha e pela concentração de nutrientes dissolvidos na água, principalmente azoto (N) e fósforo (P) inorgânicos. Para compreender os mecanismos pelos quais a decomposição da folhada responde à degradação da qualidade da água, avaliou-se a diversidade, a reprodução e a biomassa dos fungos aquáticos, e a decomposição de cinco tipos de folhada, ao longo de um gradiente de eutrofização, em sete rios do Noroeste de Portugal.
O aumento da concentração de nutrientes inorgânicos dissolvidos na água dos rios foi responsável por alterações na estrutura e na actividade das comunidades de fungos. Nos rios com eutrofização moderada, a biomassa fúngica e a esporulação foram superiores às dos rios oligotróficos ou hipertróficos. O padrão de resposta da decomposição da folhada à eutrofização foi semelhante, mas a resposta diferiu com o tipo de folha. As folhas de amieiro e de castanheiro apresentavam maior valor nutritivo (maior conteúdo em N e menor razão C:N) e decompuseram-se mais rapidamente do que as folhas de eucalipto cujo valor nutricional era inferior.
Como um todo, os resultados indicaram que as comunidades de fungos aquáticos e a decomposição da folhada respondem à eutrofização e têm potencial para serem usadas na avaliação da qualidade ecológica de ecossistemas de água doce.
ix
1. Introduction
1.1. Characterization of freshwater ecosystems 1
1.2. The rivers status: major impacts to freshwaters 2
1.3. Methods to evaluate stream ecosystem health 3
1.4. Plant-litter decomposition in freshwater ecosystems 5
1.5. Aquatic biota involved in plant litter decomposition 6
1.5.1. Microbial decomposers: bacteria and fungi 6
1.5.2. Macroinvertebrates 7
1.6. Measures of leaf-litter decomposition 8
1.6.1. Decomposition rates 8
1.6.2. Fungal biomass and activity 9
1.6.3. Fungal diversity 10
1.7. Plant-litter decomposition under anthropogenic stress 11
1.8. Litter quality in plant-litter decomposition 13
1.9. Aim and outline of the thesis 14
2. Material and Methods
2.1. Study area 15
2.2. Leaf bags 15
2.3. Physical and chemical analyses of the stream water 16
2.4. Leaf mass loss 17
2.5. Litter chemistry 17
2.6. Fungal sporulation and biomass 17
2.7. Data analysis 18
3. Results
3.1. Physical and chemical characteristics of stream water 19
3.2. Fungal communities 20
3.3. Fungal activity 25
3.4. Leaf chemistry and decomposition 27
4. Discussion 31
1
1. Introduction
1.1. Characterization of freshwater ecosystems
Since ancient times, freshwater ecosystems are of extreme importance for human civilizations providing drinkable water and food items for human survival (Millennium Ecosystem Assessment – MEA 2005). Freshwaters can be classified as: (1) lotic systems, with running waters (e.g., rivers and streams); and (2) lentic systems, with standing water (e.g., lakes), each one with specific roles in the water cycle (Molles 2008).
Rivers and streams are highly connected with surrounding ecosystems, namely with terrestrial ecosystems and water reservoirs (oceans and lakes), supporting high biodiversity and important ecological processes (Allan and Castillo 2007). Rivers and streams have a hierarchical organization, with small streams joining each other and creating rivers with increasing size that run downstream until they reach the ocean or big lakes (Allan and Castillo 2007, Molles 2008). They show a particular longitudinal profile, with distinct characteristics between uplands, where they born, the middle regions, and the lowlands, in their terminus (Schumm 1977). The upland zones, with great slopes, have deep V-shaped valleys, rapids and waterfalls, and export sediments to the lowland regions (Schumm 1977). Comparing to upland zones, the middle elevation transfer zone is characterized by broader valleys and gentler slopes, with tributaries merge and some meanders development (Schumm 1977). In the lower elevation depositional zone, the river meanders cross a broad nearly flat valley, and may become divided into multiple channels as the river flows across its own deposited sediments (Schumm 1977). Fluvial hydrology is tremendous variable, influenced by climate, geology, topography and surrounding vegetation (Allan and Castillo 2007). The riparian zone, in the border of stream channel, is remarkably important for ecological processes occurring in streams, since it becomes immersed at least once per year, functioning as a transition between the stream and the surrounding terrestrial ecosystem (Sabater et al 2009). Besides functioning as a biological corridor, the riparian zone is very important in the attenuation of floods and runoff effects, in fixation of nutrients and sediments, and it has high productivity, which supports high biota diversity (Allan and Castillo 2007, Sabater et al 2009).
2
The river continuum concept, a theory developed by Vannote et al (1980), states that the river is a continuous system, where ecological processes, biological communities and food sources change from headwater to mouth. In headwater-forested streams, tree canopy limits the light that reaches the stream and so the major energy source for stream biota is the allochtonous organic matter from surrounding vegetation (Vannote et al 1980). This organic matter, principally coarse particulate organic matter (CPOM), is modified by decomposers along the stream, being released as fine particulate organic matter (FPOM) that becomes available to other organisms, which begin to emerge and gain importance downstream (Vannote et al 1980). As we go downstream, the contribution of allochtonous organic matter as energy source decreases and is replaced by primary production (Vannote et al 1980). However, because of depth, which limits light availability and consequently photosynthesis, the primary production at the stream mouth decreases and FPOM from upstream areas becomes an important energy source for aquatic biota (Vannote et al 1980).
1.2. The rivers status: major impacts to freshwaters
Although water covers more than 70 % of our blue planet, only a minuscule percentage (0.007 %) of the world’s freshwater is running in streams and rivers or is in groundwater and readably accessible to humans (United Nations – UN 2006). Streams and rivers provide conditions to human settlement (e.g., source of water for domestic, industrial and agricultural purposes, power generation, waste disposal, routes for navigation and locations for the pursuit of leisure activities) and humankind always used freshwater ecosystems for its benefit (Vitousek et al 1997, Malmqvist and Rundle 2002, UN 2006). As a consequence, nowadays few river catchments are not suffering from human impacts (UN 2006).
The most important threats to freshwater ecosystems caused by humankind include: overexploitation of resources, fragmentation, degradation and destruction of habitats, as well as invasion of non-indigenous species and water pollution (Malmqvist and Rundle 2002, Dudgeon et al 2006). Other threats, such as the modification of river flows and wetland inundation regimes (Arthington et al 2010) and the environmental changes occurring at global scale (e.g., nitrogen deposition, warming, shifts in precipitation and runoff patterns; Poff et al 2002, Galloway et al 2004) contribute to freshwater
3
degradation. As a consequence, species loss, reduction in species dispersion, increase in contaminant and toxicant levels is occurring in freshwaters leading to changes in ecological dynamics and processes (Malmqvist and Rundle 2002).
Growth of human population greatly contributes to freshwater ecosystem degradation and destruction (Sala et al 2000, Dudgeon et al 2006, Vitousek et al 1997). It is predicted that human population will rise substantially until 2025, and even more after that, increasing its impacts on rivers and streams (UN 2006). Water needs, mainly for agriculture, result in decreased rivers discharges and groundwater depletion (UN 2006). On the other hand, the high levels of fertilizers utilized in intensive agriculture, the high industrial development and the low sanitation, with direct sewage discharge into streams, are factors that impair water quality all over the world and so, water of high quality is expected to become scarce (UN 2006). Additionally, in many parts of the world, freshwater resources are subjected to severe competition among countries with limited water supplies traversing political boundaries and increasing politic tensions, from which possible armed conflicts can emerge (Poff et al 2003). Therefore, politicians must look to all these problems and try to find solutions to have better water resources available for all.
1.3. Methods to evaluate stream ecosystem health
Nowadays, because of growing human activities and their high dependence from freshwaters, few rivers and streams remain pristine and the increasing demand for water supply will magnify the degradation of freshwaters. To face this scenario, in 2000, the European Union created the Water Framework Directive (WFD) to induce all member countries to take all the necessary measures to ensure that water bodies have high quality until 2015 (European Union – EU 2002). To apply these guidelines, first of all it is necessary to assess the ecological integrity of freshwaters and, then, apply the necessary measures to conserve or improve freshwater ecosystems. The ability to assess accurately the ecological integrity of freshwaters is a critical step in restoration/rehabilitation programs, so that the causes of degradation or the success of rehabilitation efforts can be measured (Young et al 2008, Gessner and Chauvet 2002). Moreover, the ecological state of a certain stream can vary along a gradient from
4
excellent condition to very bad condition, and caution must be taken when making the assessment and interpreting the results (Young et al 2008).
To assess the ecological integrity or ecological status of a stream, the structural and the functional components have to be examined (Minshall 1996). The structural component of ecological integrity refers to the qualitative and quantitative composition of biological communities and their resources, while functional integrity refers to the rates, patterns, and relative importance of different ecosystem-level processes (Gessner and Chauvet 2002). Traditionally, programs for assessing freshwater-ecosystem status are exclusively based in structural measures (Boulton 1999). Fish and macroinvertebrates communities were the main focus in ecological assessment (Metcalfe-Smith 1994, Barbour et al 1999, Norris and Hawkins 2000, Statzner et al 2001), but benthic algal, protozoans, and macrophytes have been increasingly used (Barbour et al 1999, Descy and Coste 1991, Norris and Thoms 1999, Hill et al 2000). Functional measures are not currently considered in assessment programs of the ecological status of streams, although their importance in ecological integrity has been demonstrated (Bunn and Davies 2000, Gessner and Chauvet 2002, Pascoal et al 2001, 2003, Friberg et al 2009). From an ecological point of view ecosystems are entities defined by both structure and function (Cummins 1974, Chapin et al 1997), with structure determining processes and processes, in turn, affecting structures (Gessner and Chauvet 2002). The restriction of assessment programs to structural measures ignores the processes occurring in freshwaters and the extent of impacts on them. Moreover, changes in biological communities do not necessarily lead to changes in processes, showing the importance of assessing ecosystem functioning (Matthews et al 1982, Pascoal et al 2005a). There are three possible responses of structural and functional ecosystem attributes to stress: (1) structural changes without modification of functional parameters (Nelson 2000), (2) functional changes without alteration of community structure (Bunn and Davies 2000), and (3) changes in both structure and function (Leland and Carter 1985, Wallace et al 1996). These differential responses might be due to multi-stressors interactions (Doroszuk et al 2007). As a consequence, both structural and functional measures must be considered in programs for assessing stream ecological status.
5
1.4. Plant-litter decomposition in freshwater ecosystems
In small-headwater streams, the low temperatures, low nutrients levels and low solar irradiation, due to density of riparian cover, limit primary production (Benfield 1996, Mulholland et al 2001). As a consequence, in these streams allochtonous organic matter, i.e. leaves, twigs and other parts of the riparian trees is the major nutrients and energy source to aquatic food webs (Cummins 1974, Benfield 1996, Mulholland et al 2001). The organic matter reaching the stream can be used by stream biota, stored or transported downstream depending on the stream retentiveness (Abelho 2001, Elosegi 2005, Larrañaga et al 2003).
When plant material enters the stream, litter breakdown can be described in three phases: (1) an initial leaching of soluble compounds, (2) a period of microbial conditioning, and (3) mechanical and biotic fragmentation; these phases tend to occur sequentially, although some temporal overlapping can occur (Petersen and Cummins 1974, Webster and Benfield 1986, Gessner et al 1999). In the leaching phase, soluble substances, such as phenolics, carbohydrates and amino acids, are lost within 24 hours up to 7 days after plant-litter immersion, with mass loss reaching up to 25-30 % of initial mass, depending on variables, such as water temperature, turbulence and plant species (Gessner et al 1999, Casas and Gessner 1999). Microbial conditioning consists in the colonization and growth of microorganisms, especially fungi and bacteria, on leaf litter. Microbes enhance leaf palatability to invertebrate shredders through the accumulation of microbial biomass of high nutritional value (Cummins 1974, Suberkropp 1998a, Graça 2001, Webster and Benfield 1986). The physical and biotic fragmentation result from the abrasion exerted by the flowing water and from the feeding and digestive activities of invertebrate shredders and microbes that contribute significantly to leaf decomposition (Cummins 1974, Cummins and Klug 1979, Gessner et al 1999). As a result of abiotic and biotic factors, allochtonous organic matter falling in streams is transformed into several products, including microbial and invertebrate biomass, fine particulate organic matter (FPOM), dissolved organic matter (DOM), inorganic nutrients and carbon dioxide (Gessner et al 1999).
Plant-litter decomposition in streams is affected by both abiotic and biotic factors, which determine diversity and activity of biotic assemblages involved in the process with impacts to litter decomposition rates (Abelho 2001). Among biotic factors, litter quality (Petersen and Cummins 1974, Baldy et al 1995, Escudero et al 1991) and its
6
state, e.g., senescent leaves lose their compounds faster than fresh leaves (Bärlocher 1997), influence litter decomposition rates. External abiotic factors include stream water parameters, such as water temperature (Chergui and Pattee 1990, Bergfur 2007), dissolved oxygen (Raviraja et al 1998), dissolved nutrients (Suberkropp and Chauvet 1995, Robinson and Gessner 2000, Gulis and Suberkropp 2003a) and pH (Dangles et al 2004).
1.5. Aquatic biota involved in plant-litter decomposition
1.5.1. Microbial decomposers: bacteria and fungi
Leaves falling into the streams are colonized by a variety of terrestrial fungi (Bärlocher and Kendrick 1974), but after reaching the water they are rapidly colonized by aquatic microbes. Among them, aquatic fungi, particularly aquatic hyphomycetes, become the dominant group (Suberkropp 1998a, Bärlocher 2005a, Gessner et al 2007). Aquatic hyphomycetes, also named Ingoldian fungi, are a polyphyletic group of fungi (Marvanová 1997, Bärlocher 2007, Shearer et al 2007), whose sexual stage of most species has not been described yet (Shearer et al 2007). They are found worldwide in flowing waters, growing on different plant substrates, such as leaves and wood debris (Bärlocher 2005a, Gessner et al 2007). The morphological and physiological adaptations to fast flowing waters are the secret beyond its huge success in these environments (Suberkropp 1998a, Bärlocher 2005a, Gessner et al 2007). Morphological adaptations include the production of asexual spores (conidia) with tetrarradiate or sigmoid shape, which allow an efficient attachment to the substrate, enhanced by the production of mucilages at the ends of conidial arms (Read et al 1992). The physiological adaptations are related to: their capacity of producing extracellular enzymes with cellulolytic and pectinolytic activity (Suberkropp and Klug 1980, Chamier 1985, Suberkropp 1992), which are able to break the major plant polysaccharides; and the ability to maintain high conidial production at relatively low temperatures, common in temperate regions during autumn fall (Suberkropp 1984).
Other fungi, as the saprophytic yeasts, are common on the surface of leaves (Sampaio 2001, 2004, 2007) even in polluted streams (Spencer et al 1970). Although there are evidences that only few yeast species are able to degrade complex plant
7
polymers, such as cellulose (Dennis 1972) and xylan (Jiménez et al 1991), some yeast species have been found associated with decomposing plant litter, with communities differing among leaf species and time of decomposition (Sampaio et al 2001, 2004, 2007).
Bacteria are also involved in plant-litter decomposition because they are also able to produce enzymes that degrade the complex polysaccharides of plant material (Burns 1982). In submerged marsh plant litter, bacteria appear to have higher contribution to the microbial production than fungi (Buesing and Gessner 2006). However, bacterial contribution to plant-litter decomposition in streams appears to be lower than that of fungi, when assessed either from biomass production or productivity (Baldy et al 1995, 2002, Hieber and Gessner 2002, Pascoal and Cássio 2004). The relatively low contribution of bacteria to leaf decomposition may be related to its reduced or absent invasive ability, confining bacteria to the plant surfaces (Porter et al 1989).
Fungi and bacteria can have both synergistic and antagonistic interactions during leaf decomposition (Wohl and McArthur 2001, Romaní et al 2006). Bacteria are reported to grow better in the presence of fungi than alone (Romaní et al 2006). In the presence of fungi, bacteria can benefit from the organic compounds released by fungal and invertebrate activities (Sinsabaugh and Findlay 1995), and from the lysis of dead fungal mycelia (Gulis and Suberkropp 2003b). However, aquatic fungi can produce antibiotics that limit bacterial growth (Gulis and Stephanovich 1999), and bacteria can produce fungicides or chitinolytic enzymes that suppress fungal growth (Wohl and McArthur 2001, Romaní et al 2006).
1.5.2. Macroinvertebrates
Macroinvertebrates can be classified in four major categories: (1) shredders, (2) grazers or scrapers, (3) collectors (both gatherers and filterers) and (4) predators (Cummins 1973). The macroinvertebrate detritivores include the shredders and collectors, those feeding on CPOM and FPOM respectively (Graça 2001). The shredders are those with a major role on litter decomposition because they have physical adaptations, such as mouthparts adapted to the maceration of CPOM, converting it to FPOM that remains available for other invertebrate groups (Graça 2001).
8
Macroinvertebrates also produce FPOM in the form of fecal pellets that can be used as a food source by many invertebrates in streams (Graça 2001).
Shredders are reported to preferentially feed on leaves conditioned by microbes, particularly fungi, which improve the nutritional quality of the leaves (Cuffney et al 1990, Chergui and Pattee 1990, Graça 2001). This benefit comes from two different ways: on the one hand, invertebrates feed directly on fungi, and fungal biomass enhance nutrient content per unit mass of leaves when compared with leaves alone (Bärlocher and Kendrick 1981); on the other hand, by eating plant substrates (cellulose, hemicellulose, and pectin) modified by microbial enzymes (Bärlocher 1985). Moreover, shredders also show preferences for certain fungal species (Bärlocher and Kendrick 1973, Arsuffi and Suberkropp 1985, Graça et al 1993a, b, Suberkropp et al 1983).
1.6. Measures of leaf-litter decomposition
1.6.1. Decomposition rates
Leaf decomposition rates can be easily measured by placing known amounts of leaves in packs or bags into the stream, and measuring the remaining organic matter mass over time (Bärlocher 2005b). The contribution of microorganisms and invertebrates to leaf decomposition can be discriminated by using bags with different mesh sizes: coarse mesh bags (e.g., 5 mm mesh size) will allow the colonization by both invertebrates and microorganisms; while fine mesh bags (e.g., 0.5 mm mesh size) will only allow the colonization by microorganisms (Boulton and Boon 1991).
Leaf decomposition rates can be calculated using the negative exponential model , where is the leaf mass remaining at time , is the initial leaf mass, is the rate of leaf decomposition and is the base of natural logarithm (Webster and Benfield 1986). A wide variation of leaf decomposition rates is well documented among different plant substrates and plant species, with non-woody substrates decomposing faster than woody substrates (Petersen and Cummins 1974). Generally, leaves can be classified, based on their decomposition rates, as having fast ( ), medium ( ) and slow ( ) decomposition rates (Petersen and Cummins 1974), with differences in decomposition rates attributed to differences in leaf chemistry.
9
1.6.2. Fungal biomass and activity
When growing on leaves, filamentous fungi produce hyphae that penetrate in the leaves, making it difficult to separate fungal cells from the leaves (Newell 1992). For this reason, the quantification of fungal biomass has been made by measuring specific cellular constituents that occur at approximately constant amount in the mycelium (Gessner and Newell 2002). The most used constituent to quantify fungal biomass has been the ergosterol (Gessner 2005, Gessner and Newell 2002). Ergosterol is the major sterol in fungal cell membranes and it is absent in vascular plants, metazoans and most other organisms; its structure is different from that of plant sterols and it is spectrophotometrically distinguishable. Moreover, ergosterol is rapidly degraded after cell death, making it a good indicator of living fungal biomass (see Gessner and Newell 2002 for a review). Ergosterol quantification is determined by high performance liquid chromatography (HPLC) after lipid extraction in alkaline methanol and purification by solid-phase extraction. Then, it can be converted to fungal biomass by using a conversion factor of 5.5 mg ergosterol per g fungal dry mass, based on estimates with different fungal species (Gessner and Chauvet 1993).
There are other methods to quantify fungal biomass, but they have some disadvantages comparing to ergosterol quantification. For example, the determination of chitin, a cell-wall component of fungi, cannot distinguish dead and live fungal biomass (Newell 1992); and the quantification of ATP is not specific for fungi because it occurs in all living cells (Suberkropp et al 1993).
Microbial activity associated with decomposing leaves has been widely estimated by measuring the respiration rates of microorganisms (Graça and Abelho 2005). However, the main disadvantage of this method is the difficulty to distinguish the contribution of fungi from that of bacteria to the total respiration rate, even in the presence of selective inhibitors of each microbial group (Padgett 1993).
A better approach to determine microbial activity is measuring the incorporation rates of radiolabeled compounds into their biomolecules (acetate in ergosterol for fungi; and thymidine in DNA or leucine in proteins for bacteria), assuming that the rate of synthesis of these biomolecules is directly proportional to cell growth (Suberkropp and Weyers 1996, Pascoal and Cássio 2004, Suberkropp and Gessner 2005).
Fungi are able to channelize a significant portion of its biomass to the production of asexual spores (Bärlocher 2005c), suggesting that sporulation rates can also be used as a
10
measure of fungal activity. However, although good correlations between fungal biomass and sporulation have been reported (Suberkropp 1991), high sporulation rates does not always imply high fungal biomasses (Bermingham et al 1997) and, contrarily to fungal mycelium, spores are not participating in substrate decomposition before its germination.
1.6.3. Fungal diversity
Aquatic hyphomycetes are a group of fungi with great diversity (Shearer et al 2007). Since their discovery by Ingold much of the information about their diversity has been assessed by the identification of their characteristic conidia (Bärlocher 2005c). The production of conidia is stimulated in laboratorial conditions, by aeration of colonized plant material in stream water, for approximately two days, and after that the released conidia are trapped on a filter with adequate pore size, stained and identified under a light microscope (Bärlocher 2005c). However, because the identification of fungal species is based on observation of conidia released, taxa that are not sporulating can be missed (Nikolcheva et al 2005) underestimating fungal diversity.
Other methodologies were developed to assess aquatic hyphomycete diversity. The use of monoclonal antibodies allows the localization and quantification of specific species on substrates through immunofluorescence, but their highly specificity limits their use in ecological purposes (Bermingham et al 2001). Another technique is the fluorescent in situ hybridization (FISH), in which the target cells are hybridized with fluorescent labeled oligonucleotide probes and quantified by epifluorescence microscopy (McArthur et al 2001). However, the autofluorescence of hyphae and substrates limits its use (McArthur et al 2001).
Community fingerprinting techniques, such as terminal restriction fragment length polymorfism (T-RFLP) (Muyzer et al 1993) and denaturing gradient gel electrophoresis (DGGE) (Nikolcheva and Bärlocher 2005, Nikolcheva et al 2003, 2005), are based in the amplification, via polymerase chain reaction (PCR), of DNA extracted from mixed populations and further discrimination of such populations. However, these DNA fingerprinting techniques depend on PCR, which is associated with some shortcoming as amplification errors, formation of chimeric and heteroduplex molecules and preferential amplification (von Wintzingerode et al 1997), variable DNA extraction
11
efficiencies (Theron and Cloete 2000), and possible introduction of DNA contaminants during DNA isolation and amplification (Muyzer et al 2004).
More recently, the quantitative real time PCR (Q-RT-PCR) was used to assess archaea, bacteria, and fungi during leaf decomposition in a stream (Manerkar et al 2008). However, there is uncertainty in the number of rRNA operon copies per fungal cells on most species making the accurate quantification of species difficult (Manerkar et al 2008). Still, this technique was recently applied to discriminate the contribution of aquatic fungal species to leaf decomposition (Fernandes et al 2011). Clone libraries can be also useful to assess fungal diversity; this approach was applied to fungal communities from hyporheic zone (Bärlocher et al 2007) and on decomposing leaves in streams (Seena et al 2008). However, this technique is expensive, time consuming and errors during the extraction, amplification and cloning processes may occur (von Wintzingerode et al 1997).
1.7. Plant-litter decomposition under anthropogenic stress
Human activities have contributed to an increase in freshwater ecosystem degradation, affecting biotic communities and ecological processes (Vitousek et al 1997, Dudgeon et al 2006). Nutrient loading is among the most common threats to these ecosystems and have significant effects in important ecological processes, such as plant-litter decomposition, with implications for food web dynamics (Allan and Castillo 2007). Nutrient loading is mainly caused by nonpoint sources of pollution, due to the use of fertilizers in agriculture and animal wastes from cattle breeding, increasing phosphorus and nitrogen content in the stream water (Allan and Castillo 2007). Urban zones are also an important source of nutrients and contaminants due to municipal wastes (Allan and Castillo 2007).
Field and microcosm experiments revealed that plant-litter decomposition is stimulated by nitrogen and phosphorous enrichment (Pascoal et al 2001, 2003, Gulis and Suberkropp 2003a, b, Duarte et al 2009, but see Abelho and Graça 2006). This increase in leaf decomposition is mainly due to the increased activity of microorganisms (Gulis and Suberkropp 2003a, b, Pascoal and Cássio 2004, Duarte et al 2009). Fungal diversity is also reported to be stimulated by nutrient enrichment (Gulis and Suberkropp 2003a, b, Artigas et al 2008).
12
Some studies reported that nutrient enrichment leads to increased macroinvertebrate density and to higher breakdown rates, but not to higher macroinvertebrate diversity (Pascoal et al 2003, 2005a, Greenwood et al 2007). However, nitrate enrichment did not stimulate density or diversity of macroinvertebrates in a whole-stream addition experiment (Ferreira et al 2006).
Although organic and inorganic loads are reported to stimulate litter decomposition through increased microbial activity, a reduction in fungal diversity and reproduction often occurs (Pascoal and Cássio 2004, Duarte et al 2009). However, there is generally sufficient redundancy among aquatic fungi to maintaining leaf decomposition (Au et al 1992a, b, Raviraja et al 1998). Additionally, in some streams with high nutrient concentration, low dissolved oxygen and high sedimentation both fungal activity and litter decomposition may be depressed (Pascoal and Cássio 2004, Duarte et al 2009). This suggests that other stream water parameters may counteract the positive effects of nutrient enrichment on litter decomposers (Pascoal and Cássio 2004, Duarte et al 2009).
Riparian vegetation alteration and deforestation is one phenomenon occurring worldwide that drives changes in biological communities and ecological processes (Sala et al 2000). This phenomenon is increasing due to human population growth and needs for agricultural and urbanization areas that are constructed near water lines (Allan and Castillo 2007). Riparian vegetation zones are important to stream functioning because they are very productive areas supporting high biodiversity; they can prevent nutrient runoff from surrounding exposed soils and mitigate the effects of floods (Allan and Castillo 2007). Thus, clear cutting riparian vegetation or changing the tree species can lead to changes in water chemistry, temperature, hydrology, streambed morphology, amount of sunlight that reaches the water, and quality and quantity of litter inputs to streams (Webster et al 1990, Sweeney et al 2004). As a consequence, these factors affect stream biological communities (Wallace et al 1997, Wallace et al 1999, Sweeney et al 2004, Thompson et al 2009, Zhang et al 2009).
Several studies report that decomposition of submerged leaf litter can be altered by forest management practices (Lecerf et al 2005, Kreutzweiser et al 2008, Riipinen et al 2010, McKie and Malmqvist 2009, Lecerf and Richardson 2010). The effects on decomposition rates are mainly due to a decrease in shredder density, and minor effects have been found on microbial decomposers (Kreutzweiser et al 2008, Lecerf and Richardson 2010). However, a decrease in fungal diversity and community alterations were reported in reaches suffering from clear cutting or tree species composition change
13
(Bärlocher and Graça 2002, Lecerf and Richardson 2010). Moreover, fungal communities differed between streams bordered by eucalypt (exotic species) and native deciduous forests, but no differences in breakdown rates were found (Bärlocher and Graça 2002). These results suggest that aquatic fungal communities, even with reduced diversity can maintain key ecological processes in freshwaters, such as plant-litter decomposition (Bärlocher and Graça 2002, Lecerf and Richardson 2010).
1.8. Litter quality in plant-litter decomposition
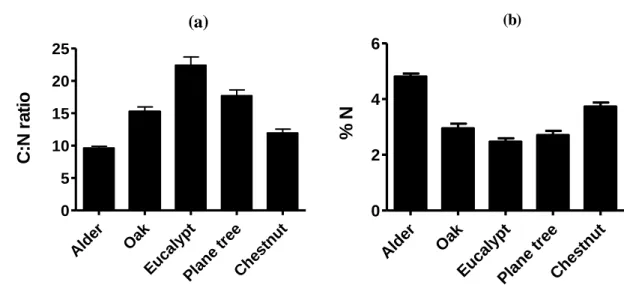
The composition variability of different leaf species is one of the most extensively studied aspects of leaf breakdown (Webster and Benfield 1986, Hladyz et al 2009). Generally, leaves can be classified based on their decomposition rates, being the differences in decomposition velocity due to the leaf chemistry (Petersen and Cummins 1974). Main differences in leaf chemistry are due to the abundance of essential nutrients in the leaf tissue, especially nitrogen and phosphorus; the presence of lignin and other recalcitrant polymers constituents of plant cell walls, such as waxes, cutins and tannins; and the presence of chemical inhibitors, such as cinnamic acids (Webster and Benfield 1986).
Because nutrient content of leaves is an important driver of leaf breakdown, two characteristics of leaves have been traditionally used to predict leaf breakdown: the percentage of nitrogen and the C:N ratio (Kaushik and Hynes 1971, Petersen and Cummins 1974). It has been reported that leaf breakdown is positively correlated with nitrogen content and negatively correlated with C:N ratio of leaves (Kaushik and Hynes 1971, Petersen and Cummins 1974) making these measures good predictors of litter breakdown.
However, some studies failed to show these correlations (Richardson et al 2004, Hladyz et al 2009, Gessner and Chauvet 1994, Royer and Minshall 2001, Lecerf and Chauvet 2008) probably because those predictions were based in the assumption that fungi growing on decaying leaves only obtain nitrogen from the leaf itself. Fungi are able to obtain nutrients both from leaves and the water column (Suberkropp 1995, Gessner and Chauvet 1994, Suberkropp and Chauvet 1995), which limits the use of these predictors in streams where leaf breakdown is not limited by dissolved nutrients (Suberkropp 1995, Gessner and Chauvet 1994, Suberkropp and Chauvet 1995, Royer
14
and Minshall 2001). Moreover, there is great intraspecific variability in litter quality due to geographical provenience of plants, which may have implications in ecosystem processes such as leaf litter decomposition (Lecerf and Chauvet 2008).
Lignin has also been reported to be a good predictor of leaf breakdown rates (Gessner and Chauvet 1994, Royer and Minshall 2001). Lignin is a component of leaves that is slowly degraded because is often intertwined with cellulose. In some streams where nutrients are not limiting, the amount of lignin and carbon that occur as lignin are more accurate predictors of leaf breakdown rates than are nitrogen content or C:N ratio (Gessner and Chauvet 1994, Royer and Minshall 2001). These results indicate that lignin-based measures might be accurate predictors of leaf breakdown rates in streams not experiencing nutrient limitations.
1.9. Aim and outline of the thesis
In low-order forested streams, plant-litter decomposition is a key ecosystem process linking the riparian vegetation, microbial and invertebrate activity and environmental factors. Microorganisms in freshwaters, particularly aquatic fungi, are important components of food webs mineralizing organic matter that becomes available to invertebrates and higher trophic levels. Nutrient loads from agriculture and urban sewages are a major threat to freshwater ecosystems. The aim of this project was to examine the effects of stream eutrophication on microbial diversity and on decomposition of leaf litter with different nutritional value. For that, we immersed five leaf types in seven streams along a gradient of eutrophication. The diversity, reproduction and biomass of microbial decomposers and leaf-litter decomposition were examined to better understand the mechanisms by which leaf decomposition responds to water-quality degradation.
15
2. Material and methods
2.1. Study area
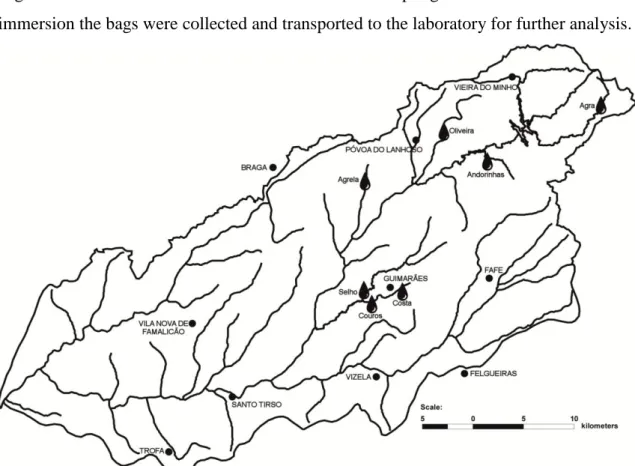
The Ave River, located in Northwest Portugal, has its source in the Cabreira Mountain and flows about 98 km in east-west direction to the Atlantic Ocean. This river has a drainage area of 1388 km2 in a region with high demographic density and several industrial activities that have developed over the last 40 years, mainly textile, electroplating, tannery and metalworking industries (Agência de Desenvolvimento Regional do Vale do Ave – ADRAVE 2010). In the past, urban and industrial wastes produced in the Vale do Ave region were discharged into the Ave River and main tributaries, leading to the accumulation of significant amounts of metals in the river sediments (Soares et al 1999). However, a decrease in metal contamination has been observed in the last years (Alves et al 2009), due to the implementation of programs for pollution control.
Seven sampling sites were selected in the Ave River basin (Fig. 1), with the stream order varying from two to four. Stream substrates were mostly constituted by sand, blocks and pebbles. The riparian forest in the Ave River catchment has been severely modified by human activities with the presence of exotic riparian species, such as
Eucalyptus sp. and Acacia sp. Nevertheless, at sampling sites, few exotic species were
found and riparian forest consisted mainly of alder, oak, chestnut, poplar, vines, shrubs and brambles. In some of the selected streams high levels of riparian deforestation were recorded with farmlands found along several kilometers of the streams.
2.2. Leaf bags
This study started on 10 November 2010 and ran over 5 weeks. Leaves of alder (Alnus glutinosa (L.) Gaertn), chestnut (Castanea sativa Mill), eucalypt (Eucalyptus
globulus Labill), plane tree (Platanus sp.) and oak (Quercus robur L.) were collected
just before abscission, air-dried, weighed into 4-g groups and placed, individually, in coarse-mesh bags (5 mm mesh), with four replicates for each treatment. A total of 140
16
bags were sealed and distributed at the seven sampling sites. After 5 weeks of immersion the bags were collected and transported to the laboratory for further analysis.
Figure 1 – Location of the sampling sites (drop symbol) and main towns in the Ave River basin.
2.3. Physical and chemical analyses of the stream water
During the study period, temperature, pH, redox potential, conductivity and dissolved oxygen in the stream water were measured in situ with field probes (Multiline F/set 3 no. 400327, WTW). Samples of the stream water were collected in plastic bottles, transported in a cool box (4 ºC) to the laboratory and analyzed within 24 h. A HACH DR/2000 spectrophotometer (Hach Company, Loveland, CO, USA) was used for quantification of nitrate concentration by the cadmium reduction method (measurable range: 0-0.4 mg/l and 0-30 mg/l N-NO3-), ammonium concentration by the salicylate method (measurable range: 0-0.5 mg/l N-NH3), nitrite concentration by the diazotization method (measurable range: 0-0.3 mg/l N-NO2-) and phosphate concentration by the ascorbic acid method (measurable range: 0-2.5 mg/l PO43-), according to HACH procedures manual.
17
2.4. Leaf mass loss
The leaves were collected from the bags, rinsed with deionized water to remove the sediments and adhering invertebrates. Subsamples of leaf material were used to analyze fungal biomass and to induce fungal sporulation. The remaining leaf material was freeze-dried and weighed to the nearest 0.001 g.
2.5. Litter chemistry
To analyze the carbon (C) and nitrogen (N) contents in the leaf litter, a minimum of 100 mg of leaf mass was used. The nutrients were measured with an Elemental Analyzer (LECO-CNS 2000) at the Centro de Apoio Científico e Tecnolóxico á Investigación (CACTI) in the University of Vigo, Spain.
2.6. Fungal sporulation and biomass
Fungal sporulation was induced by aeration of 5 leaf discs (12 mm diameter) from each mesh bag in 75 ml of stream water for 48 ± 4 h at 16 ºC. Conidial suspensions were mixed with 0.5 % triton X-100 and appropriate volumes of each replicate were filtered through a membrane (Millipore, 0.45 µm pore size). Spores retained on the filters were stained with cotton blue in lactic acid, and at least 300 spores were counted and identified under a light microscope (400 ×). Sporulation rates were calculated as number of conidia released per gram (dry mass) of decomposing leaves per day.
Fungal biomass was estimated from ergosterol concentration on leaves (Gessner 2005). Sets of five leaf disks were placed in 8 g/l K-OH methanol and heated (80 ºC for 30 min) for lipid extraction. The ergosterol was purified by solid phase extraction and quantified by high performance liquid chromatography (Beckman Gold System).
18
2.7. Data analysis
Ordination of the spatial gradient according to the stream water variables was done using Principal Component Analysis (PCA) after standardization of the variables (Legendre and Legendre 1998). Physical and chemical parameters were compared between streams using One-way Analysis of Variance (ANOVA) and post hoc comparisons (Tukey’s HSD). The distribution of aquatic fungal communities associated with leaves was analyzed by Non-metric-Multi Dimensional Scaling Analysis (NmMDS; Legendre and Legendre 1998). The contribution of stream water variables to the ordination of fungal communities on leaves in the 7 streams was done using a Canonical Correspondence Analysis (CCA) after standardization of the variables (Legendre and Legendre 1998). Analyses were based on the average value for sporulation rates of the aquatic hyphomycetes associated with leaves at each site.
Two-way Analysis of Variance (ANOVA) and post hoc comparisons (Tukey’s HSD) were used to test if stream site and leaf type significantly affected leaf decomposition, fungal diversity, biomass and sporulation (Zar 1996). To achieve normal distributions, data for fungal diversity, biomass and sporulation were ln (x+1) transformed, while the percentage of leaf mass loss was arcsine square root transformed (Zar 1996).
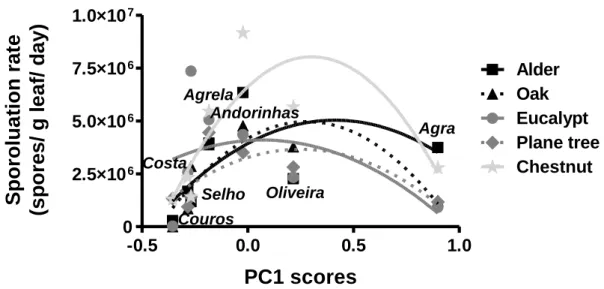
A second order polynomial regression was used to fit data of fungal diversity, biomass and sporulation of the five leaf types against the PC scores defined by the axis 1 of the PCA.
A t-test was used to test if differences between final and initial C:N ratio, for all leaf types, equaled zero. A One-way ANOVA and post hoc comparisons (Tukey’s HSD) were used to detect differences in N content and C:N ratio between leaf types.
A linear regression was used to describe the relationship between leaf N content and leaf breakdown, and a negative exponential function was used to describe the relationship between C:N ratio and leaf breakdown.
Multivariate analyses were done with the statistical package CANOCO 4.5. All univariate analyses were performed using the statistical package Statistica 8.
19
3. Results
3.1. Physical and chemical characteristics of stream water
Stream water temperature ranged from 8.9 ºC in Agra Stream and 14.6 ºC in Couros Stream, and was similar among the sampling sites (One-way ANOVA, Tukey’s post hoc test, P > 0.05; Table 1). Agra Stream had the lowest value of pH (One-way ANOVA, Tukey’s post hoc test, P < 0.05; Table 1) and the highest value of redox potential (One-way ANOVA, Tukey’s post hoc test, P < 0.05; Table 1). Couros Stream had lower dissolved oxygen, higher levels of conductivity, and higher concentrations of ammonium and nitrite than all other streams (One-way ANOVAs, Tukey’s post hoc tests, P < 0.05; Table 1). The concentration of phosphate was higher in Couros Stream, followed by Selho River (One-way ANOVA, Tukey’s post hoc test, P < 0.05; Table 1). The concentration of nitrates was higher in Agrela Stream, Couros Stream and Selho River than in the other streams (One-way ANOVA, Tukey’s post hoc test, P < 0.05; Table 1).
Table 1 – Physical and chemical parameters of stream water at each sampling site of the Ave River basin during the study period. Data represent mean values ± SEM (n = 3).
* Only one value available.
Sampling sites Agra Stream Oliveira Stream Andorinhas Stream Agrela Stream Selho River Costa Stream Couros Stream Longitude N (º) 41.60979 41.58630 41.56979 41.54175 41.43809 41.44827 41.43741 Latitude W (º) 8.03883 8.22513 8.17704 8.31950 8.32253 8.27634 8.32175 Elevation (m) 776 232 210 269 149 218 149 Temperature (ºC) 8.9 ± 2.3 11.6 ± 2.2 12.1 ± 2.1 12.7 ± 1.1 12.9 ± 0.7 13.9 ± 1.1 14.6 ± 1.1 pH 5.30 ± 0.24 6.64 ± 0.21 6.55 ± 0.09 6.60 ± 0.29 6.91 ± 0.04 6.70* 7.23 ± 0.06 Redox potential (mV) 72.5 ± 13.4 0.5 ± 14.0 5.0 ± 11.0 6.7 ± 21.8 -14.0 ± 7.0 -6.0* -31.0 ± 8.0 Dissolved O2 (mg/l) 11.19 ± 0.28 11.11 ± 0.50 10.21 ± 0.42 10.25 ± 0.16 9.95 ± 0.11 9.81 ± 0.91 5.94 ± 0.19 Conductivity (µS/cm) 16 ± 1 39 ± 1 59 ± 3 97 ± 6 154 ± 20 182 ± 14 324 ± 23 N-NH3 (mg/l) 0.01 ± 0.01 0.06 ± 0.04 0.01 ± 0.01 0.02 ± 0.02 0.37 ± 0.12 0.34 ± 0.29 3.65 ± 0.65 N-NO2 (mg/l) 0.005 ± 0.001 0.005 ± 0.001 0.005 ± 0.001 0.006 ± 0.002 0.026 ± 0.013 0.026 ± 0.018 0.175 ± 0.008 N-NO3 (mg/l) 0.16 ± 0.04 0.77 ± 0.15 1.20 ± 0.24 3.37 ± 0.21 3.00* 1.90* 3.20* P-PO43- (mg/l) 0.01 ± 0.002 0.01 ± 0.002 0.01 ± 0.002 0.01 ± 0.006 0.06 ± 0.001 0.01 ± 0.002 0.27 ± 0.015
20
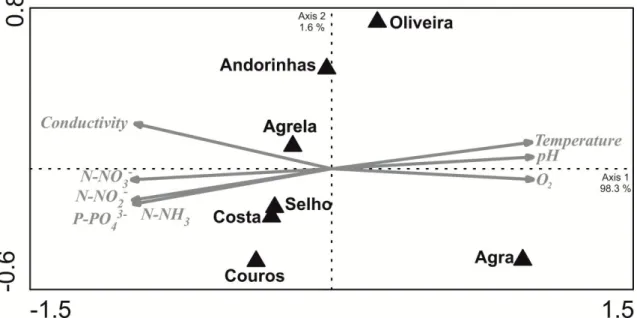
The PCA ordination of the physical and chemical stream water variables shows that dissolved oxygen, temperature and pH were positively correlated with the first PCA axis, which explains 98.3 % of total variance, while all the other variables indicative of eutrophication were negatively correlated with this axis (Fig. 2). PCA ordination of the sampling sites indicated an eutrophication gradient as follows: Agra Stream < Oliveira Stream < Andorinhas Stream < Agrela Stream < Selho River < Costa Stream < Couros Stream (Fig. 2).
Figure 2 – Principal component analysis (PCA) of selected stream water variables at seven sampling sites in the Ave River basin during the study period.
3.2. Fungal communities
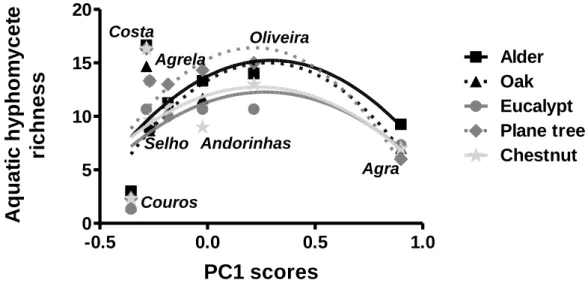
A total of 44 aquatic hyphomycete species were found sporulating on leaves at the seven sampling streams (Table 2). The maximum values of fungal taxon richness were found in the Costa Stream with 21 species sporulating on alder leaves, while the minimum values were attained in the Couros Stream with 2 fungal species sporulating on oak and eucalypt leaves (Fig. 3; Table 2). Leaf type and stream significantly affected fungal diversity (Two-way ANOVA, P < 0.05; Table 3). Fungal taxon richness was higher in moderately high eutrophic streams (Costa Stream) and moderate eutrophic streams (Oliveira, Andorinhas and Agrela streams) than in the oligotrophic (Agra Stream) or hypertrophic streams (Couros Stream) (Two-way ANOVA, Tukey’s post hoc test, P < 0.05; Fig. 3). Fungal taxon richness was higher in plane tree and alder
21
leaves and lower in chestnut leaves (Two-way ANOVA, Tukey’s post hoc test, P < 0.05; Fig. 3). A second order polynomial regression described the relationship between fungal taxon richness on leaves and the gradient of eutrophication defined by the PC1 scores of the stream water variables (Fig. 3). The best data fit was found for fungi on plane tree and oak leaves.
-0.5 0.0 0.5 1.0 0 5 10 15 20 Agra Oliveira Andorinhas Agrela Selho Costa Couros Alder Oak Eucalypt Plane tree Chestnut
PC1 scores
Aq
ua
ti
c
h
y
p
h
om
y
c
e
te
ri
c
h
n
e
s
s
Figure 3 – Taxon richness of sporulating aquatic hyphomycetes on five leaf types (alder, oak, eucalypt, plane tree and chestnut) immersed in seven streams of the Ave River basin against the eutrophication gradient defined by axis 1 of the PCA. The lines represent a second order polynomial regression. Alder –
r2 = 0.2894, oak – r2 = 0.4492, eucalypt – r2 = 0.2483, plane tree – r2 = 0.4548, chestnut – r2 = 0.1849.
Values represent mean ± SEM (n=4).
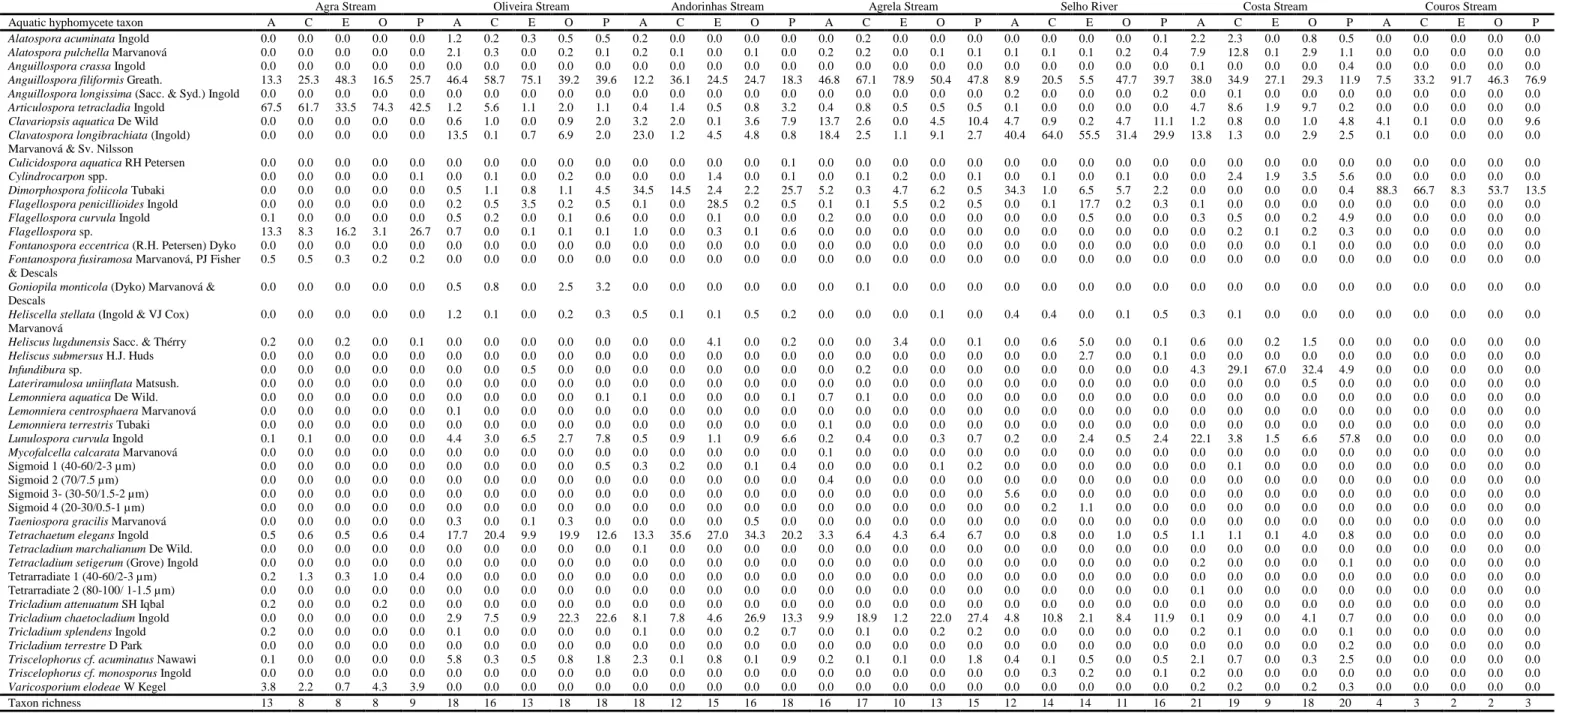
The fungal species that most contributed to conidial production varied with the stream and the leaf type, except for Anguillospora filiformis, which was among the dominant species on all leaves and streams (Table 2). Articulospora tetracladia was dominant on leaves in the most oligotrophic stream (Agra Stream). Also, Flagellospora sp. was abundant in the oligotrophic stream (Agra Stream) and its contribution decreased in moderate eutrophic streams until disappearing in the most eutrophic streams. Dimorphospora foliicola was dominant in moderate (Andorinhas Stream), moderately-high (Selho River) and hypertrophic streams (Couros Stream) (Table 2).
Other abundant species in moderate eutrophic streams were: Tetrachaetum elegans and Tricladium chaetocladium (Oliveira, Andorinhas and Agrela streams),
Clavatospora longibrachiata (Agrela Stream and Selho River), and Clavariopsis aquatica (Agrela Stream) (Table 2).
22
Table 2 – Mean percentage of contribution of aquatic hyphomycete species to the total conidial production on five plant species immersed in seven streams in the Ave River basin. Letters are abbreviations of leaf types: A – alder, C – chestnut, E – eucalypt, O – oak and P – plane tree.
Agra Stream Oliveira Stream Andorinhas Stream Agrela Stream Selho River Costa Stream Couros Stream
Aquatic hyphomycete taxon A C E O P A C E O P A C E O P A C E O P A C E O P A C E O P A C E O P
Alatospora acuminata Ingold 0.0 0.0 0.0 0.0 0.0 1.2 0.2 0.3 0.5 0.5 0.2 0.0 0.0 0.0 0.0 0.0 0.2 0.0 0.0 0.0 0.0 0.0 0.0 0.0 0.1 2.2 2.3 0.0 0.8 0.5 0.0 0.0 0.0 0.0 0.0 Alatospora pulchella Marvanová 0.0 0.0 0.0 0.0 0.0 2.1 0.3 0.0 0.2 0.1 0.2 0.1 0.0 0.1 0.0 0.2 0.2 0.0 0.1 0.1 0.1 0.1 0.1 0.2 0.4 7.9 12.8 0.1 2.9 1.1 0.0 0.0 0.0 0.0 0.0 Anguillospora crassa Ingold 0.0 0.0 0.0 0.0 0.0 0.0 0.0 0.0 0.0 0.0 0.0 0.0 0.0 0.0 0.0 0.0 0.0 0.0 0.0 0.0 0.0 0.0 0.0 0.0 0.0 0.1 0.0 0.0 0.0 0.4 0.0 0.0 0.0 0.0 0.0 Anguillospora filiformis Greath. 13.3 25.3 48.3 16.5 25.7 46.4 58.7 75.1 39.2 39.6 12.2 36.1 24.5 24.7 18.3 46.8 67.1 78.9 50.4 47.8 8.9 20.5 5.5 47.7 39.7 38.0 34.9 27.1 29.3 11.9 7.5 33.2 91.7 46.3 76.9 Anguillospora longissima (Sacc. & Syd.) Ingold 0.0 0.0 0.0 0.0 0.0 0.0 0.0 0.0 0.0 0.0 0.0 0.0 0.0 0.0 0.0 0.0 0.0 0.0 0.0 0.0 0.2 0.0 0.0 0.0 0.2 0.0 0.1 0.0 0.0 0.0 0.0 0.0 0.0 0.0 0.0 Articulospora tetracladia Ingold 67.5 61.7 33.5 74.3 42.5 1.2 5.6 1.1 2.0 1.1 0.4 1.4 0.5 0.8 3.2 0.4 0.8 0.5 0.5 0.5 0.1 0.0 0.0 0.0 0.0 4.7 8.6 1.9 9.7 0.2 0.0 0.0 0.0 0.0 0.0 Clavariopsis aquatica De Wild 0.0 0.0 0.0 0.0 0.0 0.6 1.0 0.0 0.9 2.0 3.2 2.0 0.1 3.6 7.9 13.7 2.6 0.0 4.5 10.4 4.7 0.9 0.2 4.7 11.1 1.2 0.8 0.0 1.0 4.8 4.1 0.1 0.0 0.0 9.6 Clavatospora longibrachiata (Ingold)
Marvanová & Sv. Nilsson
0.0 0.0 0.0 0.0 0.0 13.5 0.1 0.7 6.9 2.0 23.0 1.2 4.5 4.8 0.8 18.4 2.5 1.1 9.1 2.7 40.4 64.0 55.5 31.4 29.9 13.8 1.3 0.0 2.9 2.5 0.1 0.0 0.0 0.0 0.0
Culicidospora aquatica RH Petersen 0.0 0.0 0.0 0.0 0.0 0.0 0.0 0.0 0.0 0.0 0.0 0.0 0.0 0.0 0.1 0.0 0.0 0.0 0.0 0.0 0.0 0.0 0.0 0.0 0.0 0.0 0.0 0.0 0.0 0.0 0.0 0.0 0.0 0.0 0.0 Cylindrocarpon spp. 0.0 0.0 0.0 0.0 0.1 0.0 0.1 0.0 0.2 0.0 0.0 0.0 1.4 0.0 0.1 0.0 0.1 0.2 0.0 0.1 0.0 0.1 0.0 0.1 0.0 0.0 2.4 1.9 3.5 5.6 0.0 0.0 0.0 0.0 0.0 Dimorphospora foliicola Tubaki 0.0 0.0 0.0 0.0 0.0 0.5 1.1 0.8 1.1 4.5 34.5 14.5 2.4 2.2 25.7 5.2 0.3 4.7 6.2 0.5 34.3 1.0 6.5 5.7 2.2 0.0 0.0 0.0 0.0 0.4 88.3 66.7 8.3 53.7 13.5 Flagellospora penicillioides Ingold 0.0 0.0 0.0 0.0 0.0 0.2 0.5 3.5 0.2 0.5 0.1 0.0 28.5 0.2 0.5 0.1 0.1 5.5 0.2 0.5 0.0 0.1 17.7 0.2 0.3 0.1 0.0 0.0 0.0 0.0 0.0 0.0 0.0 0.0 0.0 Flagellospora curvula Ingold 0.1 0.0 0.0 0.0 0.0 0.5 0.2 0.0 0.1 0.6 0.0 0.0 0.1 0.0 0.0 0.2 0.0 0.0 0.0 0.0 0.0 0.0 0.5 0.0 0.0 0.3 0.5 0.0 0.2 4.9 0.0 0.0 0.0 0.0 0.0 Flagellospora sp. 13.3 8.3 16.2 3.1 26.7 0.7 0.0 0.1 0.1 0.1 1.0 0.0 0.3 0.1 0.6 0.0 0.0 0.0 0.0 0.0 0.0 0.0 0.0 0.0 0.0 0.0 0.2 0.1 0.2 0.3 0.0 0.0 0.0 0.0 0.0 Fontanospora eccentrica (R.H. Petersen) Dyko 0.0 0.0 0.0 0.0 0.0 0.0 0.0 0.0 0.0 0.0 0.0 0.0 0.0 0.0 0.0 0.0 0.0 0.0 0.0 0.0 0.0 0.0 0.0 0.0 0.0 0.0 0.0 0.0 0.1 0.0 0.0 0.0 0.0 0.0 0.0 Fontanospora fusiramosa Marvanová, PJ Fisher
& Descals
0.5 0.5 0.3 0.2 0.2 0.0 0.0 0.0 0.0 0.0 0.0 0.0 0.0 0.0 0.0 0.0 0.0 0.0 0.0 0.0 0.0 0.0 0.0 0.0 0.0 0.0 0.0 0.0 0.0 0.0 0.0 0.0 0.0 0.0 0.0
Goniopila monticola (Dyko) Marvanová & Descals
0.0 0.0 0.0 0.0 0.0 0.5 0.8 0.0 2.5 3.2 0.0 0.0 0.0 0.0 0.0 0.0 0.1 0.0 0.0 0.0 0.0 0.0 0.0 0.0 0.0 0.0 0.0 0.0 0.0 0.0 0.0 0.0 0.0 0.0 0.0
Heliscella stellata (Ingold & VJ Cox) Marvanová
0.0 0.0 0.0 0.0 0.0 1.2 0.1 0.0 0.2 0.3 0.5 0.1 0.1 0.5 0.2 0.0 0.0 0.0 0.1 0.0 0.4 0.4 0.0 0.1 0.5 0.3 0.1 0.0 0.0 0.0 0.0 0.0 0.0 0.0 0.0
Heliscus lugdunensis Sacc. & Thérry 0.2 0.0 0.2 0.0 0.1 0.0 0.0 0.0 0.0 0.0 0.0 0.0 4.1 0.0 0.2 0.0 0.0 3.4 0.0 0.1 0.0 0.6 5.0 0.0 0.1 0.6 0.0 0.2 1.5 0.0 0.0 0.0 0.0 0.0 0.0 Heliscus submersus H.J. Huds 0.0 0.0 0.0 0.0 0.0 0.0 0.0 0.0 0.0 0.0 0.0 0.0 0.0 0.0 0.0 0.0 0.0 0.0 0.0 0.0 0.0 0.0 2.7 0.0 0.1 0.0 0.0 0.0 0.0 0.0 0.0 0.0 0.0 0.0 0.0 Infundibura sp. 0.0 0.0 0.0 0.0 0.0 0.0 0.0 0.5 0.0 0.0 0.0 0.0 0.0 0.0 0.0 0.0 0.2 0.0 0.0 0.0 0.0 0.0 0.0 0.0 0.0 4.3 29.1 67.0 32.4 4.9 0.0 0.0 0.0 0.0 0.0 Lateriramulosa uniinflata Matsush. 0.0 0.0 0.0 0.0 0.0 0.0 0.0 0.0 0.0 0.0 0.0 0.0 0.0 0.0 0.0 0.0 0.0 0.0 0.0 0.0 0.0 0.0 0.0 0.0 0.0 0.0 0.0 0.0 0.5 0.0 0.0 0.0 0.0 0.0 0.0 Lemonniera aquatica De Wild. 0.0 0.0 0.0 0.0 0.0 0.0 0.0 0.0 0.0 0.1 0.1 0.0 0.0 0.0 0.1 0.7 0.1 0.0 0.0 0.0 0.0 0.0 0.0 0.0 0.0 0.0 0.0 0.0 0.0 0.0 0.0 0.0 0.0 0.0 0.0 Lemonniera centrosphaera Marvanová 0.0 0.0 0.0 0.0 0.0 0.1 0.0 0.0 0.0 0.0 0.0 0.0 0.0 0.0 0.0 0.0 0.0 0.0 0.0 0.0 0.0 0.0 0.0 0.0 0.0 0.0 0.0 0.0 0.0 0.0 0.0 0.0 0.0 0.0 0.0 Lemonniera terrestris Tubaki 0.0 0.0 0.0 0.0 0.0 0.0 0.0 0.0 0.0 0.0 0.0 0.0 0.0 0.0 0.0 0.1 0.0 0.0 0.0 0.0 0.0 0.0 0.0 0.0 0.0 0.0 0.0 0.0 0.0 0.0 0.0 0.0 0.0 0.0 0.0 Lunulospora curvula Ingold 0.1 0.1 0.0 0.0 0.0 4.4 3.0 6.5 2.7 7.8 0.5 0.9 1.1 0.9 6.6 0.2 0.4 0.0 0.3 0.7 0.2 0.0 2.4 0.5 2.4 22.1 3.8 1.5 6.6 57.8 0.0 0.0 0.0 0.0 0.0 Mycofalcella calcarata Marvanová 0.0 0.0 0.0 0.0 0.0 0.0 0.0 0.0 0.0 0.0 0.0 0.0 0.0 0.0 0.0 0.1 0.0 0.0 0.0 0.0 0.0 0.0 0.0 0.0 0.0 0.0 0.0 0.0 0.0 0.0 0.0 0.0 0.0 0.0 0.0
Sigmoid 1 (40-60/2-3 µm) 0.0 0.0 0.0 0.0 0.0 0.0 0.0 0.0 0.0 0.5 0.3 0.2 0.0 0.1 0.4 0.0 0.0 0.0 0.1 0.2 0.0 0.0 0.0 0.0 0.0 0.0 0.1 0.0 0.0 0.0 0.0 0.0 0.0 0.0 0.0
Sigmoid 2 (70/7.5 µm) 0.0 0.0 0.0 0.0 0.0 0.0 0.0 0.0 0.0 0.0 0.0 0.0 0.0 0.0 0.0 0.4 0.0 0.0 0.0 0.0 0.0 0.0 0.0 0.0 0.0 0.0 0.0 0.0 0.0 0.0 0.0 0.0 0.0 0.0 0.0
Sigmoid 3- (30-50/1.5-2 µm) 0.0 0.0 0.0 0.0 0.0 0.0 0.0 0.0 0.0 0.0 0.0 0.0 0.0 0.0 0.0 0.0 0.0 0.0 0.0 0.0 5.6 0.0 0.0 0.0 0.0 0.0 0.0 0.0 0.0 0.0 0.0 0.0 0.0 0.0 0.0
Sigmoid 4 (20-30/0.5-1 µm) 0.0 0.0 0.0 0.0 0.0 0.0 0.0 0.0 0.0 0.0 0.0 0.0 0.0 0.0 0.0 0.0 0.0 0.0 0.0 0.0 0.0 0.2 1.1 0.0 0.0 0.0 0.0 0.0 0.0 0.0 0.0 0.0 0.0 0.0 0.0
Taeniospora gracilis Marvanová 0.0 0.0 0.0 0.0 0.0 0.3 0.0 0.1 0.3 0.0 0.0 0.0 0.0 0.5 0.0 0.0 0.0 0.0 0.0 0.0 0.0 0.0 0.0 0.0 0.0 0.0 0.0 0.0 0.0 0.0 0.0 0.0 0.0 0.0 0.0 Tetrachaetum elegans Ingold 0.5 0.6 0.5 0.6 0.4 17.7 20.4 9.9 19.9 12.6 13.3 35.6 27.0 34.3 20.2 3.3 6.4 4.3 6.4 6.7 0.0 0.8 0.0 1.0 0.5 1.1 1.1 0.1 4.0 0.8 0.0 0.0 0.0 0.0 0.0 Tetracladium marchalianum De Wild. 0.0 0.0 0.0 0.0 0.0 0.0 0.0 0.0 0.0 0.0 0.1 0.0 0.0 0.0 0.0 0.0 0.0 0.0 0.0 0.0 0.0 0.0 0.0 0.0 0.0 0.0 0.0 0.0 0.0 0.0 0.0 0.0 0.0 0.0 0.0 Tetracladium setigerum (Grove) Ingold 0.0 0.0 0.0 0.0 0.0 0.0 0.0 0.0 0.0 0.0 0.0 0.0 0.0 0.0 0.0 0.0 0.0 0.0 0.0 0.0 0.0 0.0 0.0 0.0 0.0 0.2 0.0 0.0 0.0 0.1 0.0 0.0 0.0 0.0 0.0
Tetrarradiate 1 (40-60/2-3 µm) 0.2 1.3 0.3 1.0 0.4 0.0 0.0 0.0 0.0 0.0 0.0 0.0 0.0 0.0 0.0 0.0 0.0 0.0 0.0 0.0 0.0 0.0 0.0 0.0 0.0 0.0 0.0 0.0 0.0 0.0 0.0 0.0 0.0 0.0 0.0
Tetrarradiate 2 (80-100/ 1-1.5 µm) 0.0 0.0 0.0 0.0 0.0 0.0 0.0 0.0 0.0 0.0 0.0 0.0 0.0 0.0 0.0 0.0 0.0 0.0 0.0 0.0 0.0 0.0 0.0 0.0 0.0 0.1 0.0 0.0 0.0 0.0 0.0 0.0 0.0 0.0 0.0
Tricladium attenuatum SH Iqbal 0.2 0.0 0.0 0.2 0.0 0.0 0.0 0.0 0.0 0.0 0.0 0.0 0.0 0.0 0.0 0.0 0.0 0.0 0.0 0.0 0.0 0.0 0.0 0.0 0.0 0.0 0.0 0.0 0.0 0.0 0.0 0.0 0.0 0.0 0.0 Tricladium chaetocladium Ingold 0.0 0.0 0.0 0.0 0.0 2.9 7.5 0.9 22.3 22.6 8.1 7.8 4.6 26.9 13.3 9.9 18.9 1.2 22.0 27.4 4.8 10.8 2.1 8.4 11.9 0.1 0.9 0.0 4.1 0.7 0.0 0.0 0.0 0.0 0.0 Tricladium splendens Ingold 0.2 0.0 0.0 0.0 0.0 0.1 0.0 0.0 0.0 0.0 0.1 0.0 0.0 0.2 0.7 0.0 0.1 0.0 0.2 0.2 0.0 0.0 0.0 0.0 0.0 0.2 0.1 0.0 0.0 0.1 0.0 0.0 0.0 0.0 0.0 Tricladium terrestre D Park 0.0 0.0 0.0 0.0 0.0 0.0 0.0 0.0 0.0 0.0 0.0 0.0 0.0 0.0 0.0 0.0 0.0 0.0 0.0 0.0 0.0 0.0 0.0 0.0 0.0 0.0 0.0 0.0 0.0 0.2 0.0 0.0 0.0 0.0 0.0 Triscelophorus cf. acuminatus Nawawi 0.1 0.0 0.0 0.0 0.0 5.8 0.3 0.5 0.8 1.8 2.3 0.1 0.8 0.1 0.9 0.2 0.1 0.1 0.0 1.8 0.4 0.1 0.5 0.0 0.5 2.1 0.7 0.0 0.3 2.5 0.0 0.0 0.0 0.0 0.0 Triscelophorus cf. monosporus Ingold 0.0 0.0 0.0 0.0 0.0 0.0 0.0 0.0 0.0 0.0 0.0 0.0 0.0 0.0 0.0 0.0 0.0 0.0 0.0 0.0 0.0 0.3 0.2 0.0 0.1 0.2 0.0 0.0 0.0 0.0 0.0 0.0 0.0 0.0 0.0 Varicosporium elodeae W Kegel 3.8 2.2 0.7 4.3 3.9 0.0 0.0 0.0 0.0 0.0 0.0 0.0 0.0 0.0 0.0 0.0 0.0 0.0 0.0 0.0 0.0 0.0 0.0 0.0 0.0 0.2 0.2 0.0 0.2 0.3 0.0 0.0 0.0 0.0 0.0
23
Aquatic hyphomycetes also exhibited substrate preference, with Flagellospora
penicillioides being more abundant on eucalypt leaves (Table 2). Sixteen fungal species
were only found at one of the streams, five of them were unidentified species with sigmoid or tetrarradiate conidia (Table 2).
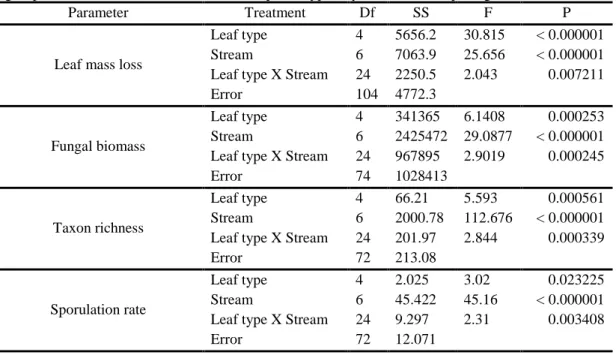
Table 3 – Two-way ANOVAs of the effects of leaf type and stream on leaf mass loss, fungal biomass, fungal sporulation rate and taxon richness of aquatic hyphomycetes on decomposing leaves.
Parameter Treatment Df SS F P
Leaf mass loss
Leaf type 4 5656.2 30.815 < 0.000001
Stream 6 7063.9 25.656 < 0.000001
Leaf type X Stream 24 2250.5 2.043 0.007211
Error 104 4772.3
Fungal biomass
Leaf type 4 341365 6.1408 0.000253
Stream 6 2425472 29.0877 < 0.000001
Leaf type X Stream 24 967895 2.9019 0.000245
Error 74 1028413
Taxon richness
Leaf type 4 66.21 5.593 0.000561
Stream 6 2000.78 112.676 < 0.000001
Leaf type X Stream 24 201.97 2.844 0.000339
Error 72 213.08
Sporulation rate
Leaf type 4 2.025 3.02 0.023225
Stream 6 45.422 45.16 < 0.000001
Leaf type X Stream 24 9.297 2.31 0.003408
Error 72 12.071
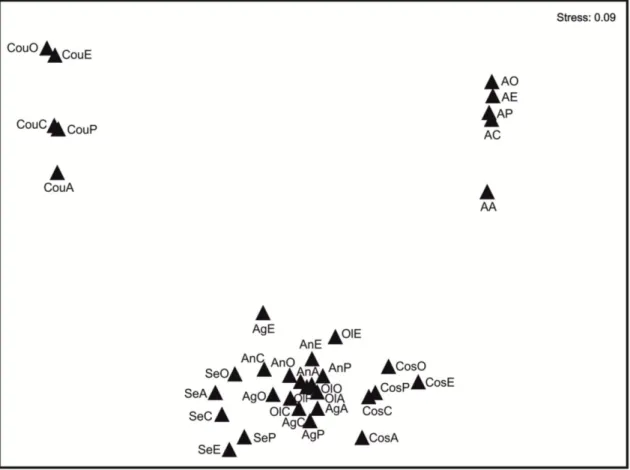
Non-metric-Multi Dimensional Scaling Analysis (NmMDS) shows the ordination of fungal communities on leaves according to the five leaf types and the seven streams of the Ave River basin (Fig. 4). Fungal communities on leaves of Agra Stream (oligotrophic) separated from those of Couros Stream (hypertrophic) and from all the other streams (Fig.4). Fungal communities in moderate eutrophic streams (Oliveira, Andorinhas and Agrela streams) and moderately-high eutrophic streams (Selho River and Costa Stream) were similar (Fig. 4). Fungal communities differed among leaf types in all the sampling streams (Fig.4).
24
Figure 4 - Non-metric Multi-Dimensional Scaling Analysis (NmMDS) of fungal communities along the seven sampling sites and according to leaf type. Legend: first letters correspond to stream site, A, Agra Stream, Ol, Oliveira Stream, An, Andorinhas Stream, Ag, Agrela Stream, Se, Selho River, Cos, Costa Stream, and Cou, Couros Stream; last letter corresponds to leaf type, A, alder, C, chestnut, E, eucalypt,
O, oak, and P, plane tree.
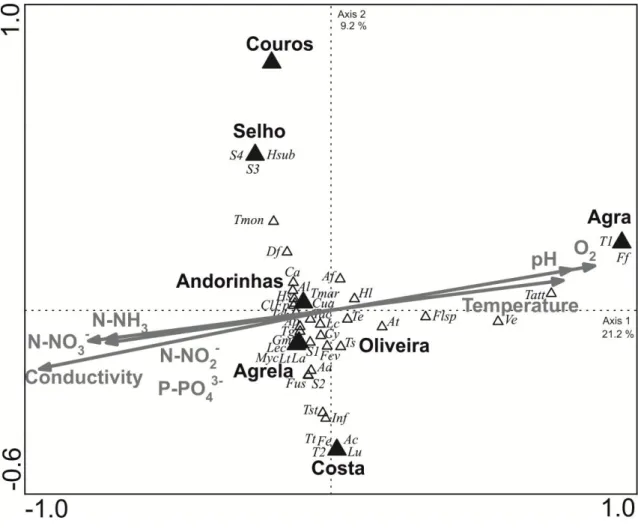
Canonical correspondence analysis (CCA) shows the contribution of stream water variables to the ordination of fungal communities on leaves in the seven streams of the Ave River basin (Fig. 5). All the environmental variables had high contribution to explain the structure of fungal communities. Axis 1 separated Agra Stream from the remaining streams, while axis 2 discriminated four groups: Couros Stream, Selho River, Costa Stream and the remaining streams, which grouped together (Fig. 5). Agra Stream was positively correlated with temperature, pH and dissolved oxygen and negatively correlated with variables indicative of eutrophication (Fig. 5).