USING SVD FILTERS FOR VELOCITY ANALYSIS AND GROUND-ROLL ATTENUATION
Oscar F. Mojica
1, Milton J. Porsani
2and Michelangelo G. da Silva
1ABSTRACT.This study investigates the adaptive filtering approach based on the Singular Value Decomposition (SVD) method to improve velocity analysis and ground-roll attenuation. The SVD filtering is an adaptive multichannel filtering method where each filtered seismic trace keeps a degree of coherence with the immediate neighboring traces. Before applying the adaptive filtering, in order to flatten the primary reflections the seismogram is corrected using the Normal Move Out (NMO) method. The SVD filtering helps to strengthen the spatial coherence of reflectors. It works as multichannel and can be applied by selecting a set of seismic traces taken from around the target trace. Thus traces from different shots can be represented by a five-point areal operator, which we call five-point cross operator. In this paper we run this operator along the coverage map of the seismic survey. At each operator position, the filtered trace (center of the operator) is obtained by taking the first or adding the first eigenimages. Thereby we enhance the coherence corresponding to the primary reflections in detriment of the remaining events (ground-roll, multiples, and other non-correlated events) remained in the other eigenimages. The method was tested on a seismic line of the Tacutu Basin, Brazil. The obtained results show the velocity spectra with better definition, as well as better post-stacked section exhibiting better continuity of seismic reflections and lower noise, compared with the raw processing results (without SVD filtering).
Keywords: CMP stacking, seismic processing, SVD filtering, ground-roll attenuation, velocity analysis.
RESUMO.No presente trabalho aplicamos o m´etodo de filtragem adaptativa baseada no m´etodo SVD (Singular Value Decomposition) para a melhoria da an´alise de velocidades e atenuac¸˜ao do ru´ıdo coerente associado `a fonte s´ısmica (ground-roll). A filtragem SVD pode ser vista como um m´etodo de filtragem adap-tativa multicanal onde cada trac¸o filtrado guarda certo grau de coerˆencia com os trac¸os imediatamente vizinhos. Antes da aplicac¸˜ao do m´etodo ´e feita a correc¸˜ao de decalagem normal (normal move out – NMO) dos sismogramas, tendo como finalidade deixar as reflex˜oes de interesse aproximadamente horizontais. A filtragem SVD permite reforc¸ar a coerˆencia espacial dos refletores. Ela trabalha na forma multicanal e pode ser aplicada seguindo um procedimento padr˜ao que consiste na selec¸˜ao de um conjunto de trac¸os tomados ao redor do trac¸o alvo da filtragem. Desta forma trac¸os de diferentes tiros podem ser utilizados na filtragem SVD. A coleta de trac¸os pertencentes a diferentes tiros, no mapa de cobertura, pode ser representada por um operador espacial de cinco pontos que denominamos de operador em cruz. No presente trabalho utilizamos um operador de cinco pontos que opera sobre todos os trac¸os do mapa de cobertura do levantamento s´ısmico. A cada posic¸˜ao do operador, o trac¸o filtrado (centro do operador) ´e obtido tomando-se a primeira ou somando-se a(s) primeira(s) autoimagem(ns) do painel de 5 trac¸os selecionados. Desta forma, reforc¸amos a coerˆencia correspondente `as reflex˜oes prim´arias, em detrimento dos eventos restantes (ground-roll, m´ultiplas e demais eventos n˜ao cor-relacionados), localizado nas demais autoimagens. O m´etodo foi testado sobre uma linha s´ısmica terrestre da Bacia do Tacutu, Brasil. Os resultados obtidos mostram espectros de velocidades com melhor definic¸˜ao, como tamb´em sec¸˜oes empilhadas exibindo melhor continuidade das reflex˜oes e menor ru´ıdoground-roll, comparado com os resultados do processamento bruto (sem a filtragem SVD).
Palavras-chave: empilhamento CMP, processamento s´ısmico, filtragem SVD, atenuac¸˜ao doground-roll, an´alise de velocidade.
1Centro de Pesquisa em Geof´ısica e Geologia, Instituto de Geociˆencias, Universidade Federal da Bahia, BA, Brazil – E-mails: ofmla@cpgg.ufba.br; mgs@cpgg.ufba.br 2Centro de Pesquisa em Geof´ısica e Geologia, Instituto de Geociˆencias, Universidade Federal da Bahia and INCT de Geof´ısica do Petr´oleo/CNPq, BA, Brazil – E-mail: porsani@cpgg.ufba.br
INTRODUCTION
The quality of the stacked section is directly correlated to a good estimate of the velocities used in the NMO correction, the so-called NMO velocity (vNMO). This estimation is performed in the
velocity analysis stage, in which the NMO velocity is defined manually on the semblance of some previously selected CMP’s. Velocity analysis uses a semblance measurement within a time window to choose the best velocity profile along the trajectory of the hyperbolic reflection events. Low S/N (signal/noise) ratio di-rectly affects the quality of the velocity spectrum, which is one of the problems with NMO velocity estimation thus impacting the final quality of the seismic image generated by CMP stacking.
SVD filtering method has important applications in seismic data processing. SVD filtering can be used to enhance spatial coherence of the seismic data by strengthening reflections while simultaneously attenuating the coherent noise. This technique has been implemented and applied to various kinds of problems in seismic data processing (Freire, 1986; Freire & Ulrych, 1988; Bekara & van der Baan, 2007; Porsani et al., 2009, 2010a,b).
Kendall et al. (2005) use the SVD method to obtain polar-ization filters for ground-roll attenuation of multicomponent data. Tyapkin et al. (2003) use events alignment method to flatten the noise in one or more horizontal sections of common shot point seismograms. In each section, the coherent noise (ground-roll) is preserved in the first eigenimages. The other eigenimages rep-resent the signal and are transformed back to the time-space do-main. Chiu & Howell (2008) proposed a method that uses SVD to generate eigenimages, which represent the coherent noise in a given window in the time-space domain. The data within the windows are transformed into analytical signal, followed by the SVD decomposition complex, when eigenimages are extracted from the coherent noise.
SVD filtering, as used by Porsani et al. (2009, 2010a,b), op-erates with the SVD decomposition of a subset of traces extracted from a 2D seismic line or 3D seismic volume. Only one trace from within the mobile window (2D or 3D), associated with the first eigenimages, is chosen to represent the filtered trace. This procedure preserves the relative amplitude while enhancing the continuity and consistency of reflection events, further reducing the noise associated to the other eigenimages that are discarded. In this paper we use the method proposed by Porsani et al. (2010b) for processing one onshore (land) seismic line. In this case the filtering process uses seismic traces collected in areas of common shot point and common midpoint gathers. We illtrate the SVD filtering method showing the results obtained us-ing a subset of traces of this seismic line from the Tacutu Basin.
The results show that the SVD filter is capable of increasing the velocity resolution of the spectra as well as attenuating the ground-roll from the final stacked section.
SVD FILTERING
Considering the subset of M seismic traces selected from a 2D seismic section or a 3D seismic volume given by: d(t, xn),
t = 1, . . . , Nt and n = 1, . . . , M. The data matrix D =
[d1. . .dM] = {d(t, x1), . . . ,d(t, xM)}, t = 1, . . . , Nt can be decomposed by the singular value decomposition (SVD) method as shown below (Golub & Van Loan, 1996).
D = U6VT (1)
where,U and V are orthogonal and unitary matrices such as
U−1= UT andV−1= VT.
6 = diag{σ1, . . . , σM} matrix of singular values (M ×
M)σ1≥ σ2≥ ∙ ∙ ∙ ≥ σM ≥ 0;
U = [u1. . .uM] matrix of eigenvectors (Nt× Nt)associated with the time dimension;
V = [v1. . . vM] matrix of eigenvectors (M × M) associated with the space dimension.
When ˜U = U6 = [σ1u1. . . σMuM], we can rewrite equation (1) as follows, h d1 . . . dj . . . dM i = ˜U VT =hσ1u1 . . . σMuM i VT 1 .. . VT M =hσ1u1 . . . σjuj . . . σMuM i × v1,1 . . . v1, j . . . v1,M .. . . . . ... . . . ... vM,1 . . . vM, j . . . vM,M .
From the above relations we get the equation for SVD decomposition of one trace of the subset of M traces from the original section. dj = h σ1u1 . . . σMuM i v1, j .. . vM, j = cdJ 1 + ∙ ∙ ∙ + cdkJ + ∙ ∙ ∙ + cdMJ = M X k=1 σkukvk, j. (2)
Note that the seismic traced(t, xj)(columnsj of matrix D) can be obtained by the linear combination of eigenvectors asso-ciated with the time dimension. The weights used in the linear combination are the coefficients of the eigenvectors associated with the spatial dimension scaled by the corresponding singular values.
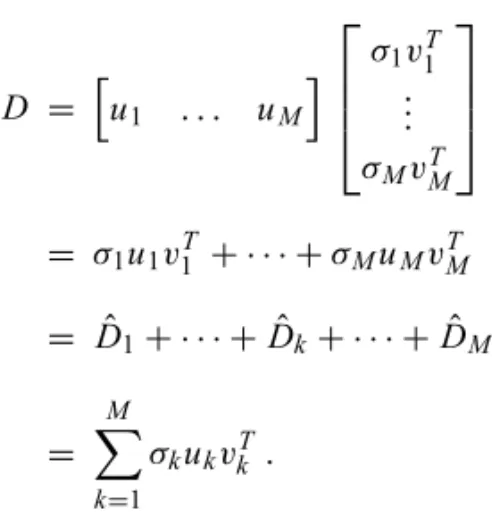
Another way to write equation (1) is as follows,
D = hu1 . . . uM i σ1v1T .. . σMvTM = σ1u1v1T + ∙ ∙ ∙ + σMuMvTM = ˆD1+ ∙ ∙ ∙ + ˆDk+ ∙ ∙ ∙ + ˆDM = M X k=1 σkukvkT. (3)
ˆDk = σkukvkT is an unitary matrix also known as eigen-imagek of the data matrix D, while cdkJ in equation (2) is the tracej of eigenimage ˆDk.
Equation (2) represents the SVD decomposition of one trace, while equation (3) represents the SVD decomposition of the whole image associated with the original matrix. Limiting the summation in these equations, we can obtain approximate representations of either each separate seismic trace or the entire image.
The first singular values have the highest amplitude caus-ing the associated eigenimages to preserve the features of higher spatial correlation (Freire, 1986). Thus, the first eigenvectors are responsible for the reconstitution of predominantly horizon-tal or sub-horizonhorizon-tal events of high magnitude. Porsani et al. (2009) used this method to emphasize the horizontal and sub-horizontal events and to attenuate inclined events associated with the ground-roll.
For each trace of a 2D seismic section or a 3D volume that needs to be filtered, a subset of immediate neighboringM traces is collected to perform the SVD decomposition of the corresponding data matrix and partially restore the ˜dj trace through the equation,
˜d(t, xj)=
K
X
k=1
σkuk(t)vk(xj) . (4) Thus, the trace ˜d(t, xj)obtained from the first K eigen-vectors represents the filtered trace. The first eigeneigen-vectors, that is, the small values ofK, are responsible for generating traces,
sections and volumes, with stronger spatial coherence. Thus, the SVD filtering can be seen as a multichannel filtering method where each filtered trace keeps a degree of consistency with im-mediate neighboring traces.
The proposed SVD filtering method consists of the systematic application of equation (4) over all traces of a seismic line or a 3D volume, following the procedure:
(i) Selection of the subset ofM traces immediately neighbor-ing each traced(t, xj)of the section or seismic volume; (ii) SVD decomposition; and,
(iii) Partial reconstitution of the trace ˆd(t, xj)using only the singularK values.
Figure 1 shows the schematic representation of SVD decom-position of theD matrix (seismogram). It is possible to verify that each eigenimage contributes to the building ofD, proportionally to the magnitude of the corresponding singular value.
The 2D or 3D operator of the SVD filtering is shifted spatially over all data of the 2D section or the 3D seismic volume. A nat-ural application of SVD filtering is to choose an odd number of traces and the central target trace of the operator as the trace we want to filter. At each new operator position, the SVD decomposi-tion is performed and a new filtered trace is generated. The result represents the filtered seismic volume with the same dimensions of the input data.
METHOD APPLICATION
The SVD filtering method was applied to the 204-RL-242 land seismic line from the Tacutu Basin. The line contains 462 shots with a sampling rate of 4 ms. The survey used 96 channels per shot and split-spread geometry with asymmetric haul of 1050-100-0-100-3850 m. The distance between geophones (receivers) and between shot points was 50 m.
The pre-processing of the data was performed using the Focus software system including the following steps: data read-ing and importread-ing, assemblread-ing of the acquisition geometry, static correction, editing and silencing of traces and amplitude cor-rection (spherical divergence). Data was organized into groups of common midpoint (CMP) gathers, and a preliminary velocity analysis was then performed. Subsequent to the NMO correction, data was reorganized into shot gathers, and the SVD filter was applied using a cross operator. Finally, after applying an inverse NMO, the filtered data was grouped according to CMP gathers and the stacked section was generated.
Figure 1 – MatrixD eigenimages resulting from the decomposition using SVD singular values. ˆDk = σkukvkTis the eigenimage ofD data matrix. a)D Data Matrix; b) first eigenimage; c) second eigenimage; d) M eigenimage.
VELOCITY ANALYSIS
NMO correction is the basis for determining the velocities from seismic data. The calculated velocities can be used to correct the normal move out so that the reflections are flattened out in the traces of a CMP gather prior to stacking. Thus, the CMP stacking method depends on the availability of the velocity field which is obtained from the velocity analysis applied to the data.
Velocity analysis has limited accuracy and resolution due to several factors, especially the signal/noise ratio. Thus the accu-racy of the velocity spectrum is limited when the signal to noise ratio (S/N) is low. The presence of random noise of relatively strong intensity in a CMP family will hamper the signal strength along the hyperbolic paths. Some events may be chopped while others will be difficult to distinguish due to the presence of high noise level.
Various options such as the use of a band-pass filter and au-tomatic gain control (AGC) may be used to improve the veloc-ity spectrum especially when the input CMP gathers have a low signal to noise ratio.
Therefore, SVD filtering was used to generate a more coherent velocity spectrum that allows both a good estimate of the veloci-ties to be applied in the NMO correction and a better quality final stacked section.
AREAL SVD FILTERING (CROSS) OPERATOR
SVD filtering, as used by Porsani et al. (2009), is made on a panel of seismic traces corrected for NMO in the common shot point domain. A moving window of three or five traces, for example, collects the traces along the entire panel, and submits them to SVD filtering. However, the geometry of the field survey allows other traces of neighboring shots to be used as well. Therefore, we developed a SVD filtering operator that filters the target trace using the closest neighboring traces of each CMP of the data. In this case, we selected the central trace and the four immediately neighboring traces, thereby resulting in a cross shape operator (Fig. 2). This 5-point spatial operator operates covering the en-tire survey map, extracting the five traces that undergo the SVD filtering. After trace selection, the SVD decomposition is per-formed and a new filtered trace is generated in the position of the central trace of the operator.
Figure 3 shows the velocity analysis in the supergather formed by 50 CMP’s gathers. Ground-roll present in the data seriously degrades the velocity analysis. The same supergather after using the SVD cross operator filtering, along with its velocity spectrum is shown in Figure 4. It is observed that in this veloc-ity spectrum the maximum semblance values are better defined than the one shown in Figure 3.
Figure 2 – Coverage map and the five-point spatial operator adopted to select the traces, using as reference the central trace (SVD filtering target) represented by the filled circle.
Figure 3 – Original data and the corresponding velocity spectrum.
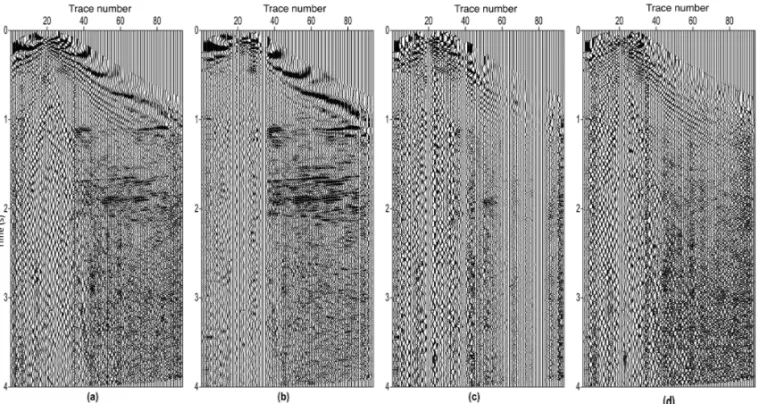
Figure 5 shows the NMO corrected original shot (Fig. 5a), the shot filtered with the SVD cross-operator method associated with the first eigenimage (Fig. 5b) and the SVD filtered shots with the second, third and fifth eigenimages in Figures 5c and 5d, respectively. We can see that the first eigenimage preserves most events correlated with the seismic trace. Figure 6 shows the seis-mograms after the inverse NMO correction of the data in Fig-ure 5. The average amplitude spectrum, which corresponds to
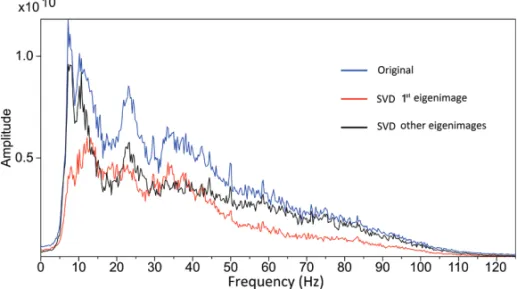
the results of Figure 6, is shown in Figure 7. It can be observed that the low frequency content is mostly concentrated in the sec-ond to fifth eigenimages while the first eigenimage is noticeably smaller, that is, the SVD filtering removes a substantial part, but not all of the low frequency of the original data.
Figure 8 shows the results obtained with the SVD and the classic F-K filtering methods. Figure 8a shows the original com-mon shot gather. The F-K and SVD filtering results are shown
Figure 4 – SVD filtered data using the cross operator and the corresponding velocity spectrum.
Figure 5 – SVD filtering results (cross operator) for a group of NMO corrected common shot. a) the original data; b) SVD filtered data with the first eigenimage; c) second eigenimage; and d) third, fourth and fifth eigenimages, respectively.
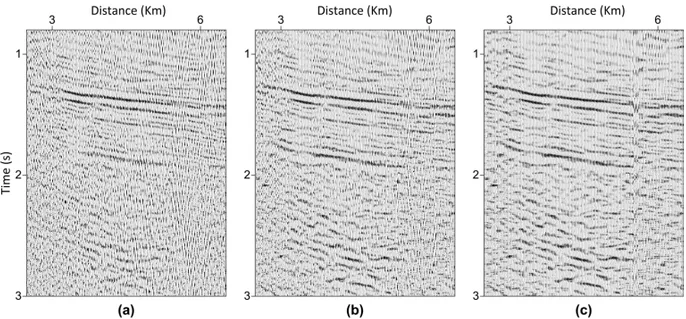
in Figures 8b and 8c, respectively. The SVD filtering using the cross operator displays the best results since it removed the noise more effectively than the F-K filter. Figure 9 shows the CMP stacked sections for the data from the Tacutu Basin, as well as the original stacked seismic section (Fig. 9a), and the stacked section after the SVD filtering using the cross operator (Fig. 9b). Significant attenuation of the noise and improved definition of the reflectors are observed, which are clearly seen when
compar-ing the results shown in Figures 10a and 10b, showcompar-ing a detail of Figure 9.
CONCLUSIONS
SVD filtering is an adaptive multichannel filtering method where each filtered trace keeps a certain coherence degree with immedi-ately neighboring traces. The method can be used pre and
post-Figure 6 – SVD filtering results (cross operator) after applying the inverse NMO correction in the seismograms of post-Figure 5. a) original data; b) SVD filtered data (cross operator) with the first eigenimage (signal); and c) other eigenimages from the SVD decomposition.
Figure 7 – Average amplitude spectrum of the seismograms shown in Figure 6.
stacking, using mobile linear operators (extracted from a single domain: CMP, common point shot, common offset domain), or areal operators using traces of two domains (common shot point and offset, for example).
The method was tested in an onshore (land) seismic line from the Tacutu Basin. The results show velocity spectra with better definition than with no filtering, as well as stacked sec-tions exhibiting better continuity of the reflecsec-tions and lower ground-roll noise, as compared with the results of raw processing
(without SVD filtering).
The results presented in this paper show the effectiveness of the adaptive SVD filtering method to attenuate ground-roll and improve consistency of reflectors in the seismic sections. SVD filtering enables an increase in the signal/noise ratio, a limit-ing factor in the resolution of velocity spectra and analysis. The proposed method is very efficient, easy to implement and with a computational cost equivalent to multichannel filtering methods such as, F-K and deconvolution.
Figure 8 – Comparison of the results between F-K and SVD filterings (cross operator). (a) Original data; (b) F-K filtering results; and (c) SVD filtering (cross operator) results.
Figure 10 – Details of the stacked sections. (a) original data; (b) SVD filtered data (cross operator); and (c) post-stacking SVD filtering results.
ACKNOWLEDGMENTS
The authors thank FINEP, FAPESB, CNPq/MCT and PETRO-BRAS for financing and supporting this research (Project INCT-GP/CNPq). Thanks are also due to the companies Landmark and Paradigm for the cooperation agreements, allowing the use of the software license for seismic processing and interpretation avail-able to LAGEP-CPGG-UFBa.
REFERENCES
BEKARA M & BAAN MV. 2007. Local singular value decomposition for signal enhancement of seismic data. Geophysics, 72: V59–V65. CHIU SK & HOWELL JE. 2008. Attenuation of coherent noise using localized- adaptive eigenimage filter. 78thAnn. Internat. Mtg., Soc. Expl. Geophys., Expanded Abstracts, 2541–2545.
FREIRE SLM. 1986. Aplicac¸˜oes do m´etodo de decomposic¸˜ao em valores singulares no processamento de dados s´ısmicos. PhD thesis, CPGG-UFBA. Available on: <http://www.pggeofisica.ufba.br/teses-f.html>. Access on: April 22, 2011. [PDF 14,41 Mb].
FREIRE SLM & ULRYCH TJ. 1988. Application of singular value decom-position to vertical seismic profiling. Geophysics, 53: 778–785. GOLUB GH & VAN LOAN CF. 1996. Matrix Computations. 3rd ed.
(Baltimore: Johns Hopkins University Press). Matrix computations, Johns. 694 p.
HARLAN WS, CLAERBOUT JF & ROCCA T. 1984. Signal/noise separa-tion and velocity estimasepara-tion. Geophysics, 49: 1869–1880.
KENDALL R, JIN S, RONEN S & MEERSMAN K. 2005. An SVD-polarization filter for ground roll attenuation on multicomponent data. 77thAnn. Internat. Mtg., Soc. Expl. Geophys., Expanded Abstracts, 928–932.
PORSANI MJ, SILVA MG, MELO PEM & URSIN B. 2009. Ground-roll attenuation based on SVD filtering. 81thAnn. Internat. Mtg., Soc. Expl. Geophys., Expanded Abstracts, 28: 3381.
PORSANI MJ, SILVA MG, MELO PEM & URSIN B. 2010a. An adap-tive local-slope SVD filtering approach to enhance events on seis-mic sections. 80thAnn. Internat. Mtg., Soc. Expl. Geophys., Expanded Abstracts, 3717–3722.
PORSANI MJ, ARTOLA FAV, SILVA MG & MELO PEM. 2010b. Filtra-gem SVD aplicada a melhoria do rastreamento de horizontes s´ısmicos. Revista Brasileira de Geof´ısica, 28(3): 473–480.
TYAPKIN YK, MARMALYEVSKYY NY & GORNYAK ZV. 2003. Source-generated noise attenuation using the singular value decomposition. In: 75thAnn. Internat. Mtg., Soc. Expl. Geophys., Expanded Abstracts, 22, 2044.
Recebido em 3 julho, 2011 / Aceito em 30 dezembro, 2011 Received on July 3, 2011 / Accepted on December 30, 2011
NOTES ABOUT THE AUTHORS
Oscar F. Mojica. Holds Bachelor of Sciences in Geology from Universidad Industrial de Santander, 2009. Currently enrolled in the Geophysics Graduate Program at the Universidade Federal da Bahia. The main areas of interest are development of methods and algorithms for mono and multi channel filtering and reflection seismic data processing.
Milton J. Porsani. Graduated in Geology from the Universidade de S˜ao Paulo (1976) and Education at the Universidade de S˜ao Paulo (1978). Holds a Mas-ter degree in Geophysics from the Universidade Federal do Par´a (1981), PhD in Geophysics from the Universidade Federal da Bahia (1986) and a post-doctoral internship at the Institute of Geophysics of the University of Texas (September 1992 to March 1994). Professor in the Department of Geology and Applied Geo-physics, UFBA since January 1990 and Chairman since 2000. Researcher of CNPq since 1990 and Researcher 1A level since 2004. He was coordinator of the Cooperative Research Network NNE (FINEP) from 2003 to June 2009. He is currently coordinator of the Instituto Nacional de Ciˆencia e Tecnologia de Geof´ısica do Petr´oleo from CNPq (INCT-GP) and vice-coordinator of the Cooperative Research Network NNE Agency (FINEP) in Geophysics Exploration. He is a member of the Cˆamara T´ecnica de Ciˆencias Matem´aticas e Naturais da FAPESB – Foundation for Research Support of the State of Bahia, since March 2009 and a mem-ber of the Academy of Sciences of Bahia since 2011. His areas of interest include: the study of inverse problems in geophysics, seismic processing, development of methods and algorithms for filtering and inversion of seismic data, groundwater exploration and geophysical studies geared to monitor contamination plumes and environment quality control.
Michelangelo G. da Silva. Bachelor of Sciences in Survey Engineering from EEA, 2001. Master in Petroleum Exploration Geophysics from the UFBA, in 2004. From 2004 to date, is a researcher at the CPGG-UFBA with a fellowship from the CNPq. The main areas of interest are filtering methods, seismic reflection data processing and interpretation.


