Rafaela Cunha de Barros da Silva Santos
Licenciada em Ciências da Engenharia Química e Bioquímica
Smart Windows with Permanent
Memory Effect
Dissertação para obtenção do Grau de Mestre em Engenharia Química e Bioquímica
Orientador: Prof. Doutor João Carlos da Silva Barbosa
Sotomayor
Júri:
Presidente: Prof. Doutora Maria Ascenção Carvalho Fernandes Miranda Reis Arguente: Doutor Luis Ever Aguirre
Smart Windows with Permanent Memory Effect
2014
III
Departamento de Química
Smart Windows with Permanent
Memory Effect
By
Rafaela Cunha de Barros da Silva Santos
Dissertation presented at Faculdade de Ciências e Tecnologia from Universidade Nova de Lisboa to obtain the degree of Master in Chemical and Biochemical Engineering
Smart Windows with Permanent Memory Effect
2014
V
Smart Windows with Permanent
Memory Effect
Copyright, Rafaela Cunha de Barros da Silva Santos, FCT-UNL
Indicação dos direitos de cópia
A Faculdade de Ciências e Tecnologia e a Universidade Nova de Lisboa têm o direito, perpétuo e sem limites geográficos, de arquivar e publicar esta dissertação através de exemplares impressos reproduzidos em papel ou de forma digital, ou por qualquer outro meio conhecido ou que venha a ser inventado, e de divulgar através de repositórios científicos e de admitir a sua cópia e distribuição com objetivos educacionais ou de investigação, não comerciais, desde que seja dado crédito ao seu autor e editor. Copyright
Smart Windows with Permanent Memory Effect
2014
VII
Smart Windows with Permanent Memory Effect
2014
IX
Agradecimentos
Ao meu orientador, Professor Doutor João Sotomayor, queria agradecer o facto de me ter possibilitado a participação neste projeto, pela orientação e acompanhamento ao longo deste projeto. Agradecer, também, a sua simpatia e boa-disposição constante.
À Professora Madalena Dionísio pela ajuda nos testes de DSC.
Ao Professor Mário Eusébio por ter desenvolvido o programa informático que possibilita a análise dos estudos eletro-óticos.
À Professora Elvira Fortunato e à Daniela Nunes pela ajuda com o SEM.
À Professora Teresa Cidade e ao Tiago Brehm pela ajuda dada nas medições de viscosidade.
Ao Professor Carlos Dias pela ajuda no funcionamento da fonte elétrica e no apoio dada relativamente ao Efeito de Joule.
Ao Professor João Martins e ao Engenheiro Carlos Rosa pela ajuda no desenvolvimento da parte elétrica dos estudos eletro-óticos e pela calibração dos dois canais da fonte elétrica usada neste estudo.
Um agradecimento especial às meninas do laboratório 415, Maria Catarina Silva pelo apoio e ajuda dada desde o início da realização deste trabalho, à Ana Mouquinho pelo apoio dado e por tudo o que aprendi com a sua experiência, à Mariana Moreira e Nélia Luís não só pelo apoio neste trabalho mas por todo o apoio dado desde o início do curso. A todas agradeço, também, a alegria e bons momentos passados que levarei para sempre comigo.
À FCT pelo financiamento através projeto PTDC/CTM-POL/122845/2010.
À D. Idalina e à D. Conceição pela sua simpática e disponibilidade.
X
À minha Mãe e ao Carlos, por tudo o que sempre fizeram por mim, por todos os sacrifícios, por todo o amor e por toda a paciência que tiveram para me aturar nos momentos mais difíceis.
Aos meus irmãos, Doca e Mariana, que acima de tudo estão sempre no meu coração.
Aos meus avós, aos que estão e ao que partiu, e ao meu Pai obrigada por tudo.
A toda a minha família que sempre quis o melhor para mim e que, direta ou indiretamente, sempre lá estiveram.
À Barbara Camacho, Joana Afonso e Nádia Carmo, amigas que nunca desiludem!
Smart Windows with Permanent Memory Effect
2014
XI
This work is partially funded by Fundação para a Ciência e Tecnologia
Smart Windows with Permanent Memory Effect
2014
XIII
Abstract
In this work PDLC films were made with liquid crystal E7 marketed by MERCK®. Two
monomers and one oligomer were used, the monomer PE4A (Pentaerythritol tetraacrylate), the monomer TMT (Trimethylolpropane trimethacrylate) and the oligomer AP [Poly(propylene glycol) acrylate]. The PDLC's were obtained by PIPS method and produced by thermal polymerization using a polymerization initiator AIBN.
A co-polymerization was studied using different proportions of PE4A and AP.
Electro-optical studies were made in order to determine the permanent memory effect of the PDLCs. Best results are for PE4A/AP co-polymerization of 50/50 and 60% of liquid crystal which results in obtained 100% of permanent memory effect.
Different techniques were carried out to characterize the PDLCs: Scanning Electron Microscopy in order to study the morphology of the polymer network, Polarized Light Microscopy which allowed to observe the distribution of the liquid crystal molecules in the polymer network before and after the application of an electric field and, with a temperature ramp at 1ºC/min, allows determine the clarification temperature of the PDLC, Differential Scanning Calorimetry to determine the Tg of monomers/oligomers and polymers, the nematic-isotropic temperature of the liquid crystal E7 and of the liquid crystal in the polymer network and viscosity measurements in order to understand if the viscosity can influence polymerization rate and the final matrix structure.
Scale-up was development in self-made cells using conductive glasses with polyimide alignment layer.
Smart Windows with Permanent Memory Effect
2014
XV
Resumo
No decorrer deste trabalho foram feitos filmes de PDLC utilizando o cristal líquido E7
comercializado pela MERCK®. Foram utilizados dois monómeros e um oligómero, o monómero
PE4A (Pentaerythritol tetraacrylate), o monómero TMT (Trimethylolpropane trimethacrylate) e o oligómero AP [Poly(propylene glycol) acrylate]. Os PDLC’s foram obtidos através do método de separação de fases induzida por polimerização e polimerizados termicamente utilizando um iniciador de polimerização, AIBN.
Foi estudada uma co-polimerização utilizando-se diferentes proporções de PE4A e AP.
Fizeram-se estudos eletro-óticos de modo a determinar-se o efeito de memória permanente que os PDLCs apresentavam, com a co-polimerização usando uma proporção de PE4A/AP de 50/50 e uma percentagem de cristal líquido de 60% foi obtido 100% de efeito de memória permanente. Realizaram-se diferentes técnicas para caracterizar os PDLCs: Microscopia Eletrónica de Varrimento com o objetivo de se estudar a morfologia da rede polimérica, Microscopia de Luz Polarizada que permitiu observar a distribuição do cristal líquido na rede polimérica antes e depois da aplicação de um campo elétrico e, aumentando a temperatura do PDLC a uma velocidade de 1ºC/minuto foi possível determinar a temperatura de clarificação do PDLC, Calorimetria Diferencial de Varrimento para determinar as Tg dos monómeros/oligómeros e dos polímeros, a temperatura nemática isotrópica do cristal líquido E7 e do cristal líquido na rede polimérica e foram realizadas medições de viscosidade com o objectivo de perceber se a viscosidade poderia influenciar a velocidade de polimerização e a estrutura final da matriz polimérica.
Fez-se o scale-up, com células produzidas no laboratório utilizando-se dois vidros condutores com uma camada de alinhamento de poliimida.
Smart Windows with Permanent Memory Effect
2014
XVII
Table of Abbreviations
5CB 4-Cyano-4’-n-pentyl-1,1’-biphenyl
5CT 4-cyano-4’’-n-pentyl-1,1’,1’’-terphenyl
7CB 4-cyano-4’-n-heptyl-1,1’-biphenyl
8OCB 4-cyano-4’-n-octyloxy-1,1’-biphenyl
A Gradient velocity
AIBN α,α-azobisisobutyronitrile
AP Poly(propylene glycol) acrylate
c Velocity of light in vacuum
DSC Differential Scanning Calorometry
E Electric field
E7 Nematic liquid crystal
E90 Electric field required to achieve 90% of the maximum transmittance
EO Electro-Optical
f Shearing stress
ITO Indium tin oxide
LC Liquid crystal
n Director of the liquid crystal
n0 Ordinary index
ne Extraordinary index
niso Refractive index of isotropic liquid
np Refractive index of the polymeric matrix
PDLC Polymer dispersed liquid crystal
PE4A Pentaerythritol tetraacrylate
PIPS Polymerization induced phase separation
POM Polarized Optical Microscopy
SA Smectic phase A
SC Smectic phase C
SEM Scanning Electron Microscope
SIPS Solvent induced phase separation
T0 Initial transmittance (%)
Tc Clarification temperature
Tf Melting point
TG Glass transition temperature
TIPS Thermally induced phase separation
TMáx Maximum transmittance when the voltage is applied (%)
TMT Trimethylolpropane trimethacrylate
TNI Nematic-isotropic transition temperature
Toff Transmittance when the voltage is removed (%)
Δn Value of birefringence
η Viscosity
XVIII
ε|| parallel dielectric constant
ε⊥ perpendicular dielectric constant
ѵ Velocity of light in material
Δε Dielectric anisotropry
Smart Windows with Permanent Memory Effect
2014
XIX
Índice
Agradecimentos ... IX Abstract ... XIII Resumo ... XV Table of Abbreviations ... XVII
I. Chapter One ... 3
1. Introduction ... 3
1.1. Liquid Crystals ... 3
1.1.1. Properties of Liquid Crystals ... 4
1.1.2. Types of liquid crystal ... 6
1.1.3. Liquid Crystals in an electric field ... 9
1.2. Polymer Dispersed Liquid Crystal ... 9
1.2.1. Polymer Dispersed Liquid Crystal Matrix Morphology ... 11
1.2.2. Permanent memory effect and hysteresis ... 13
1.2.3. Surface anchorage ... 15
1.2.4. PDLC applications ... 15
II. Chapter Two ... 17
2. Materials and Methods ... 17
2.1. Materials ... 17
2.2. Methods ... 21
III. Chapter Three ... 29
3. Experimental Results and Analysis ... 29
3.1. Study of the PDLC made by TMT polymer and E7 liquid crystal ... 30
3.2. Study of the PDLC made by PE4A polymer and E7 liquid crystal ... 32
3.3. Study of the PDLC using a co-polymerization made by PE4A and AP, and E7 liquid crystal ... 34
3.4. . Scale-up in self-made cells ... 56
3.5. Erasing device by Joule heating ... 58
IV. Chapter Four ... 59
4. Conclusions ... 59
V. Chapter Five ... 61
5. References ... 61
VI. Chapter Six ... 65
6. Appendix ... 65
6.1. EO analysis for building 3D graph ... 65
XX
Smart Windows with Permanent Memory Effect
2014
XXI
Index of Figures
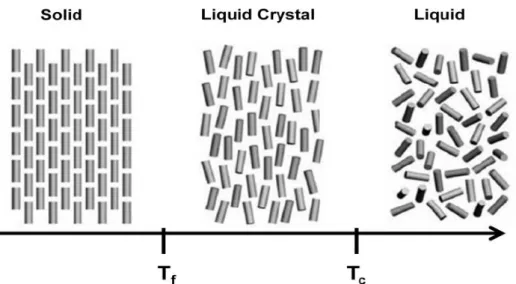
Figure I.1 - Schematic illustration of a solid, liquid crystal and liquid phases [2] adapted ... 3
Figure I.2 – Schematic illustration ... 4
Figure I.3 - Light propagation in Liquid Crystals along and normal to optical axis: (a) ordinary beam (b) extraordinary beam ... 5
Figure I.4 - Light travelling through a birefringent material [5] (adapted)... 5
Figure I.5 - Temperature dependence of refractive indices ... 6
Figure I.6 - Thermotropic liquid crystal molecule [2] ... 6
Figure I.7 - Lyotropic liquid crystal molecule [2] ... 7
Figure I.8 - Structure of a nematic liquid crystal phase [2] ... 7
Figure I.9 - Structure of cholesteric liquid crystals [2] ... 8
Figure I.10 - Structure of smectic A (SA) liquid crystal [2] ... 8
Figure I.11 - Structure of smectic C (SC) liquid crystal [2] ... 8
Figure I.12 - Effects of an electric field in a liquid crystal molecule [5] ... 9
Figure I.13 - Schematic representation of the average molecular orientation of the liquid crystal within the micro droplets without and with an applied field [11] adapted ... 10
Figure I.14 - Evolution of the polymer network with the increasing of the number of the polymerizable groups of the monomer [13] ... 10
Figure I.15 - SEM image for Swiss Cheese morphology [14] ... 11
Figure I.16 - Radial configuration of a LC droplet [11] ... 12
Figure I.17 - Axial configuration of a LC droplet [11] ... 12
Figure I.18 - Bipolar configuration of a LC droplet [11] ... 12
Figure I.19 - SEM image for Polymer Ball morphology [8]... 13
Figure I.20 - Electro-optical response of PDLC... 14
Figure I.21 - Electro-optical response of PDLC with permanent memory effect [8] ... 14
Figure I.22 - Example of anchoring of liquid crystal molecules in the polymeric matrix with E = 0 [12] ... 15
Figure I.23 - Example of anchoring of liquid crystal molecules in the polymeric matrix with E ≠ 0 [12] ... 15
Figure I.24 - Example of a smart window [18]... 16
Figure I.25 - Representative scheme of digital writing [5] adapted... 16
Figure II.1 - Molecular structure of TMT [20] ... 17
Figure II.2 - Molecular structure of AP [21] ... 17
Figure II.3 - Molecular structure of PE4A [22] ... 18
Figure II.4 - Chemical structure of the components of E7 [8] ... 18
XXII
Figure II.6 - Decomposition of AIBN [8] ... 20
Figure II.7 - Schematic illustration of an ITO cell [25] ... 20
Figure II.8 - Schematic illustration of a glass to make a self-made cell ... 21 Figure II.9 - Schematic illustration for a self-made cell ... 21 Figure II.10 - Microscope whit crossed polarizers ... 22
Figure II.11 - Functional diagram of POM [26] ... 23
Figure II.12 - SEM at Cenimat, FCT-UNL [27] ... 23
Figure II.13 - Electro-Optical assembly ... 25
Figure II.14 - Electric pulse applied to the sample [12] adapted ... 26
Figure II.15 - Variation of heat flow with temperature [30] adapted ... 26
Smart Windows with Permanent Memory Effect
2014
XXIII
XXIV
Smart Windows with Permanent Memory Effect
2014
XXV
Smart Windows with Permanent Memory Effect
2014
XXVII
Index of Tables
Table II.1 - Composition of E7 [8] ... 19
Table III.1 - Resume for EO analysis E7/TMT ... 31 Table III.2 - POM analysis for the different proportions of E7/TMT ... 31 Table III.3 - Resume for EO analysis for E7/PE4A system ... 32 Table III.4 - POM analysis for the different proportions of E7/PE4A ... 33 Table III.5 - Results of EO analysis for the percentage of E7 of 60% and the different proportions of PE4A/AP ... 35 Table III.6 - POM analysis for the different proportions of PE4A/AP ... 36 Table III.7 - Resume of the viscosity measurements ... 45 Table III.8 - Variation of the POM analysis for the different polymerization times for 60% of E7 and PE4A/AP (25/75) ... 47 Table III.9 - Variation of the POM analysis for the different polymerization times for the percentage of LC of 60% and PE4A/AP (50/50) ... 49 Table III.10 - Variation of the POM analysis for the different polymerization times for the percentage of LC of 60% and PE4A/AP (75/25) ... 51 Table III.11 - Variation of the POM analysis for the different polymerization times for the percentage of LC of 60% and PE4A/AP (100/0) ... 53 Table III.12- Resume of EO response for the percentage of E7 of 60% and the different PE4A/AP proportion at optimal polymerization time ... 55
Table III.13 – POM analysis for the percentage of LC of 60% and different PE4A/AP
Smart Windows
Smart Windows with Permanent Memory Effect
2014
3
I.
Chapter One
1.
Introduction
1.1.
Liquid Crystals
Liquid crystals are seen as fourth state of matter. They are an intermediate state between the liquid phase and the solid phase, a transition phase occurring between Tf and Tc, Tf is the melting point and Tc the clearing point.
The difference between liquid and the liquid crystal phases is related to the ordering of molecules. In liquid crystal phase molecules have a certain orientation, they have lost positional order but still have orientational order, and in an isotropic liquid state molecules
are totally disoriented. [1]
Figure II.1 shows the orientational difference between the different phases.
4
1.1.1.
Properties of Liquid Crystals
The main properties of the liquid crystals are the fact that the liquid crystals are anisotropic. The anisotropy distinguishes liquid crystals from isotropic liquids. Liquid crystals have these
properties because they have a small degree of order among the molecules. [3]
This anisotropy manifests itself in the elastic, electric, magnetic and optical properties of a
material. [3]
Anisotropy implies that all the measurements of an elastic modulus, dielectric constant,
magnetic susceptibility, or refractive index give different results depending on the direction
along which it is measured. [3]
Figure I.2 show a schematic illustration to explain anisotropy, the image that is observed depends on the direction that is observed.
Figure I.2 – Schematic illustration
Liquid crystals shows two types of anisotropy, optic and dielectric. Optic anisotropy is related
to the refractive indices, the ordinary index (n0) and the extraordinary index (ne). The dielectric
anisotropy defines the orientation of the liquid crystal in the presence of an electric field,
characterized by two dielectric constants: parallel (𝜀∥) and perpendicular (𝜀⊥) to the principal
axes of the molecule. [4]
The extraordinary index (ne) and the ordinary index (n0) are measured with two different ways. The extraordinary index (ne) is measured for the light wave where the electric vector vibrates along the optical axis and the ordinary index (n0) is measured for the light wave where the
electric vector vibrates perpendicular of the optical axis. [2]
Smart Windows with Permanent Memory Effect
2014
5
Figure I.3 - Light propagation in Liquid Crystals along and normal to optical axis: (a) ordinary beam (b) extraordinary beam
ne- extraordinary refractive index; n0- ordinary refractive index [2]
An important property of liquid crystals is the birefringence The refractive index is defined by the next equation:
𝑛𝑒= 𝜈𝐶𝑒 and 𝑛0= 𝜈𝐶0
Where:
c: Velocity of light in vacuum;
𝜈: Velocity of light in material
The value of birefringence of a material it is given by the difference between the two refractive
indices, Δn. [2]
Δn = ne – n0
6
The birefringence of liquid crystals decreases with the increases of temperature. [2]
Figure I.5 show the temperature dependence of refractive indices.
Figure I.5 - Temperature dependence of refractive indices TC: Clearing temperature; niso: Refractive index of isotropic liquid [2]
1.1.2.
Types of liquid crystal
Liquid crystal phases can be divided in two groups: thermotropics and lyotropics.
The thermotropic liquid crystalline materials do not require a solvent to form liquid crystalline
materials. [6]
In thermotropic phase it is possible to differentiate two types: calamitic and discotic.
Figure I.6 - Thermotropic liquid crystal molecule [2]
Figure I.6 a) show the molecular structure of 4-cyano-4’-n-pentyl-1,1’-biphenyl, showing a calamitic structure. Figure I.6 b) show the molecular structure of benzene-hexa-n-pentanoate,
showing a discotic structure. [2]
Smart Windows with Permanent Memory Effect
2014
7
Figure I.7 - Lyotropic liquid crystal molecule [2]
Figure I.7 show the molecular structure of sodium dodecyl sulfate, this kind of molecules have a
hydrophilic polar head and a hydrophobic non-polar tail. [2]
The liquid crystal used in the present work, E7 by Merck, is a thermotropic calamitic liquid crystal and will be described in chapter 2.
Thermotropic Phases of a liquid crystal
There are three different phases of thermotropic calamitic liquid crystals: nematic, cholesteric and smectic phases.
Nematic phase
In this phase the molecules have no positional order, but they have orientational order. The
molecules orient themselves parallel to one another. [1]
Figure I.8 show the structure of a Nematic liquid crystal.
Figure I.8 - Structure of a nematic liquid crystal phase [2]
In the nematic phase the molecules have a preferential orientation and this orientation can be
8
Cholesteric phase
The cholesteric consist of a quasi-nematic layers, whose individual directors are turned by a
fixed angle on proceeding from one layer to the next. [2]
Figure I.9 show the structure of cholesteric liquid crystals.
Figure I.9 - Structure of cholesteric liquid crystals [2]
In each layer the molecules have an orientational order, this order varies according to a helical conformation.
Smectic phase
In this phase the molecules organize themselves in overlapping layers. There are two different smectic phases: smectic phase A (SA), when the direction vector are perpendicular to the surface of the layer and the smectic phase C (SC) when the direction vector form an angle different to
zero with the normal to the surface. [7]
Figure I.10 and Figure I.11 show the structure of smectic phase A (SA) and smectic phase C (SC).
In each mesophase, SA and SC, the molecules in each layer have a positional order. [7]
Figure I.11 - Structure of smectic C (SC) liquid crystal [2]
Smart Windows with Permanent Memory Effect
2014
9
1.1.3.
Liquid Crystals in an electric field
When an electric field is applied in a nematic liquid crystal it is possible that such application can move positive and negative charges in different directions, so, a dipole is produce, only
when an electric field it is applied, this dipole is named induced dipole. [6]
If the dipole moment is parallel to the molecular axis, then ∆𝜀 > 0 and the molecules tend to
orient along the electric field direction. [2]
Figure I.12 show the behavior of the molecules of LC, with ∆𝜀 > 0, in the absence (off) and
presence (on) of an electric field.
Figure I.12 - Effects of an electric field in a liquid crystal molecule [5]
1.2.
Polymer Dispersed Liquid Crystal
Polymer Dispersed liquid Crystal (PDLC) is a film constituted by micro domains of liquid
crystal dispersed in a polymeric matrix. [7]
There are several ways to prepare a PDLC: by emulsion and phase separation. In the first case, emulsion, the system remains heterogeneous during the process and in the second case, phase
separation, the system becomes heterogeneous. [8]
In the phase separation there are three different ways to prepare a PDLC: TIPS (Thermally Induced Phase Separation), SIPS (Solvent Induced Phase Separation) and PIPS (Polymerization
Induced Phase Separation). [9]
In this work the PIPS method was performed by thermal polymerization of a homogeneous mixture of polymerizable monomers/oligomers, liquid crystal and an initiator.
The PIPS method consists in mixing the liquid crystal with a monomers/oligomers, which act as a solvent for the liquid crystal. Polymerization can be induced through the application of heat.
10
The main advantage of preparation by PIPS method is the possibility to obtain a composite directly between glass plates coated with conductive indium tin oxide film without additional
laminating procedures. [8]
PDLC devices can be switched from an opaque scattering state to a transparent state when an electric field is applied. The polymer matrix material is optically isotropic so it has a single refractive index (np). The liquid crystal within the micro-domains has an ordinary refractive index (n0) and an extraordinary refractive index (ne). When an electric field, with sufficient strength to overcome the interactions between polymer matrix and liquid crystal at interfaces of LC domains in the polymer matrix, is applied across the film liquid crystal directors within each
droplet become uniformly oriented parallel to the direction of the field. [8]
If the refractive index of the LC matches with the refractive index of the polymeric matrix the
film becomes transparent. [8]
Figure I.13 show a schematic illustration of the average molecular orientation of the liquid crystal within micro droplets without and with an applied field.
Figure I.13 - Schematic representation of the average molecular orientation of the liquid crystal within the micro droplets without and with an applied field [11] adapted
It is possible to observe through the Figure I.14 that with the increase of the number of
polymerizable groups, the polymer network becomes more crosslinked. [12]
Figure I.14 - Evolution of the polymer network with the increasing of the number of the polymerizable groups of the monomer [13]
Smart Windows with Permanent Memory Effect
2014
11
In this work a monomer with three polymerizable groups (TMT), one monomer with four polymerizable groups (PE4A) and a co-polymerization with a monomer with four polymerizable groups (PE4A) and an oligomers with one polymerizable group (AP) were studied.
This three different monomers/oligomers were studied in order to increase the crosslinked of the polymer network and determinate if the permanent memory effect is influenced by this variation.
1.2.1.
Polymer Dispersed Liquid Crystal Matrix Morphology
The polymerization conditions, the nature of the liquid crystal and the polymerizable monomers determine the morphology of the polymer matrix.
There are two different morphologies in the PDLC: “Swiss Cheese” morphology and “Polymer Ball” morphology.
“Swiss Cheese” Morphology
In this morphology, liquid crystal droplets are embedded in the polymer matrix. [4] The
characteristics of this morphology and of the LC micro droplets are in strong dependence on the
parameters of the preparation and the type of polymeric matrix. [8]
Figure I.15 show a SEM image for Swiss Cheese morphology.
Figure I.15 - SEM image for Swiss Cheese morphology [14]
The liquid crystal molecules can have three different types of alignment with the polymer: Radial, Bipolar and Axial configuration.
The radial configuration occurs when the liquid crystal molecules are anchored with their long
axes perpendicular to the droplet walls. [11]
12
Figure I.16 - Radial configuration of a LC droplet [11]
The axial configuration of the liquid crystal droplets also occurs when the molecules are
oriented perpendicular to the droplet wall, but only when there is weak surface anchoring. [11]
Figure I.17 show the liquid crystal droplets with axial configuration.
Figure I.17 - Axial configuration of a LC droplet [11]
The bipolar configuration is obtained by tangential anchoring of the liquid crystal molecules,
this creates two points defects at the poles of the droplet. [11]
Figure I.18 show the liquid crystal droplets with bipolar configuration.
Smart Windows with Permanent Memory Effect
2014
13
“Polymer Ball” Morphology
In Polymer ball morphology the polymerizable monomers are phase-separated from the continuous liquid crystal and forms micro sized polymer balls, these micro sized polymer balls merge and form a large polymer network structure with diverse shapes of voids in which liquid
crystal exists. [14]
The polymer ball morphology it is characterized by asymmetric voids in the polymer matrix in
which the liquid crystal exists. [10]
Figure I.19 show a SEM image for Polymer Ball morphology.
Figure I.19 - SEM image for Polymer Ball morphology [8]
1.2.2.
Permanent memory effect and hysteresis
As described above, the PDLC can be switched from the opaque to the transparent state through the application of an electric field. When an electric field is applied it is possible to observe different types of electro-optical response, with hysteresis and without hysteresis.
The electro-optical response of PDLC is usually measured by ramping a PDLC up and down in
voltage and comparing the optical response at each voltage. [10]
One of electro-optical response for PDLC is when the increasing voltage curves is coincident to the decreasing voltage curve, electro-optical response without hysteresis When these curves are not coincident the PDLC show electrical hysteresis, this happens when transmittance with
increasing voltage is lower than the transmittance when the electric field is decreased. [8]
14
Figure I.20 - Electro-optical response of PDLC A: Without hysteresis; B: With hysteresis [8]
When the electric field is removed, in some PDLC films, it is possible to observe that the transmittance do not return to the initial value, this effect is called permanent memory effect (PME). This permanent memory effect occurs since the liquid crystal molecules could not relax back completely, but the molecules remain aligned in the direction of the electric field after its
removal. [15]
Figure I.21 show an electro-optical response with permanent memory effect.
Figure I.21 - Electro-optical response of PDLC with permanent memory effect [8]
In Figure I.1Figure I.21 the initial OFF state corresponds to the transmittance of the initial state, opaque state, where the applied electric field is zero.
It is possible to quantify several factors to characterize the permanent memory effect: the permanent memory effect (%PME), E90 and %C.
The permanent memory effect is defined by:
(%)𝑃𝑀𝐸 = 𝑇𝑜𝑓𝑓− 𝑇0
𝑇𝑀á𝑥− 𝑇0 × 100
T0 - Initial transmittance (%)
TMáx – Maximum transmittance when the voltage is applied (%) Toff – Transmittance when the voltage is removed (%)
Smart Windows with Permanent Memory Effect
2014
15
The percentage of memory state contrast can be defined by:
(%)𝐶 = 𝑇𝑜𝑓𝑓− 𝑇0
The E90 is the electric field required to achieve 90% of the maximum transmittance.
The permanent memory effect is thermally destroyed at a certain clarification temperature that
is, normally, below the nematic isotropic temperature. [14]
1.2.3.
Surface anchorage
The orientation of liquid crystal molecules is affected by the interaction between the polymeric
matrix and the domains of liquid crystal, this interaction as called anchorage. [16]
In nematic liquid crystals there is a relationship between the size and the shape of the liquid
crystal domains and the anchoring effect. [8] When the shape and the size of liquid crystal
domains increases the anchoring effect decrease. Strong anchoring forces hinder the alignment of liquid crystal molecules when an electric field is applied, which implies that the permanent
memory effect decreases with the increase of anchoring effect. [19]
Figure I.22 and Figure I.23 show an example of the alignment of liquid crystal molecules in the polymeric matrix without and with an electric field.
1.2.4.
PDLC applications
Due to its ability to switch from an opaque state to a transparent state, when an electric field is applied, PDLC have a variety of applications as reflective displays, electrically light shutters
and holographic gratings. [14][17]
The most popular application for PDLC are the smart windows. Smart windows are composed by two conductive glasses, between theses glasses is placed a PDLC. Initially the window is opaque, but with the application of an electric field the window switch to a transparent state.
Figure I.23 - Example of anchoring of liquid crystal molecules in the polymeric matrix with E ≠ 0 [12]
16
The PDLC with permanent memory effect only needs heat to switch to a transparent state, when the PDLC is transparent remains transparent until heat is applied, when this happen the PDLC returns to the opaque state.
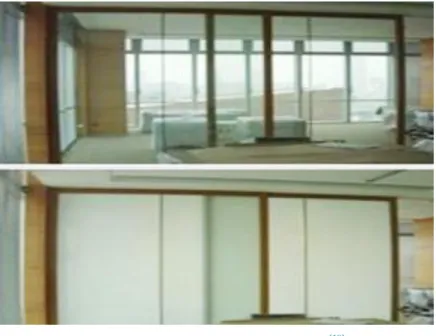
Figure I.24 show an example of a smart window in on state (transparent) and off state (opaque).
Figure I.24 - Example of a smart window [18]
Another property of PDLC with permanent memory effect is the possibility to store optical information in PDLC film. Is possible to write information with applied voltage, read the written information in a digital way (opaque or transparent states) and erase the information with the increase of temperature. After erase the information the devise returns to the opaque
state. [19]
Figure I.25 show a representative scheme of digital writing.
Smart Windows with Permanent Memory Effect
2014
17
II.
Chapter Two
2.
Materials and Methods
2.1.
Materials
2.1.1.
Monomers and oligomers
In this work, three commercial oligomers/monomers were used.
Trimethylolpropane trimethacrylate (TMT)
Figure II.1 - Molecular structure of TMT [20]
The monomer TMT has a molecular weigth of 338.40 g/mol and CAS number is 3290-92-4. [20]
Poly(propylene glycol) acrylate (AP)
Figure II.2 - Molecular structure of AP [21]
The oligomer has a average molecular weigth of, approxymately, 475 g/mol and CAS number
18
Pentaerythritol tetraacrylate (PE4A)
Figure II.3 - Molecular structure of PE4A [22]
The monomer PE4A has a molecular weight of 352.34 g/mol and CAS number is 4986-89-4. [22]
2.1.2. Liquid Crystal
The liquid crystal used in this work is E7, commercially by Merkc®. This liquid crystal is a
blend of various compounds forming a nematic liquid crystal.
Figure II.4 - Chemical structure of the components of E7 [8]
Smart Windows with Permanent Memory Effect
2014
19
Table II.1 - Composition of E7 [8]
Designation Molecular
structure IUPAC name
Composition in
the mixture TNI (ºC)
5CB C18H19N 4-Cyano-4’-n-
pentyl-1,1’-biphenyl 51% 35.3
7CB C20H23N 4-cyano-4’-n-
heptyl-1,1’-biphenyl 25% 42.8
8OCB C21H25NO octyloxy-1,1’-
4-cyano-4’-n-biphenyl 16% 80
5CT C24H23N pentyl-1,1’,1’’-
4-cyano-4’’-n-terphenyl 8% 240
This liquid crystal show a single nematic to isotropic transition (TNI) at 58.3ºC and a glass
transition (TG) at -62ºC. [23] [24]
2.1.2.
Initiators
The polymerization starts using agents able to form free radicals, which are denominated polymerization initiators. These initiators are decomposed using energy, in form of light or heat. In this work one thermal initiator, α,α-azobisisobutyronitrile were used.
α,α-azobisisobutyronitrile
Figure II.5 - Molecular structure of AIBN [21]
The molecular weight of AIBN is 164.21 g/mol and CAS number is 78-67-1. [21]
20
Figure II.6 - Decomposition of AIBN [8]
Each mixture has 1% of polymerization initiator (AIBN), elated to monomer/oligomer weight.
2.1.3.
Commercial Cells and Conductive Glasses
The cells for electro-optic studies were made by conducting glass coated by a layer of indium tin oxide (ITO).
Figure II.7 show a schematic ilustration of an ITO cell, LC2-20 by Instec [25]
Figure II.7 - Schematic illustration of an ITO cell [25]
Cell spacing is 20 µm and cell thickness is 1.5 mm and the ITO area occupies 25 mm2 of the
cell and this is the only area where voltage is applied where a resistance up to 100 Ω/□.[25]
To make the scale-up two conductive glasses with an area of 5 cm2 were used, these glasses has
a polyimide alignment layer.
Smart Windows with Permanent Memory Effect
2014
21
Figure II.8 - Schematic illustration of a glass to make a self-made cell
The self-made cells are constructed using two conductive glasses with a polyimide alignment layer, the spacing between the two glasses is achieve using a mylar with 23 µm of thickness.
In the self-made cells the conducive area it is around 3 cm2.
In Figure II.9 is possible to observe a schematic illustration for the self-made cell.
Figure II.9 - Schematic illustration for a self-made cell
The main difference between the commercial cells and the self-made cells is the conductive area and the type off spacers.
The commercial cells and the glasses are commercialized by Instec.
2.2.
Methods
2.2.1. Preparation of solutions
The solutions used in this study are a homogeneous mixture of monomer/oligomer, liquid crystal and an initiator in different proportions. In this work a co-polymerization between one monomer and one oligomer (PE4A and AP), the monomer TMT and the monomer PE4A were studied. Each solution has 0.5g. The initiator correspond a 1% (w/w) of the monomer weight. All solutions were weighted on a scale RADWAG analytical balance with four decimal digits.
All monomers/oligomers are commercialized with an inhibitor of polymerization. In order to remove the inhibitor of polymerization the monomers/oligomers were passed through a column
filled with a resin, polystyrene divinylbenzene, and is commercialized by Merck®.
22
2.2.2. Preparation of PDLC
In this work the preparation of the PDLC was made by phase separation by PIPS. This method consists in the preparation of a homogeneous mixture, compost by the monomer/oligomer, liquid crystal and an initiator. The polymerization starts at 64ºC, at this temperature the initiator forms the free radicals.
After the start of polymerization the liquid crystal begins to cluster into micro domains that arises in the polymeric matrix.
2.2.3. Polarized Light Microscopy analysis
A polarized optical microscope is a microscope that uses polarized light for investigating the optical properties of species, is frequently used to study the morphology of the anisotropic materials.
The microscope used in this work are the Olympus BH-2 optical polarizing microscope equipped with a Mettler Toled FP82HT hot stage (20ºC to 200ºC). The microstructures of the sample was monitored by taking microphotographs at determinate temperatures, using an Olympus Caedia C-5060 digital camera interfaced to a computer.
Figure II.10 show the microscope used in this work.
Figure II.10 - Microscope whit crossed polarizers
The polarized light microscope have two polarizers, one placed in the path of the beam before it reaches the material and a pipe between the objective and the eyepiece. The resulting contrast observed in the image arises from the interaction of polarized light with a birefringent sample plan, thus producing two perpendicular components: the extraordinary ray and the ordinary ray. [26]
Smart Windows with Permanent Memory Effect
2014
23
Figure II.11 - Functional diagram of POM [26]
2.2.4. Scanning Electron Microscopy analysis
SEM analysis is a technique of microscopy that use an electron beam to analyze the samples in a fine scale.
SEM analysis, gives the possibility to study the structure of the polymeric matrix and gives the possibility to available the spaces occupied by the liquid crystal.
The SEM used in this work is placed at CENIMAT FCT-UNL, SEM images were acquired by a Carl Zeiss Auriga crossbeam and the instrument were equipped with an Oxford energy
dispersive X-Ray spectrometer. [27]
Figure II.12 show the SEM installations on CENIMAT.
24
Sample preparation
Samples were polymerized in a Teflon disc at 74ºC. After the polymerization the liquid crystal was removed by acetonitrile. The samples were dried for a few days in a desiccator.
The sample was placed on a conductive metal support.
2.2.5. Electro-Optical analysis
The EO study of a PDLC allows the determination of several parameters from the measured transmittance. These parameters are: the maximum and the minimum transmittance, the E90, the PME and the percentage of the memory state contrast.
The E90 is the voltage required to obtain 90% of the maximum transmittance. [6]
The transmittance is determined by the ratio between the intensity of the beam after passing through the sample and the initial intensity.
The experimental assembly consists in an optical part and in an electric part.
The optical part consists in a diode array Avantes Spectrophotometer, AvaLight-DHS and AvaSpec 2048, using a wavelength at 633 nm.
The electric pulse is generated by a programmable waveform generator, Wavetek 20 MHz Synthesized Functional Generator Model 90, which creates an AC wave with a low amplitude between 0V and 27V. The generator is linked to a Vtrek TP-430 amplifier reaching a voltage of 47V and a transformer that works in a reverse mode and extends the input voltage by a ratio of
220
9 . The amplifier is fed by a Kiotto KPS 1310 power supply and the output detector,
AvaSpec-2048, is connected to a computer data acquisition software.
The voltage is measured using a multimeter, Iso-Tech IDM71, and the waveshape is observed by an oscilloscope, Tektronix TDS 210.
In the electric assembly there are two different resistances, the first resistance (1Ω) has the purpose of securing the amplifier of short-circuits and the second (150 kΩ) has the purpose to standardize the voltage wave.
Smart Windows with Permanent Memory Effect
2014
25
Figure II.13 - Electro-Optical assembly
Where,
1 – Housing lamps; 2 – Generator;
3 – Amplifier power supply; 4 – Transformer and resistances; 5 – Sample holder;
6 – Multimeter,
7 – Computer with analysis program; 8 – Amplifier;
9 – Oscilloscope.
The electro-optical study is divided in three different cycles, each cycle corresponding to 1 3⁄ ,
2 3
⁄ and 3⁄3 of the maximum voltage applied, this voltage correspond to, approximately, 400 V.
Each cycle have 35 points with the voltage increasing and 35 points with the voltage decreasing and each point have the duration of 1.2 second.
In the pulse, the voltage is applied to the sample for 200 ms and for 1000 ms the voltage is not apply, five measures are performed: three during the first 200 ms and two over the next 1000 ms.
8
26
Figure II.14 show the electric pulse applied to the sample.
Figure II.14 - Electric pulse applied to the sample [12] adapted
All measurements were performed at 1 kHz.
2.2.6. Differential Scanning Calorimetry analysis (DSC)
Differencial Scnanning Calorometry is a thermal analysis technique that looks at how a material’s heat capacity is changed by temperature. A sample of known mass is heated or cooled at a known velocity and the changes in the heatcapacity are tracked as changes in the heat flow.
This allows the detection of transitions like melting, glass transitions and phase changes. [28]
The glass transition (Tg) is the temperature above which the translational movement of the molecules starts. At this temperature a state change occurs, from a glassy state to a “plastic” state. Below this temperature the molecules only have vibrational motion and the translational motion is “frozen”. [29]
Figure II.15 show a schematic representation of the different transitions that can be observed in a DSC analysis.
Smart Windows with Permanent Memory Effect
2014
27
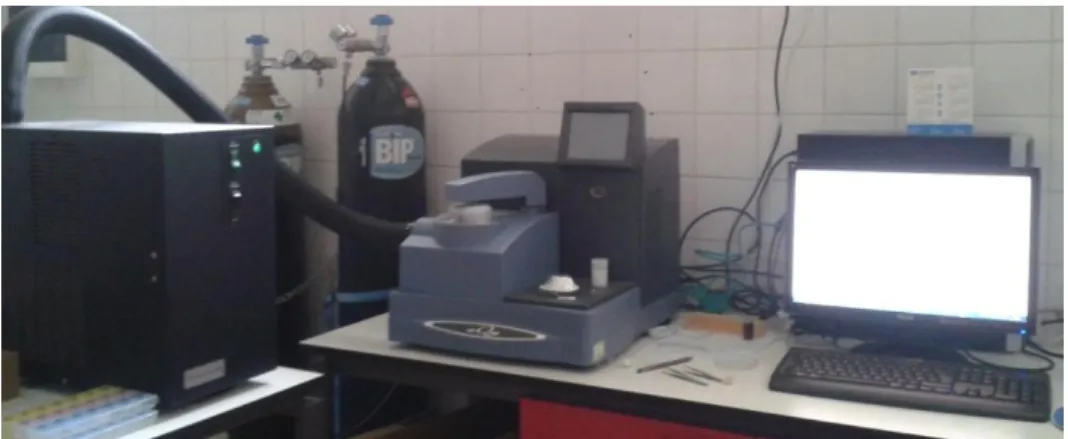
Figure II.16 show the DSC equipment using in this work.
Figure II.16 - DSC equipment
2.2.7. Viscosity measurements
Viscosity is the quantity that describes a fluid’s resistance to flow. Fluids resist the relative
motion of immersed objects through them as well as to the motion of layers with differing velocities within them.
The viscosity is the ratio between the shearing stress and the velocity gradient: [31]
η = Af × dνdZ x
In this work the equipment used was a Bohlin Gemini Hr Nano Rotational Rheometer with a coni-plate geometry, at stationary method.
Figure II.17 show the equipment used in this work.
28
2.2.8. Device to Erase the Permanent Memory Effect by Joule Heating
After the application of an electric field, the cell with PME lies transparent. To turn back opaque state, is necessary to heat the cell.
When there is an electric current in a conductor, the free electrons gain kinetic energy due to the work done on the free electrons by the field. However, steady state is soon achieved as the kinetic energy gain is continuously dissipated into the thermal energy of conductor by interactions between the free electrons and the lattice ions of the conductor, this mechanism for
increasing the thermal energy of conductor is called Joule heating. [32]
The Joule heating produces heat, so, when the cell is subject to an electric current with a provide voltage the ITO layer is heated and the molecules of LC lose their orientation, so the PDLC returns to the initial opaque state.
The Joule heating is related with the current intensity and resistance of the material: 𝑄 ∝ 𝐼2 𝑅
Where,
Q is the Joule heating,
I is the intensity of the current, R is the resistance
The Joule heating was used to erase the permanent memory effect.
The power supply used in this work is an AIM-TTi EX4210R, with a maximum voltage of 42V and a maximum current of 10A.
Figure II.18 show the power supply used in this work to produce Joule heating.
Smart Windows with Permanent Memory Effect
2014
29
III.
Chapter Three
3.
Experimental Results and Analysis
In this chapter, it will be described and analyzed the experimental results obtained in this work. The performance of PDLCs films using the monomers TMT and PE4A and using a co-polymerization between the monomer PE4A and the oligomer AP were studied using different techniques: electro-optical studies in order to determine the permanent memory effect of the PDLCs, Scanning Electron Microscopy in order to study the morphology of the polymer network, Polarized Light Microscopy which allowed to observe the distribution of the liquid crystal molecules in the polymer network before and after the application of an electric field and, with a temperature ramp at 1ºC/min, allows determine the clarification temperature of the PDLC, Differential Scanning Calorimetry to determine the Tg of monomers/oligomers and polymers, the nematic-isotropic temperature of the liquid crystal E7 and of the liquid crystal in the polymer network and viscosity measurements in order to understand if the viscosity can influence polymerization rate and the final matrix structure.
Scale-up was development in self-made cells using conductive glasses with polyimide alignment layer.
In order to erase the permanent memory effect obtained in the studied PDLCs, a device using Joule heating was tested.
30
3.1.
Study of the PDLC made by TMT polymer and E7 liquid crystal
The TMT is a monomer with three polymerizable groups, it was chosen a tri-methacrylate because wanted to study the crosslinked of the polymer network with the increase of the polymerizable groups.
3.1.1.
Electro-Optical response
Figure III.1, Figure III.2, Figure III.3 and Figure III.4 show the EO response for the PDLC with different proportion of E7/TMT.
Table III.1 show the main results for the EO response for different proportions of E7/TMT system.
0 50 100
0 10 20
T ra n sm itt an ce (% )
Electric field (V/μm) Electro-Optical response
LC/Monomer (50/50)
0 50 100
0 10 20
T ra n sm itt an ce (% )
Electric field( V/μm) Electro-Optical response
LC/Monomer (60/40)
0 50 100
0 10 20
T ra n sm itt an ce (% )
Electric field (V/μm) Electro-Optical response
LC/Monomer (70/30)
0 50 100
0 10 20
T ra n sm itt an ce (% )
Electric field (V/μm) Electro-Optical response
LC/Monomer (80/20)
Figure III.4 - EO response for the E7/TMT (80/20)
Figure III.3 - EO response for the E7/TMT (70/30)
Figure III.2 - EO response for the E7/TMT (60/40)
Smart Windows with Permanent Memory Effect
2014
31
Table III.1 - Resume for EO analysis E7/TMT
LC/TMT Polymerization time %C %PME Tmáx % E90 V/μm T0 Toff
50/50 1 day - - 32% - 27% 29%
60/40 1 day 9% 69% 25% 9.5 12% 21%
70/30 1 day 29% 78% 41% 10.7 4% 33%
80/20 1 day 49% 68% 73% 9.9 1% 50%
Table III.1 shows that with the increase of the proportion of LC the initial transmittance (T0) decreases and the final transmittance (Toff) increases, so the PDLC has an initial state more opaque and a final state more transparent with the increase of the proportion of LC.
3.1.2.
Polarized Optical Microscopy
Table III.2 show the POM analysis for the different proportion of E7/TMT.
Table III.2 - POM analysis for the different proportions of E7/TMT
LC/Monomer POM before EO POM after EO
50/50
60/40
70/30
80/20
Through the POM images it is possible to observe black regions of no birefringent material, i.e., regions where only polymer exist. These images are taken using crossed polarizes, so all material that is no birefringent appears black.
32
3.2. Study of the PDLC made by PE4A polymer and E7 liquid crystal
Following the study, the next monomer studied is a tetra-acrylate monomer, the PE4A, which is a monomer with four polymerizable groups.
3.2.1.
Electro Optical Response
Figure III.5, Figure III.6, Figure III.7 and Figure III.8 show the EO response for different proportions of E7/PE4A.
Table III.3 show the main results for the EO response for different proportions of E7/PE4A.
Table III.3 - Resume for EO analysis for E7/PE4A system
LC/PE4A Polymerization time %C %PME Tmáx % V/μmE90 T0 Toff TC
50/50 1 day 46% 63% 76% 10.25 3% 49% 61.2ºC
60/40 1 day 59% 80% 74% 8.7 0% 59% 59.9ºC
70/30 1 day 29% 43% 70% 7.5 1% 30% 59.4ºC
80/20 1 day 9% 14% 70% 6.75 5% 14% 60.3ºC
Figure III.6 - EO response for the E7/PE4A proportion 60/40
0 50 100
0 10 20
T ra n sm itt an ce (% )
Electric field (V/µm) Electro-Optical Response
LC/Monomer (60/40)
Figure III.5 - EO response for the E7/PE4A proportion 50/50
Figure III.7 - EO response for the E7/PE4A proportion 70/30
Figure III.8 - EO response for the E7/PE4A proportion 80/20
0 50 100
0 10 20
T rans m itt anc e (% )
Electric field (V/µm) Electro-Optical Response
LC/Monomer (80/20)
0 50 100
0 10 20
T rans m itt anc e (% )
Electric field (V/µm) Electro-Optical Response
LC/Monomer (70/30) 0
50 100
0 10 20
T rans m itt anc e (% )
Electric field (V/µm) Electro-Optical Response
Smart Windows with Permanent Memory Effect
2014
33
Through the EO response it is possible to conclude that the best LC/PE4A proportion is the 60/40 proportion. The permanent memory effect, for the 60/40 proportion, is 80%.
With the increases of the proportion of the PE4A in the mixture the E90 increases.
With the increases of proportion of E7 the micro domains of liquid crystal in the polymeric matrix increases and the anchorage force decrease, so the E90 decreases.
3.2.2. Polarized Optical Microscopy
Table III.4 show the POM analysis for the different E7/PE4A proportions.
Table III.4 - POM analysis for the different proportions of E7/PE4A
%E7 Before EO After EO At TC
50%
60%
70%
80%
34
3.3. Study of the PDLC using a co-polymerization made by PE4A and AP,
and E7 liquid crystal
Due to a monomer with four polymerizable groups forms PDLCs with a polymeric network highly crosslinked, a co-polymerization with an oligomer with one polymerizable group was studied, in order to decrease the crosslinking.
Many combinations of E7/(PE4A/AP) were made and Figure III.9 show a graph that relates the variation of the permanent memory effect with the variation of the proportion of PE4A/AP. All the EO analysis used to construct this graph are in the appendix chapter.
Figure III.9 – Variation of % PME with %E7 and %PE4A
In Figure III.9 is possible to observe an interval between 30% e 90% for PE4A where it is possible to achieve a good permanent memory effect, regarding for the liquid crystal the interval lies between 55% and 75%, this allows to conclude that the best percentage of liquid crystal to work it is 60%, with 40-80% to produce PDLCs with 100% of PME. There is no reference in bibliography for a higher PME such as this.
This chapter will speak only about the percentage of liquid crystal which is 60%.
Smart Windows with Permanent Memory Effect
2014
35
3.3.1. Electro Optical Response
Figure III.10, Figure III.11, Figure III.12 and Figure III.13 show the EO response for different proportions of PE4A/AP.
Table III.5 show the main conclusions obtained by observing the electro-optical response.
Table III.5 - Results of EO analysis for the percentage of E7 of 60% and the different proportions of PE4A/AP
PE4A/AP Polymerization
time %C %PME Tmax
E90
V/μm T0 Toff TC
25/75 1 day 19% 37% 52% 4.95 0% 19% 49.2ºC
50/50 1 day 76% 100% 85% 4.35 9% 85% 55.2ºC
75/25 1 day - - 18% - 3% 12% 54.7ºC
100/0 1 day 59% 80% 74% 8.7 0% 59% 59.9ºC
In Table III.5 it is possible to conclude that the best proportion of PE4A/AP is 50/50 for 60% of E7.
0 50 100
0 10 20
T rans m itt anc e (% )
Electric field (V/µm) Electro-Optical Response
PE4A/AP (25/75)
0 50 100
0 10 20
T ranm itt anc e (% )
Electric field (V/µm) Electro-Optical Response
PE4A/AP (50/50)
0 50 100
0 5 10 15 20
T rans m itt anc e (% )
Electric field (V/µm) Electro-Optical Response
PE4A/AP (75/25)
0 50 100
0 5 10 15 20
T rans m itt anc e (% )
Electric field (V/µm) Electro-OpticalResponse
PE4A/AP (100/0)
Figure III.13 - EO response for the percentage of E7 of 60% and PE4A/AP proportion of 100/0 Figure III.12 - EO response for the percentage of
E7 of 60% and PE4A/AP proportion of 75/25 Figure III.10 - EO response for the percentage of
E7 of 60% and PE4A/AP proportion of 25/75
36
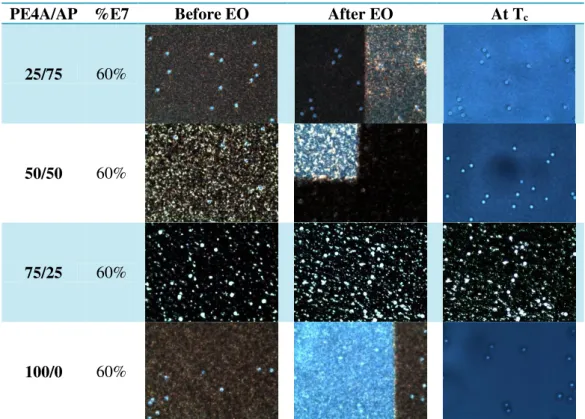
3.3.2. Polarized Optical Microscopy
Table III.6 show the POM analysis for the different proportions of PE4A/AP.
Table III.6 - POM analysis for the different proportions of PE4A/AP
PE4A/AP %E7 Before EO After EO At Tc
25/75 60%
50/50 60%
75/25 60%
100/0 60%
By the POM analysis is possible to observe that in proportion 75/25 of PE4A/AP there is many no birefringent material regions, that explains the EO response for this sample.
Smart Windows with Permanent Memory Effect
2014
37
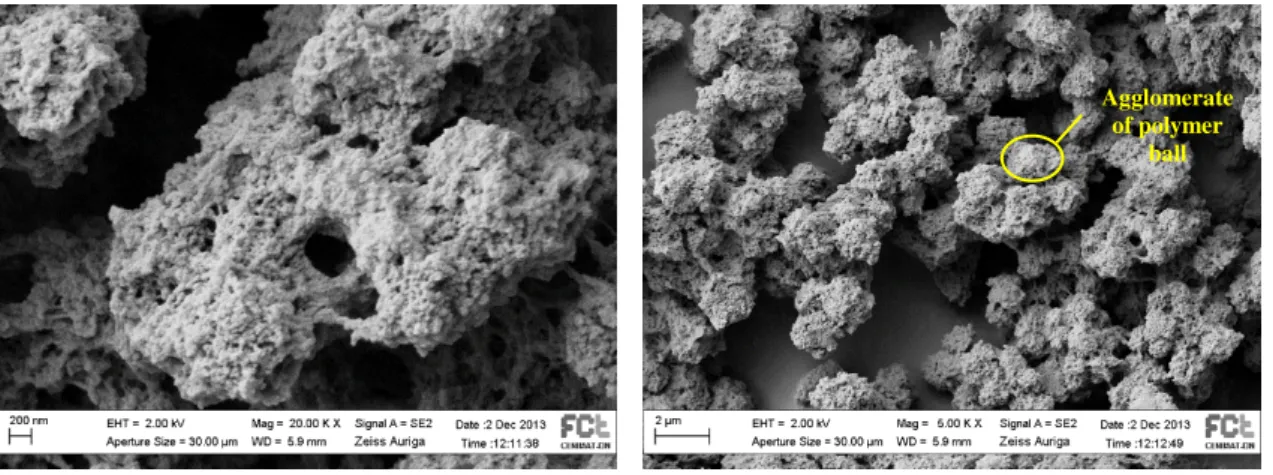
3.3.3. Scanning Electron Microscopy
Figure III.14 and Figure III.15 show the SEM analysis for the PE4A/AP proportion of 50/50.
By the images showed above it is possible to conclude that the polymer network struture is polymer ball type, and an polymer ball agglomerate showed a size between 1 µm and 2 µm. By observing the images, is not possible to measure the exact size of the polymer ball but its dimension is between 10-50 nm.
The same analysis was made for a sample with 3 days of polymerization and the structure is the same. Those images are in the appendix chapter.
Figure III.16 and Figure III.17 show the SEM analysis for the PE4A/AP proportion of 75/25.
Figure III.17 - SEM analysis for 60% of E7 and PE4A/AP proportion of (75/25) (Magnification of
5000 and 1 day of polymerization) Figure III.16 - SEM analysis for 60% of E7 and
PE4A/AP proportion of (75/25) (Magnification of 20000 and 1 day of polymerization)
Figure III.15 - SEM analysis for 60% of E7 and PE4A/AP proportion of (50/50) (Magnification of
5000 and 1 day of polymerization) Figure III.14 - SEM analysis for 60% of E7 and
PE4A/AP proportion of (50/50) (Magnification of 20000 and 1 day of polymerization)
Agglomerate of polymer
ball
38
By the images showed above it is possible to conclude that the polymer network struture is polymer ball type, and an polymer ball agglomerate showed a size between 1.5 µm and 2 µm and a polymer ball has the size of, approximatly, 50 nm.
The same analysis was made for a sample with 2 days of polymerization and the structure is the same. Those images are in the appendix chapter.
Figure III.18 and Figure III.19 show the SEM analysis for the PE4A/AP proportion of 100/0
By the images showed above it is possible to conclude that the polymer network struture is polymer ball type, and an polymer ball agglomerate showed a size between, 0.5 µm and 3 µm and a polymer ball has the size between, approximatly,50. nm and 70 nm.
The same analysis was made for a sample with 2 days of polymerization and the structure is the same. Those images are in the appendix chapter.
Figure III.19 - SEM for 60% of E7 and PE4A/AP proportion of (100/0) (Magnification of 5.000 and 1
day of polymerization) Figure III.18 - SEM analysis for 60% of E7 and
PE4A/AP proportion of (100/0) (Magnification of 20000 and 1 day of polymerization)
Smart Windows with Permanent Memory Effect
2014
39
3.3.4. Differential Scanning Calorimetry
In order to determine the Tg of the monomers/oligomers, the Tg of the polymers, the Tg of a mixture, the nematic isotropic temperature of the liquid crystal E7 and the nematic isotropic temperature of the liquid crystal E7 in the polymeric film of a PDLC, DSC analysis were performed.
In the DSC analysis a sample of known mass was heating and cooled at a known speed, the velocity of heating was 5ºC/min and the velocity of cooling was 10ºC/min.
AP
Figure III.20 and Figure III.21 show the two DSC heating cycles for oligomer AP.
40
Figure III.21 - DSC second heating cycle for AP
In the first cycle it is possible to observe the polymerization of the oligomer and the Tg of oligomer at -18.11ºC.
The second and the third cycles, show the DSC of the polymer AP and it is possible to observe the Tg related to the polymer at -53.36ºC and the Tg related to the leftover of the oligomer which was not polymerized at -20.39ºC.
A third heating cycle was made, the results were the same as for the second cycle.
PE4A
Figure III.22 and Figure III.23 show the two DSC heating cycles for monomer PE4A.
Smart Windows with Permanent Memory Effect
2014
41
Figure III.23 - DSC second heating cycle for PE4A
In the first cycle it is possible to observe the polymerization of the monomer and the Tg of monomer at -47.19ºC.
The second cycle show the DSC of the polymer PE4A and no PE4A polymer Tg was detected, although it was found in literature at 180ºC. [33]
A third heating cycle was made, the results are the same as for the second cycle.
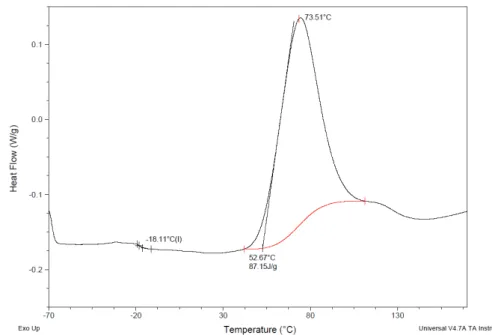
PE4A/AP (50/50)
Figure III.24 and Figure III.25 show the two DSC heating cycles for co-polymerization PE4A/AP (50/50).
42
Figure III.25 - DSC second heating cycle for PE4A/AP (50/50)
In the first cycle it is possible to observe the polymerization of the solution and it can be
observed two different Tg‘s, the first at -58.64ºC and this value correspond to Tg of the
monomer PE4A and the second at -11.63ºC and this value correspond to Tg of the oligomer AP. The second cycle show the DSC of the co-polymerized PE4A/AP (50/50) and it is only possible to observe one Tg at -19.17, probably corresponding to some AP oligomer, that was not polymerized in the first cycle.
A third heating cycle was made, the results were the same as for the second cycle.
E7
Figure III.26 and Figure III.27 show the two DSC heating cycles for E7 liquid crystal.
Smart Windows with Permanent Memory Effect
2014
43
Figure III.27 - DSC second heating cycle for E7
In the two cycles it is possible to observe the Tg of E7 liquid crystal at -60.7ºC and the nematic isotropic temperature (TNI) at 59.3-59.4ºC
PDLC using a co-polymerization made PE4A and AP, and E7 liquid crystal
Figure III.28 and Figure III.29 show the two DCS heating cycles for the PDLC using a co-polymerization made PE4A and AP, and E7 liquid crystal
Figure III.28 - DSC first heating cycle for the mixture
Mixture
monomer (40 %wt)
PE4A (50 %wt)
AP (50 %wt) E7
44
Figure III.29 - DSC second heating cycle for the mixture
In two cycles it is possible to observe a Tg at -60.56ºC, that Tg corresponds to the Tg of LC E7. It is possible to observe the TNI of liquid crystal in the PDLC film at 52.84ºC.
3.3.5. Viscosity measurements
Viscosity measurements were made to verify if the increase of the viscosity of the monomer mixtures could influence the polymerization.
Figure III.30, Figure III.31, Figure III.32, Figure III.33 and Figure III.34 show the variation of viscosity for the different PE4A/AP proportions.
0 0,05 0,1 0,15
0 50 100
V isc osi ty (Pa s)
Shear Rate (1/s) Viscosity PE4A/AP (0/100) 0 0,1 0,2 0,3
0 50 100
Vi
scos
ity
(Pa
s)
Shear Rate (1/s) Viscosity PE4A/AP (25/75)
Figure III.31 - Viscosity variation for PE4A/AP (25/75)