• Nenhum resultado encontrado

The different response of sugarcane genotypes in multiple stress

N/A
N/A
Protected

Academic year: 2019

Share "The different response of sugarcane genotypes in multiple stress"

Copied!
13
0
0

Texto

(1)

2018 | Lavras | Editora UFLA | www.editora.ufla.br | www.scielo.br/cagro

T

he different response of sugarcane genotypes in multiple stress

Diferente resposta de genótipos de cana-de-açúcar em múltiplo estresse

Francisco Bruno Ferreira de Sousa1*, Jairo Osvaldo Cazetta1, Sabrina da Silva Nascimento2

1Universidade Estadual Paulista/UNESP, Departamento de Tecnologia, Jaboticabal, São Paulo, Brasil 2Universidade Estadual Paulista/UNESP, Departamento de Solos e Adubos, Jaboticabal, São Paulo, Brasil *Corresponding author:bruno.uno2011@hotmail.com

Received in August 17, 2018 and approved in September 28, 2018

ABSTRACT

Research focused on identify abiotic stress-tolerant genotypes is highly desirable since their use may reduce costs of soil and crop management and productivity losses. The aim of this study was to determine the behavior of 24 sugarcane genotypes under high levels of Al3+ and Mn2+ associated with low availability of mineral nutrients. The experiment was carried out under greenhouse condition in a 24 × 2 factorial scheme (24 genotypes × 2 treatments: with and without stress), and four replications in completely randomized design. In the treatment without stress plants were grown in a complete nutrient solution whereas in the treatment with stress a nutrient solution with a high acidity (4.0 ± 0.1) and 5% of its original concentration, as well as a high concentration of aluminum (60 mg L-1) and manganese (700 mg L-1) was used. The genotypes RB966928, RB855443, IACSP96-3060, SP81-3250, RB867515, CTC 21, RB965902, and IAC91-1099 had their biometric characteristics

less affected by the stress, possibly due to the ability to continue the process of cell division and elongation and to maintain meristematic

viable regions, hence they were considered as the most tolerant. On the other hand, the genotypes RB965917, CTC 15, CTC17, RB855536,

CTC 2, CTC 20, and CTC99-1906 were the most sensitive to stress. Root system was the most affected by stress, with most genotypes showing

more than 70% reduction in root biomass. No relationship was observed between tolerance level of genotypes and the maturation cycles. Index terms: Abiotic stress; greenhouse; Saccharum spp; hydroponic alternative system.

RESUMO

Pesquisas científicas focadas em identificar genótipos tolerantes a estresse abiótico são altamente desejáveis, pois, o uso desses genótipos permite reduzir custos de manejo do solo, da cultura e perdas de produtividade. O objetivo desse trabalho foi determinar o comportamento de 24 genótipos de cana-de-açúcar sob elevados teores de Al3+ e Mn2+, associado a baixa disponibilidade de nutrientes.

O ensaio foi instalado e conduzido em casa de vegetação em delineamento inteiramente casualizado, num esquema fatorial 24x2, correspondendo a 24 genótipos, dois tratamentos (com e sem estresse), com quatro repetições. No tratamento sem estresse, as plantas foram cultivadas em solução nutritiva completa e no com estresse foi utilizada solução nutritiva com elevada acidez (4,0 ± 0,1) e com 5% da sua concentração original, além da elevada concentração de alumínio (60 mg L-1) e manganês (700 mg L-1). Os genótipos RB966928,

RB855443, IACSP96-3060, SP81-3250, RB867515, CTC 21, RB965902 e IAC91-1099 foram os que tiveram suas características biométricas menos afetadas pelo estresse, possivelmente devido a capacidade de continuarem o processo de divisão e elongação celular e manterem regiões meristemáticas viáveis, dessa forma, foram considerados os mais tolerantes. Por outro lado, os genótipos RB965917, CTC 15,

CTC17, RB855536, CTC 2, CTC 20 eCTC99-1906 foram os mais sensíveis ao estresse. O sistema radicular foi o mais afetado pelo estresse

sendo que a maioria dos genótipos apresentaram mais de 70% de redução da biomassa da raiz. Não houve relação entre o nível de tolerância dos genótipos com os ciclos de maturação.

Termos para indexação:Estresseabiótico; casa de vegetação; Saccharum spp.; sistema alternativo de hidroponia.

INTRODUCTION

Due to the growing demand from domestic and foreign markets for renewable fuels, sugar, and bioenergy, sugarcane (Saccharum spp.) has become increasingly important in the Brazilian scenario (Unica, 2017). Currently, along with their derivatives, sugarcane compose the second largest source of primary energy in the Brazilian energy matrix (Maia et al., 2018).

As a result, in recent years there has been a great expansion of sugarcane cultivation in Brazil (Goldfray et al.,

2010; Caldarelli; Gilio, 2018). With this expansion, sugarcane has advanced to regions of the west of São Paulo State and areas of the Brazilian Cerrado, which are characterized by acid soils, high levels of toxic elements such as aluminum (Al3+) and manganese (Mn2+), and generalized nutrient

deficiency (Sousa; Miranda; Oliveira, 2007).

The stress caused by Al3+ is among the most

(2)

The scientific research focused on identifying and understanding genotypes tolerant to these conditions is highly desirable since their use directly in the field or indirectly in breeding processes allows reducing costs of soil and crop management and productivity losses, which is reflected in an increased agricultural and industrial stability and yield (Too et al., 2014).

When there are no limiting climatic and soil factors, sugarcane develops a large part of its metabolically active roots from the soil surface up to about one meter deep and can reach up to two meters deep in the soil (Luchiari Junior, 1986). However, even correcting and fertilizing the soil arable layer, unfavorable chemical characteristics remain in the subsurface of soil, acting as a chemical barrier that limits root development in depth (Raij, 2011).

Considering that plants are routinely subjected to the interaction of different abiotic stresses, it seems coherent to consider that in these studies the genotypes be submitted to their combined effect (Carlin; Rhein; Santos, 2012). However, most studies with the aim at evaluating the behavior of genotypes to abiotic stresses are limited to studying one factor at a time (Fonseca Júnior et al., 2014; Maia et al., 2018). These studies are very important, but not indicated to choose genotypes for limiting environments such as those in crop expansion areas. In this context, this study aimed to determine the behavior of 24 sugarcane genotypes under high contents of Al3+ and Mn2+, associated with a low nutrient availability,

as well as verify the genetic variability related to this joint stress, the relationship between tolerance and maturation cycle (early, medium, and late), and determine the possible tolerant and susceptible genotypes.

MATERIAL AND METHODS

Experiments for methodology adjustment

The experiment was carried out in the São Paulo State University, Unesp, School of Agricultural and Veterinary Sciences (FCAV–UNESP), Jaboticabal, SP, located at the geographical coordinates 21°15′22″ S and 48°18′58″ W, with an altitude of 575 m, in the period from April 4 to July 23, 2017.

For carrying out this study, the nutritive solution was provided by means of the system described by Dantas et al. (2001). Briefly, seedlings were obtained from culm billets (3 cm length) containing one bud each and followed the methods described in Carlin, Rhein and Santos, (2012). After cutting, the culm billets were immediately planted in 500 mL capacity plastic containers with holes in the

lower part and containing washed and sieved (2 mm) sand. Seedlings were grown without any water restriction for 28 days. After this period, they were selected regarding sanity and homogeneity, being transplanted to 1 L capacity plastic pots (dimensions of 15 × 9 × 9 cm), with small holes at 0.5 cm from the bottom to allow the entrance of the nutrient solution, and containing 750 mlof washed sand. Then, the described plastic pots were placed in a tray with dimensions of 42 × 36 × 11 cm, in which was maintained a layer of 5 cm of nutritive solution, prepared according treatment of each assay. The level of solution was completed daily with distilled water and completely replaced by fresh solution every three days.

To test the mentioned hidroponic alternative system for sugarcane, and to define Al3+ dose and to find

the suitable solution nutrient strength, three preliminary tests were carried out in order to determine the best conditions to work in the main assay with genotypes. All these experiments were carried out in a greenhouse under the same conditions and with the same genotype (IACSP 95-5000). The IACSP 95-5000 is indicated for favorable environments (A1 - C2) and therefore is sensitive to acid and poor soils (Chaves et al., 2015).

The first one aimed to verify the efficiency of hydroponic alternative system in comparison to the traditional hydroponic system. This assay was carried out in a completely randomized design with two treatments (traditional hydroponic systems, and the alternative system) with 10 replications each. In both systems was used a complete nutrient solution (Furlani; Furlani, 1988) with adaptations for sugarcane, prepared with the following stock solutions: 3.1 ml L-1 Ca(NO

3)2 1.64 mol

L-1, 3.1 ml L-1 NH

4NO3 0.42 mol L

-1, 2.2 ml L-1 KCl 0.25

mol L-1, 2.2 ml L-1 K

2SO4 0.25 mol L

-1, 2.2 ml L-1KNO 3

0.24 mol L-1, 1.6 ml L-1 Mg(NO

3)2 0.96 mol L

-1, 0.2 ml L-1

KH2PO4 0.13 mol L-1, 0.6 ml L-1 FeDDH 0.16 mol L-1, 0.6

ml L-1 MnCl

2 0.08 mol L

-1, 0.6 ml L-1 H

3BO2 0.03 mol L -1,

0.6 ml L-1 ZnSO

4 0.005 mol L

-1, 0.6 ml L-1 CuSO4 0.001

mol L-1, and 0.6 ml L-1 Na

3MoO2 0.001 mol L -1, with

final pH adjustment to 5.5 ± 0.1 by using HCl 0.1 mol L-1 or NaOH mol L-1. For traditional hidroponic system,

a layer of 10 cm of nutritive solution was used kipping continuous aeration, while for alternative system, a 5cm layer was maintained in the tray without aeration. In both systems the level of solutions was completed daily with distilled water, and completely replaced by fresh solution every three days.

(3)

treatments consisted of eight Al3+ concentrations in the

complete nutrient solution (0, 10, 20, 30, 40, 50, 60, and 70 mg L-1), with three replications. Regarding the assay to

define the dilution to be used as low nutrient concentration associated with Al3+ and Mn2+ toxicity, the concentrations

of 0, 5, 10, 15 and 20% of the complete solution (Furlani; Furlani, 1988) were tested, maintaining fixed the doses of 60 and 700 mg L-1 of Al3+ and Mn2+, respectively, with

four replications.

In all three preliminary assays, plants were maintained under respective treatments for 30 days and evaluated for shoot and root dry matter.

Main experiment with 24 genotypes grown with and without stress

Location and experimental design

The experiment was performed in a greenhouse in a completely randomized design, in a 24 × 2 factorial scheme, consisting of 24 genotypes, two treaments (with and without stress), and four replications, totaling 192 experimental units. Seedlings used in this experiment were obtained and selected as mentioned for preliminary assays.

Genotypes tested

The 24 genotypes used in this study belong to three distinct groups regarding maturation, previously identified as early, medium, and late maturation cycle (Table 1). Seedlings were prepared as above mentioned, and propagules were obtained from plants with same age, grown in the FCAV-UNESP experimental farm, thus

submitted to the same conditions of management, climate, and soil.

Characterization of treatments with and without stress

For the treatment without stress, plants were grown in a complete nutrient solution (Furlani; Furlani, 1988) with adaptations for sugarcane and a pH of 5.5 ± 0.1. For the treatment with stress, the nutrient solution was only 5% of its original concentration, and with a high acidity (4.0 ± 0.1), containing high concentration of aluminum (60 mg L-1) and manganese (700 mg L-1), both applied in

the form of chloride. For determining the ionic strength of nutrient solution (5%) and the aluminum dose (60 mg L-1),

the results of the preliminary tests were taken as a basis and manganese concentration (700 mg L-1) was defined

based on the literature (Benett et al., 2012).

Solution level was corrected daily by adding distilled water, at that time, pH was also corrected. Trays were cleaned and solutions completely replaced every three days when all trays were randomly changed, as well as the seedlings in each tray, in order to keep all experimental units in a completely randomized design.

Analyzed variables

After 50 days, the following non-destructive assessments were performed: number of green leaves, number of dead leaves, stem height, stem diameter, plant height, and leaf area. The live leaves were considered those completely open and with at least 20% green area and the dead leaves were considered those with 20% less green area.

Table 1: Identification of genotypes and classification regarding maturation cycles.

Source: Agronomic Institute of Campinas (IAC, 2017), RIDESA, (2010), Sugarcane Technology Center (CTC, 2018), *described in Maia et al. (2018).

Maturation Cycles of Genotypes

Early Medium Late

No. Genotype No. Genotype No. Genotype

1 SP91-1049 9 SP81-3250* 17 SP83-2847

2 RB855443 10 IAC91-1099 18 SP80-3280

3 RB966928* 11 IACSP95-5094 19 IACSP95-5000

4 RB965902 12 IACSP96-3060 20 CTC 6

5 RB965917 13 CTC 2 21 CTC 15

6 CTC 9 14 CTC 20 22 RB855536

7 CTC17 15 CTC 24 23 RB867515*

(4)

Leaf area was determined following the methodology proposed by Hermann and Câmara, (1999). Green color index was determined by using a portable chlorophyll meter model CCM-200 (Opti-Scienses, Inc.), with three measurements in the leaf +1 of each plant, obtaining the green color index (GCI) data of leaf.

After non destructive measurements, plants were harvested, and separated into the shoot, roots, and culm billets. Root volume of plants was determined by immersing the roots in a graduated test tube with distilled water and measuring the displaced volume. All samples were then placed in properly identified paper bags, weighed to determine the fresh matter, and dried in a forced air circulation oven at 65 ± 5 °C until constant weight for determining the dry matter.

Considering that different genotypes have different growth potentials, the comparison of absolute values is not suitable to compare tolerance among genotypes. Because of that, for the main experiment, the relative growth (or relative growth imitation) was used to compare data, and tolerance among genotypes (Lima; Peixoto; Ledo, 2007; Maia et al., 2018). Thus, the average value of replications of each genotype without stress was considered to be 100%. Then, this value was used as reference to calculate relative values of all data obtained in all experimental units belonging to the same genotype. So these relative values were submitted to statistical analysis.

Statistical analysis

The results of the preliminary experiments were submitted to analysis of variance by the F-test and mean comparison by the Tukey’s test at a 5% probability level. In the experiment in which Al concentrations were tested, when a significant effect was detected, the polynomial regression analysis was applied by using the software AgroEstat (Barbosa; Maldonado Junior, 2015).

In the main experiment, analysis of variance (F-test) was carried out with relative data in a 24 × 2 factorial scheme (24 genotypes × 2 treatments). Mean comparison was carried out by the Scott-Knott test at 5% probability, also using the software AgroEstat (Barbosa; Maldonado Junior, 2015).

In order to observe the similarity among genotypes, a multivariate exploratory analysis was also carried out by using the software Statistica 7.0 (StatSoft. Inc, 2004), since it is commonly applied statistics to provide additional information on the response of genotypes to different environments (Fox; Crossa; Romagosa, 1997). In order to differentiate the clusters and their relationships with the studied variables, a non-hierarchical method was performed by the k-means grouping.

In addition, the factor analysis was used to identify the processes that would respond to the highest variabilities of the measured variables. For this, we first calculated the load values of provisional factors determined by the principal components analysis, which allowed to obtain components which eigenvalues were not lower than 1, following Kaiser (1958) criterion.

The principal component analysis was used as a technique to extract factors (Seal, 1964; Jeffers, 1978), which is based on the correlation matrix between variables. Factors with eigenvalues ≥ 1 were selected also by following also the Kaiser (1958) criterion. In order to identify the factors, the VARIMAX rotation method was adopted (Kaiser, 1958; Hoffmann, 1992), in addition to providing a better interpretation of factors, this method has as objective to obtain a matrix of loads more identifiable regarding the nature of the measured variables (Maxwell, 1977).

RESULTS AND DISCUSSION

Experiments for methodology adjustment

The hydroponic alternative system used in this study provided similar results (P > 0.05) to those observed for the traditional hydroponic system for all variables of growth and development of Sugarcane plants (Table 2). A better root development was obtained in the alternative system when compared to the traditional hydroponic system. This result is very important in this type of research since this variable is one of the most important to study the tolerance of plants to Al3+ toxicity (Ecco; Santiago; Lima, 2014; Maia et al., 2018).

The great advantage of this hydroponic alternative

system is that it allows assessing a large number of

experimental units in a much simpler and economical way since it does not need the oxygenation system of the nutrient solution. In addition, it allows a greater management control on the nutrient solution, as well as changing plant position randomly without the risk of damaging its root.

The results for the shoot and root dry matter with increasing Al3+ doses showed that the maximum applied

concentration (70 mg L-1) was not lethal for plants

(Figure 1A). For shoot dry matter (SDM), a decreasing linear effect was observed as the Al3+ concentration

increased, with an average weight of 5.19 and 4.38 g for the 60 and 70 mg L-1 doses, respectively. For root dry

matter (RDM), the same effect was also observed as the aluminum doses increased, with a mean weight of 3.11 and 1.80 g for the 40 and 70 mg L-1 doses, respectively.

(5)

concentration of up to 20% of the original values proposed by Furlani and Furlani (1998), where Al3+ and Mn2+ remained

constant. This was probably due to seedling age, i.e. at this stage, only the reserve still available in the culm piece is sufficient for plant development. In addition, symptoms of Al3+ toxicity in the shoot are not always readily identifiable

(Vitti; Mazza, 2002) and, unlike the root system, have a little direct effect of this element, mainly in relatively short-time (Rossiello; Jacob-Netto, 2006). The concentration that less affected root system was that of 5 and 10% of the nutrient solution (Figure 1B). Thus, the concentration of 5% is sufficient to lead to a nutritional stress and be assessed with the effect of Al3+ and Mn2+ without causing root death.

Main experiment with 24 genotypes grown with and without stress

As for the main experiment with the 24 genotypes, the analysis of variance showed a significant effect (P < 0.05) for genotypes, treatment, and the interaction genotype × treatment for all 14 biometric variables, except

for culm billets fresh, and dry weight. This result shows the existence of genetic variability among the 24 genotypes (Table 3). The significant effect of the treatment on the studied variables also indicates that the conditions were adequate to assess the proposed stress in sugarcane by using this new hydroponic system.

In the principal component analysis (PCA), two components were extracted, which explained 57.46% of the total variation, discriminating the genotypes in four groups (Figure 2A)

The first component (PC1) explains about 42% of the total variation of genotypes and has groups represented in green and blue colors, being strongly influenced positively by the variables of the shoot and root biomass (Figure 2A). Genotypes that are furthest from the origin, farther to the right and more aligned with the horizontal axis, are the most tolerant to stress. In turn, the red group, which presents totally opposite behavior of the genotypes of the green and blue groups, should be the most sensitive to the environment under stress.

Table 2: Means, least significant difference (LSD 5%), and standard error of the means (SE) of the biometric characteristics from sugarcane plants (IACSP95-5000) under traditional (HP) and adapted (AS) alternative system.

Figure 1: Values of the shoot and root dry matter of the genotype IACSP95-5000 submitted to Al doses (A) and different concentrations of nutrient solution (B).

Stem length (SL), plant height (PH), leaf area (LA), root fresh weight (RFW), shoot dry weight (SDW), number of green leaves (NGL), shoot fresh weight (SFW), root dry weight (RDW), root volume (RV), and stem diameter (SD), Means followed by the same

letter in the column do not differ statistically from each other by the Tukey’s test at 5% probability level.

Systems

Variables

SL PH LA RDW SDW NGL SFW RFW RV SD

---(cm)--- -(cm2)- ---(g)--- (N°) ---(g)--- -(ml)- (cm)

HP 22.85a 103.42a 284.37a 4.61b 8.23a 4.30a 35.98a 33.56a 49.65a 1.09a AS 21.05a 91.30a 236.94a 9.02a 8.48a 4.10a 32.55a 33.27a 47.75a 0.97a

SE ± 1.01 ± 6.56 ± 25.71 ±0.75 ±0.88 ± 0.16 ± 3.89 ± 2.24 ± 2.11 ±0.05

LSD 3.01 19.51 76.40 2.22 2.63 0.49 11.57 6.65 6.27 0.16

(6)

Figure 2: Biplot of scattering distribution of genotypes, and variables by the principal component analysis (A), Non-hierarchical k-means clustering method (B). SP91-1049(1), RB855443(2), RB966928(3), RB965902(4), RB965917(5), CTC 9(6), CTC17(7), CTC 21(8), SP81-3250(9), IAC91-1099(10), IACSP95-5094(11), IACSP96-3060(12), CTC 2(13), CTC 20(14), CTC 24(15), CTC99-1906(16), SP83-2847(17), SP80-3280(18), IACSP95-5000(19), CTC 6(20), CTC 15(21), RB855536(22), RB867515(23), and RB935744(24). Plant height (PH), leaf area (LA), root fresh weight (RFW), shoot dry weight (SDW), number of green leaves (NGL), number of dead leaves (NDL), shoot fresh weight (SFW), root dry weight (RDW), green color index (GCI), root volume (RV), stem diameter (SD), stem height (SH), culm billet fresh weight (CBFW) and culm billet dry weight (CBDW).

CV

Shoot

SDW LA NGL NDL PH GCI SFW

--- F Calculated ---Genotype (G) 3.52NS 1.35 NS 1.43 NS 1.38 NS 1.63 NS 0.27 NS 1.29 NS

Treatment (T) 401.98** 383.25** 457.99** 114.79** 894.75** 933.63** 677.64**

Interaction G × T 3.50 NS 1.31 NS 1.43 NS 1.38 NS 1.64 NS 0.27 NS 1.28 NS

SE ± 2.71 ± 12.93 ± 4.75 ± 13.44 ± 4.55 ± 9.05 ± 5.58

CV (%) 5.87 30.97 11.15 33.93 11.33 30.15 14

CV

Root, Stem and culm billets

RV RFW RDW CBFW CBDW SD SH

--- F Calculated ---Genotype (G) 0.36 NS 0.22 NS 1.11 NS 1.96 NS 1.69 NS 1.98 NS 1.33 NS

Treatment (T) 1230.86** 1046.8** 1352.8** 0.11NS 7.29** 280.86** 292.86**

interaction G × T 0.36 NS 0.22 NS 0.99 NS 1.96 NS 1.69 NS 1.98 NS 1.30 NS

SE ± 7.70 ± 8.77 ± 8.13 ± 8.92 ± 10.20 ± 5.60 ± 6.29

CV (%) 25.26 29.42 27.12 17.76 19.62 12.97 14.88

Plant height (PH), leaf area (LA), root fresh weight (RFW), shoot dry weight (SDW), number of green leaves (NGL), number of dead leaves (NDL), shoot fresh weight (SFW), root dry weight (RDW), green color index (GCI), root volume (RV), stem diameter (SD), stem height (SH), cause of variation (CV), culm billet fresh weight (CBFW), culm billet dry weight (CBDW), standard error

of the means (SE) and coefficient of variation (CV). * significant at 5% probability, ** significant at 1% probability e NS not

significant.

(7)

The second component (PC2) is responsible for 15.81% of total variation, presenting more relation with variables whose arrows are more aligned with the vertical axis of the graph. Therefore, the genotypes 12, 20, 18, and 24 are also influenced by stem height (SH), stem diameter (SD), and number of dead leaves (NDL). The variables GCI, number of dead leaves (NDL), and number of green leaves (NGL) did not present a strong influence on the groups discriminated by PC1, despite being indicators of tolerance (Inman-Bamber et al., 2008; Silva et al., 2011) (Figure 2A). The component PC2 was also responsible for dispersing some genotypes of the red group. The genotypes 5 and 22 were strongly influenced by the same variables responsible for the separation of the lilac group, while the genotypes 7 and 21 tended to present an opposite response to that observed by the components of the lilac group.

By analyzing the non-hierarchical k-means clustering results, we decided to define four clusters

based on the number of groups determined by principal component analyzes. This analysis allows better observing the separation of groups regarding the genetic variability, as well as their relationships with the evaluated variables (Figure 2B).

As for the pattern of division of genotypes within each group, no relation was observed with maturation cycles, that is, precocious, medium and late. The first cluster, formed only by the genotype 3 (Figure 2B) stood out with the highest variations for the variables of the shoot, root system, and GCI. The second cluster, formed by genotypes 1, 2, 4, 6, 8, 9, 10, 15, 17 and 23, presented the lowest variation and certainly formed by more tolerant and moderately tolerant genotypes to the tested stress, because it was above average for almost all biometric variables analyzed. The third cluster was formed by the genotypes 5, 7, 11, 13, 14, 16, 19, 21, and 22 and was well below the average for the variables. In this cluster, the genotypes 11, 13, 21, 7, and 5, which represent the cultivars IACSP95-5094, CTC2, CTC 15, CTC 17, and RB965917, respectively, were the most sensitive in the treatment with stress. The variation pattern of each cluster

is closely related to the average of each group. Therefore, the highest variation was observed for the genotype 3.

In relation to the factor analysis, we first calculated the load values of provisional factors determined by the principal components analysis, which allowed to obtain components which eigenvalues were not lower than 1, following Kaiser (1958) criterion. Approximately 77% of the data variability is explained by four principal factors. Thus, the results of the fourteen original variables were distributed into only four factors, each of them representing an independent physiological process (Table 4).

In the first factor, shoot dry mass, plant height, shoot fresh mass, root volume, root dry mass, and fresh root mass were the variables with the highest factor loads, explaining 41.65% of the total variation of the data (Table 4). This factor is related to the Al3+ and Mn2+

toxicity processes and the low nutrient content that must be occurring on the genotypes since the variables SDM, WPH, SFM, RV, RDM, and RFM are positively correlated with this factor (Table 5).

In the factor 2, the variables with the highest factor loads were culm billets fresh and dry weight, which presented an inverse correlation with Factor 2. This factor was responsible for 15.81% of the total variation of the 14 variables measured. Because they were included in a factor distinct from the Factor 1, they should not be related to Al3+ and Mn2+ toxicity associated with low nutrient

availability. However, these variables might be more related to the process of preparation of the culm billets for seedling production, possibly due to the variation in the diameter of the collected stems and to the imprecision of stem cutting (length) to obtain the culm billet.

In the third factor, the highest loads are related to the variables NGL and GCI, with values of − 0.826445 and − 0.722021, respectively, influencing 11.10% of the total variation. In addition, the fourth factor explained about 8% of the total variation and was composed of the variables NGL and GCI. Similarly, to the second factor, the third and fourth factors also appear to be unrelated to the stress process here studied. However, they are possibly related to

Table 4: Eigenvalues and percentage of variation explained by the first four principal components of biometric variables of the 24 genotypes under the stress treatment.

Factors Eigenvalues Variation explained (%) Accumulated Eigenvalues Var. explained Accumulated (%)

1 5.8314 41.65 5.8314 41.65

2 2.2127 15.81 8.0441 57.46

3 1.5545 11.10 9.5986 68.56

(8)

specific characteristics of the genotypes which responses are not related to the studied stress. Several factors can affect GCI index values, including the cultivar (Coelho et al., 2010). Moreover, the differential development and/ or growth index may present different values of GCI unit (Fontes; Araujo, 2007) and NGL.

As for the groups formed by the genotypes in the results of Scott-Knot clusters was not found clear relation with the maturation cycles of the genotypes (Table 6), confirming the results obtained by the non-hierarchical grouping method (Figure 2).

Taking into account that tolerance to abiotic stress is the plant ability to maintain stable growth (and values of other physiological parameters) when subjected to stressful conditions (Maia et al., 2018), it is suitable to say that genotypes with a lower variation of growth (and other variables) when comparing different environments can be characterized as tolerant. And, great variation indicates low tolerance. Therefore, the genotypes 3, 2, 12, 9, 23, 8, 4, and 10 had their biometric characteristics less affected under the proposed stress, and hence they were considered as the most tolerant genotypes (Table 6). This tolerance possibly is due to the ability to continue the process of cell division

and elongation and to maintain meristematic viable regions (Foy,1984). On the other hand, the genotypes 5, 21, 7, 22, 13, 14, and 16 were the most sensitive to the proposed stress, especially the first three genotypes.

The behavior presented by these two groups of genotypes showed great coherence with the reality in the field. For example, the genotypes of the group identified as tolerant are indicated and are actually being cultivated in acid-poor, nutrient-poor and drought-prone environments (Silva et al., 2012; Ridesa, 2017). The genotypes 3, 9 and 23 correspond to almost 50% of the planted area in the northeast region of the country and most of the Brazilian cerrado (Ridesa, 2015a; Ridesa, 2017), regions characterized by acid and nutrient poor soils. On the other hand, the genotypes identified as sensitive are indicated to production environments with good soil and climatic conditions (Ridesa, 2015a; Ridesa, 2017; CTC, 2018). In fact, genotypes 13, 21 and 22 do not reach 3% of the planted area of the Brazilian cerrado, and in the Northeast this percentage is less than 1% (Ridesa, 2015a; Ridesa, 2017). Therefore, it seems that the tolerance level presented by the genotypes may be related to the tolerance to aluminum.

Table 5: Factor matrix determined by the Varimax orthogonal rotation method.

Shoot dry weight (SDW), stem diameter (SD), plant height (WPH), culm billet fresh weight (CBFW), culm billet dry weight (CBDW), shoot fresh weight (SFW), leaf area (LA), stem height (SH), root volume (RV), root fresh weight (RFW), root dry weight (RDW), number of green leaves (NGL), number of dead leaves (NDL), and green color index (GCI).

Variables Factor 1 Factor 2 Factor 3 Factor 4

SDW 0.855719 -0.207812 0.103510 -0.015527

SD 0.363250 -0.571107 0.414618 -0.056875

PH 0.870576 -0.152480 -0.052741 0.117518

CBFW -0.222720 -0.814872 -0.213728 -0.002336

CBDW -0.033604 -0.880080 0.053417 0.221009

SFW 0.832106 0.029983 -0.027889 0.341067

LA 0.690493 0.160176 -0.062728 -0.430157

NGL 0.527029 0.332616 0.313223 0.607166

NDL 0.329085 -0.234881 -0.826445 -0.197130

SH 0.663707 -0.326518 0.110182 0.134335

RV 0.863993 0.207380 -0.012937 -0.215616

RFW 0.927236 0.015774 -0.020385 -0.203106

RDW 0.724444 0.089433 0.027531 -0.150444

GCI 0.178192 0.176984 -0.722021 0.511168

Expl.Var 5831409 2.212706 1.554565 1.164723

(9)

Among the biometric variables, the root system was the most affected by the stress caused by Al3+. In most

genotypes, stress limited to root biomass accumulation by more than 70% (Table 6). This result is higher than that found by Watt (2003) when assessing the growth of roots exposed to high Al3+ concentrations, who observed an inhibition of

root growth, with a variation between 36 to 46%.

This high limitation of root biomass production may be associated not only with Al3+ effect but also with

Mn2+ effect. In fact, although symptoms of manganese

toxicity in plants are more pronounced in leaves than in roots, when wheat tolerance to aluminum toxicity was determined together with that of manganese in nutrient solutions, all the genotypes showed a reduction in root growth ranging from 59 to 68% as Mn2+ concentrations

in nutrient solutions increased from 0.11 to 1200 mg L-1

(Camargo, 1995). The reduction of root dry matter due to the toxic effect of Mn2+ has also been observed in other

crops such as Rice (Lindon; Barreiro; Ramalho, 2004) and bean (Soratto et al., 2005).

Table 6: Mean comparison of genotypes under stress with the data transformed into a percentage for biometric variables by the Scott & Knott test at 5%.

Root volume (RV), root fresh weight (RFW), root dry weight (RDW, culm billet dry weight (CBDW), green color index (GCI), number of green leaves (NGL), and number of dead leaves (NDL) and culm billet weight (CBFW). Means followed by the same letter in

the column do not differ statistically from each other by the Scott & Knott test at a 5% probability level.

Genotypes

Variables

RV RFW RDW CBFW CBDW GCI NGL NDL

--- %

---SP91-1049(1) 17.96A 15.26A 7.89A 95.14B 91.40B 27.98A 68.00B 83.33A

RB855443(2) 25.77A 23.65A 20.10A 97.25B 105.70B 13.71A 86.96A 37.50B

RB966928(3) 40.54A 33.51A 26.19A 86.80B 83.33B 11.51A 71.43B 71.42A

RB965902(4) 28.57A 24.21A 21.43A 93.84B 102.10B 14.85A 64.70B 50.00B

RB965917(5) 13.57A 11.78A 10.02A 119.47A 123.30B 6.07A 50.00B 50.00B

CTC 9(6) 21.97A 20.70A 19.92A 92.56B 105.28B 22.40A 76.92A 42.85B

CTC17(7) 19.31A 15.54A 18.51A 87.51B 86.65B 11.02A 83.33A 22.22B

CTC 21(8) 28.41A 20.56A 23.32A 92.73B 98.74B 31.92A 75.00A 62.50B

SP81-3250(9) 30.00A 24.87A 30.86A 68.59B 117.01B 18.60A 82.61A 40.00B

IAC911099(10) 27.78A 23.42A 21.04A 88.57B 98.34B 26.61A 72.41B 50.00B

IACSP95-5094(11) 17.55A 12.08A 10.60A 102.44B 109.85B 18.32A 65.52B 37.50B

IACSP96-3060(12) 14.37A 18.69A 9.04A 113.87A 145.53A 19.71A 70.36B 62.50B

CTC 2(13) 18.62A 11.71A 6.09A 106.66A 104.27B 19.61A 68.97B 50.00B

CTC 20(14) 19.23A 13.32A 9.76A 104.65B 91.01B 27.03A 68.00B 62.50B

CTC 24(15) 20.00A 13.58A 12.80A 91.99B 96.37B 19.29A 76.92A 62.50B

CTC99-1906(16) 16.50A 12.66A 16.31A 101.72B 112.50B 13.39A 60.00B 25.00B

SP83-2847(17) 22.22A 21.60A 17.63A 85.24B 99.89B 25.46A 78.26A 62.50B

SP80-3280(18) 19.69A 21.69A 19.97A 146.20A 111.56B 22.66A 70.83B 80.00A

IACSP95-5000(19) 18.80A 15.77A 12.60A 111.18A 113.85B 22.85A 71.43B 50.00B

CTC 6(20) 26.80A 23.19A 27.11A 123.56A 131.26A 21.76A 66.67B 100.00A

CTC 15(21) 12.40A 10.52A 6.87A 72.34B 74.50B 21.68A 64.00B 50.00B

RB855536(22) 15.43A 14.82A 18.26A 116.85A 139.08A 11.10A 65.38B 83.33A

RB867515(23) 27.92A 25.69A 24.30A 94.57B 102.22B 29.88A 64.00B 116.66A

(10)

Although no statistical difference has been observed among genotypes regarding the reduction of root dry mass, those less affected also stood out in the other variables. This result reinforces the importance of this variable in the selection of genotypes to the stress caused by Al3+, Mn2+ and low nutrient avalilability.

Regarding GCI readings, no statistical difference was observed among genotypes under stress, even though it is considered as a good tool for genotype selection (Silva et al., 2011). Despite this result, pigment content in leaves was affected by the stress when compared to the

treatment without stress, indicating that only GCI reading does not seem to be enough to select genotypes for this variable at that stress level. Therefore, other analyses are recommended in future researches with the same focus.

The genotype 3 stood out with the best results for root volume, root fresh weight, and the second highest average for stem diameter and plant height. In addition, this genotype did not present a reduction in leaf area and shoot dry weight in the treatment with stress. A similar result for this latter variable was also observed for the genotype 2, composing the more tolerant group “A” to stress imposed (Table 7).

Table 7: Mean comparison of genotypes in the treatment with stress with data transformed into a percentage for shoot variables by the Scott & Knott test at 5%.

Shoot dry weight (SDW), stem diameter (SD), plant height (PH), shoot fresh weight (SFW), leaf area (LA), and stem height (SH). Means

followed by the same letter in the column do not differ statistically from each other by the Scott & Knott test at a 5% probability level.

Genotypes

Variables

SDW SD SH SFW LA PH

--- %

---SP91-1049(1) 87.98B 68.75C 72.76A 56.52A 62.68B 60.77B

RB855443(2) 100.47A 73.07C 74.72A 72.62A 37.19C 68.53A

RB966928(3) 101.35A 86.36B 82.27A 77.66A 112.08A 75.04A

RB965902(4) 84.11C 76.00B 78.81A 65.63A 19.04C 57.73B

RB965917(5) 77.12D 79.41B 64.18B 46.27B 11.26C 47.31B

CTC 9(6) 86.04B 78.57B 62.97B 60.90A 21.18C 62.97A

CTC17(7) 79.78C 68.00C 55.60B 52.06B 21.15C 53.37B

CTC 21(8) 84.24C 67.74C 56.58B 57.62A 28.38C 61.03B

SP81-3250(9) 83.88C 77.77B 77.83A 63.24A 25.45C 72.80A

IAC911099(10) 84.86C 83.87B 70.78A 62.21A 22.85C 60.55B

IACSP95-5094(11) 72.89D 78.12B 60.90B 45.49B 16.82C 52.96B

IACSP96-3060(12) 92.05B 104.54A 83.45A 67.94A 25.18C 68.92A

CTC 2(13) 78.05D 72.41C 54.92B 48.66B 15.53C 57.98B

CTC 20(14) 81.08C 76.00B 61.71B 51.86B 21.83C 49.97B

CTC 24(15) 86.98B 67.85C 65.47B 60.82A 21.33C 63.24A

CTC99-1906(16) 82.81C 66.67C 68.67B 53.71B 14.67C 58.52B

SP83-2847(17) 82.70C 67.64C 91.6A 57.39A 37.24C 58.76B

SP80-3280(18) 87.07B 76.66B 75.43A 63.84A 23.93C 60.95B

IACSP95-5000(19) 77.66D 70.27C 61.90B 51.18B 23.52C 54.72B

CTC 6(20) 87.44B 77.14B 67.59B 61.90A 36.07C 75.21A

CTC 15(21) 71.38D 65.71C 51.22B 39.55B 22.67C 51.44B

RB855536(22) 78.27D 43.24D 64.86B 49.82B 13.49C 46.81B

RB867515(23) 86.87B 58.33C 73.14A 60.24A 28.95C 68.57A

(11)

The most sensitive group “D” consisted of genotypes 5, 11, 13, 19, 21 and 22. The lowest averages for shoot dry weight were presented by the genotypes 21, 11, and 5 and, consequently, they presented the highest growth restrictions, which values that reached 28.62, 27.11 and 22.88%, respectively, while genotypes of the other groups showed reductions less than 20% (Table 7). This result is below that found by Ecco, Santiago and Lima, (2014) studying the interaction between types of abiotic stress (water deficit and soil acidity) in sugarcane under greenhouse conditions, and observed a reduction of 23% in shoot biomass production under stress caused by Al3+ and

69 % under water stress combined with Al3+ toxicity. Maia

et al. (2018) also found that the stress caused by Al3+ led to

an average reduction of 44% in shoot weight. Restrictions on shoot biomass accumulation due to Al3+ effect, among

other factors, occur due to a reduction in photosynthetic activity. Specifically, Al3+ interfering with the absorption

process of nutrients such as nitrogen and manganese may limit the formation and function of chloroplasts (Konrad et al., 2005; Mendes et al., 2018).

The genotypes 9, 23, 8, 4, and 10, even with a good performance, had a production below 100% for shoot biomass. Similar results were obtained by Maia et al. (2018), that assessed the phenotypic plasticity of 11 sugarcane genotypes under Al3+ stress and classified

the genotype 3 (RB966928) as the most tolerant, even presenting shoot with dry weight below the average, under both cultivation conditions.

The performance of more tolerant genotypes may be associated with their ability to exclude Al3+ from root apex

and/or with its accumulation through mechanisms such as Al3+ chelation in the cytosol, Al3+ compartmentalization in

the vacuole or in aluminum-protein bonds that are some mechanisms of tolerance to Al3+ (Hartwig et al., 2007;

Inostroza-Blancheteau et al., 2012).

In relation to stem length, the genotypes were classified into two groups. The genotypes 17, 12, and 3 were the least affected, presenting a limitation of only 8.36, 16.55, and 17.73%, respectively, while the genotypes 21, 13, 7, and 8 presented a higher restriction in stem growth (about 50%) in the treatment with stress (Table 7). This variable is considered as excellent indicators of tolerance to the proposed stress since they present a higher correlation with sugarcane production (Silva et al., 2008).

CONCLUSIONS

There is variability regarding the tolerance of the 24 sugarcane genotypes under the stress conditions caused by Al3+, Mn2+, and low nutrient availability. No relationship

was observed between tolerance level of genotypes and the maturation cycles. The genotypes RB966928, RB855443, IACSP96-3060, SP81-3250, RB867515, CTC 21, RB965902, and IAC91-1099 were identified as the most tolerant whereas the genotypes RB965917, CTC 15, CTC17, RB855536, CTC 2, CTC 20, and CTC99-1906 were identified as the most sensitive to high levels of Al3+

and Mn2+, associated to low nutrient availability.

AKNOWLEDGMENTS

The first author thanks to CNPq (National Council for Scientific and Technological Development) for grantinf a graduate scholarship. The second author also are grateful to the CNPq for the granting of research productivity scholarship.

REFERENCES

BARBOSA, J. C.; MALDONADO JUNIOR, W. AgroEstat - Sistema

para análises estatísticas de ensaios agronômicos. Jaboticabal: FCAV/UNESP, 2015. 396p.

BENETT, C. G. S. et al. Fontes e doses de manganês no acúmulo

de nutrientes na palhada em cana-de-açúcar. Bioscience Journal, 28(1):8-16, 2012.

CALDARELLI, C. E.; GILIO, L. Expansion of the sugarcane industry and its effects on land use in São Paulo: Analysis from 2000 through 2015. Land Use Policy,76(1):264-274, 2018.

CAMARGO, C. E. O. et al. Trigo duro: Tolerância à toxicidade

de alumínio, manganês e ferro em soluções nutritivas.

Bragantina, 54(2):371-383, 1995.

CARLIN, S. D.; RHEIN, A. F. L.; SANTOS, D. M. Efeito simultâneo

da deficiência hídrica e do alumínio tóxico no solo na cultivar IAC91-5155 de cana de açúcar. Semina-Ciências Agrárias, 33(1):553-564, 2012.

CHAVES, V. A. et al. Desenvolvimento Inicial de duas variedades

de cana-de-açúcar inoculadas com bactérias diazotróficas.

Revista Brasileira de Ciência do Solo, 39 (6):1595-1602, 2015.

CHEN, L. S. et al. Photosynthesis and photoprotective systems of plants in response to aluminum toxicity. African Journal

of Biotechnology, 9(54):9237-9247, 2010.

COELHO, F. S. C. et al. Nível crítico dos índices SPAD e de suficiência de N para avaliar o estado nutricional da batateira. Horticultura Brasileira, 28(2):3608-3614, 2010.

CTC - Centro de Tecnologia Canavieira. Boletim Técnico CTC

(12)

DANTAS, A. C. de M. et al. Tolerância ao alumínio em porta-enxertos

somaclonais de macieira cultivados em solução nutritiva.

Pesquisa Agropecuária Brasileira, 36(4):615-623, 2001.

ECCO, M.; SANTIAGO, E. F.; LIMA, P. R. Respostas biométricas em plantas jovens de cana-de-açúcar submetidas ao

estresse hídrico e ao alumínio. Comunicata Scientiae, 5(1):59-67, 2014.

FONSECA JÚNIOR, E. M. et al. The effects of aluminium on the photosynthetic apparatus of two rice cultivars.

Experimental Agriculture, 50(3):343-352, 2014.

FONTES, P. C. R.; ARAÚJO, C. Adubação nitrogenada de

hortaliças: Princípios e práticas com o tomateiro. Viçosa: UFV, 2007. 148p.

FOY, C. D. Physiological effects of hydrogen, aluminum and

manganese toxicity 916 in acid soil. In: ADAMS, F. (Ed.),

Soil Acidity and Liming, 2 ed. Agronomy Monogragh, p.57-97, 1984.

FOX, P. N.; CROSSA, C.; ROMAGOSA, I. Multi-environment testing and genotype x environment interaction. In: KEMPTON, R. A. (ed), Statistical methods for plant variety

evaluation. Chapman and Hall, London, p.117-138, 1997.

FURLANI, P. R.; FURLANI, A. M. Composição de pH de solução

nutritiva para estudos fisiológicos e seleção de plantas em condições nutricionais adversas. Campinas: Instituto

Agronômico. Boletim Técnico, 121, 1988. 34p.

GOLDFRAY, H. C. J. et al. Food security: The challenge of feeding 9 billion people. Science,327(5967):812-818, 2010.

HARTWIG, I. et al. Mecanismos associados à tolerância ao alumínio em plantas. Semina: Ciências Agrárias, 28(2):219-228, 2007.

HERMANN, E. R.; CÂMARA, G. M. S. Um método simples para estimar a área foliar de cana-de-açúcar. STAB – Açúcar, Álcool e Subprodutos, (17):32-34, 1999.

HOFFMANN, R. Componentes principais e análise fatorial. Piracicaba: Departamento de economia e sociologia rural. Escola Superior de Agricultura “Luiz de Queiroz”, Universidade de São Paulo, 1992. 25p.

INMAN-BAMBER, N. G. et al. Increasing sucrose accumulation in sugarcane by manipulating leaf extension and

photosynthesis with irrigation. Australian Journal of Agricultural Research, 59(1):13-26, 2008.

INOSTROZA-BLANCHETEAU, C. et al. Molecular and physiological strategies to increase aluminum. Molecular Biology

Reports, 39(3):2069-2079, 2012.

INSTITUTO AGRONÔMICO - IAC. Cultivares IAC. 2017. Available in:< http://www.iac.sp.br/cultivares/inicio/resultados.php>. Access in: December, 2017. 15p.

JEFFERS, J. N. R. An Introduction to System Analysis: With Ecological Applications. E. Arnold Publ., London, 1978. 198p.

KAISER, H. F. The varimax criterion for analytic rotation in factor analysis. Psychometrika, 23(3):187-200, 1958.

KONRAD, M. L. F. et al. Trocas gasosas e fluorescência da clorofila em seis cultivares de cafeeiro sob estresse de

alumínio. Bragantia, 64(3):339-347, 2005.

LIMA, J. F.; PEIXOTO, C. P.; LEDO, C. A. S. Índices fisiológicos

e crescimento inicial de mamoeiro (Carica papaya l.) em

casa de vegetação. Ciência e Agrotecnologia, 31(5):1358-1363, 2007.

LINDON, F. C.; BARREIRO, M. G.; RAMALHO, J. C. Manganese accumulation in rice: Implications for photosynthetic functioning. Journal of Plant Physiology, 161(11):1235-1244, 2004.

LUCHIARI JÚNIOR, A. et al. Manejo do solo e aproveitamento de água. In: GOEDERT, W. J. (Ed.). Solos dos cerrados:

Tecnologias e estratégicas de manejo. Brasília, DF: Embrapa Cerrados, 1986. p.285-322.

MAIA, C. et al. Phenotypic plasticity of sugarcane genotypes under Aluminum Stress. Journal of Experimental

Agriculture International,22(3):1-11, 2018.

MAXWELL, A. E. Multivariate analysis in behavioral research. London, Chapman and Hall, 1977. 164p.

MENDES, T. P. et al. Aluminum toxicity effect on the initial growth of yacon plantlets. Revista Ceres,

65(2):120-126, 2018.

RAIJ, B.V. Melhorando o ambiente radicular em subsuperfície.

Informações agronômicas. 2011. 10p.

RIDESA – Rede Interuniversitária para o Desenvolvimento do Setor Sucroenergético (2017). Censo varietal Brasil – 2016/17: Estados de AL, GO, MA, MG, MS, MT, PB, PE, PI, PR, RN e SP. Avaliable in: < https://www.ridesa.com. br/censo-varietal>. Aceess in March, 8, 2018.

RIDESA – Rede Interuniversitária para o Desenvolvimento do

Setor Sucroalcooleiro. Catálogo nacional de variedades

(13)

RIDESA – Rede Interuniversitária para o Desenvolvimento

do Setor Sucroalcooleiro. Liberação nacional de

variedades RB de cana-de-açúcar. Curitiba (PR), 2015a. 72p. Available in: <https://docs.wixstatic.com/

ugd/097ffc_630ca4e433634264a1315ef02f4fb1d5.pdf>.

Access in: July, 08, 2018.

RIDESA - Rede Interuniversitária para o Desenvolvimento

do Setor Sucroalcooleiro. 45 anos de variedades RB

de cana-de-açúcar: 25 anos de Ridesa. Curitiba (PR), 2015b. 156p. Available in:<https://docs.wixstatic.com/ ugd/097ffc_96da199c42e04e64baa981fff181f245.pdf>. Access in: August, 23, 2018.

ROSSIELLO, R. O. P.; JACOB NETTO, J. Toxidez de alumínio em plantas: Novos enfoques para velho problema. In: FERNANDES, M. S. (Ed.). Nutrição mineral de plantas.

Viçosa: Sociedade Brasileira de Ciência do Solo. 2006.

p.375-418.

SEAL H. L. Multivariate Statistical Analysis for Biologists. Mathuen, London, 1964. p.209.

SILVA, G. C. et al. Divergência genética entre genótipos de cana-de-açúcar. Revista Brasileira de Ciências Agrárias, 6(1):52-58, 2011.

SILVA, M. A. et al. Yield components as indicators of drought tolerance of sugarcane. Scientia Agricola, 65(6):620-627, 2008.

SILVA, S. D. A. et al. Recomendação de variedades de

Cana-de-açúcar para o estado do Rio Grande do Sul. Pelota, EMBRAPA CNPTIA, 2012. 22p. (EMBRAPA CNPTIA.

Comunicado Técnico, 292). Available in: <https://ainfo.

cnptia.embrapa.br/digital/bitstream/item/82133/1/ Comunicado-292-pgm.pdf >. Access in: July, 15, 2018.

SILVA, S. et al. Differential aluminium changes on nutrient accumulation and root differentiation in a sensitive vs.

tolerant wheat. Environmental and Experimental

Botany,68(1):91-98, 2010.

SORATTO, R. P. et al. Resposta de quatro cultivares de feijão ao manganês em solução nutritiva. Revista brasileira Agrociência, 11(2):25-24, 2005.

SOUSA, D. M.; MIRANDA, L. N.; OLIVEIRA, S. A. Acidez do solo

e sua correção. In: NOVAIS, F. R. et al. (Ed). Fertilidade do solo. Viçosa: Sociedade Brasileira de Ciência do Solo, 2007. p.205-274.

STATSOFT. Inc. Data analysis software system. Version 7. 2004. Available in: <http://www.statsoft.com/Products/ STATISTICA-Features>. Access in: 2004.

TOO, E. J. et al. Response of selected Sorghum (Sorghum bicolor. L Moencher) germplasmam to aluminium stress.

African Journal of Agricultural Research, 9(21):1651-1662, 2014.

UNICA - UNIÃO DA INDÚSTRIA DE CANA-DE-AÇÚCAR. Única

data. São Paulo: 2017. Available in: < http://www.unicadata.

com.br/>. Access in: January, 08, 2018.

VITTI, G. C.; MAZZA, J. A. Planejamento, estratégica de manejo e nutrição da cultura de cana-de-açúcar. Encarte Informações Agronômicas, (97):1-16, 2002.

WATT, D. A. Aluminum-responsive genes in sugarcane: Identification and analysis of expression under oxidative stress. Journal of

Imagem

Table 1: Identification of genotypes and classification regarding maturation cycles.
Figure 1: Values of the shoot and root dry matter of the genotype IACSP95-5000 submitted to Al doses (A) and  different concentrations of nutrient solution (B).
Table 3: Analysis of Variance for Major Effects and Interaction for all variables with relativized data.
Table 5: Factor matrix determined by the Varimax orthogonal rotation method.
+3

Referências

Documentos relacionados

desc_accao toca_sequencia_3 toca_sequencia_4 toca_sequencia_3 escolhe_resposta_3 nivel_seguinte toca_sequencia_4 toca_sequencia_3 toca_sequencia_2 toca_sequencia_1

Floral biology of Pilosocereus tuberculatus (Werderm.) Byles &amp; Rowley: a bat pollinated cactus endemic from the “Caatinga” in northeastern Brazil. British bat calls:

© 2003 John Wiley &amp; Sons, Ltd ISBN 0 470 84909 6 (cased) ISBN 0 470 84910 X (pbk) 4 Cosmological Models In Section 4.1 we turn to the ‘concordance’

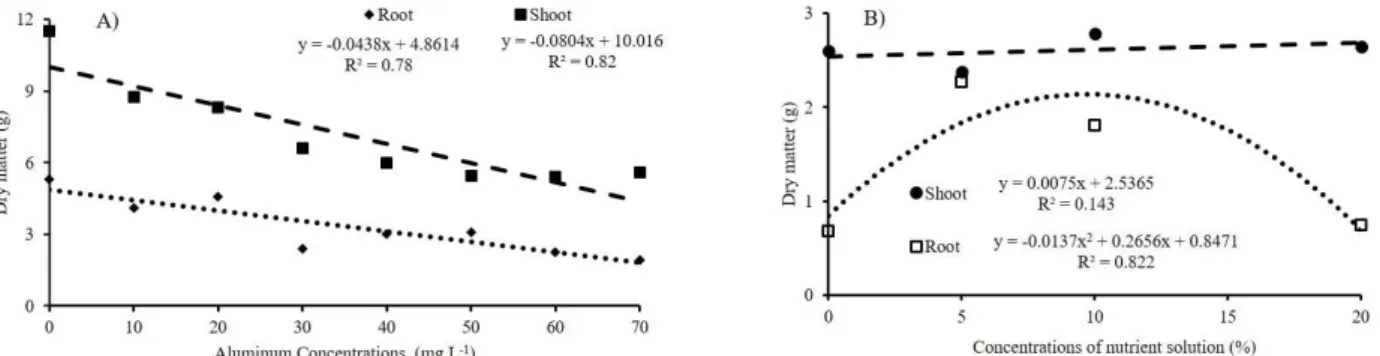
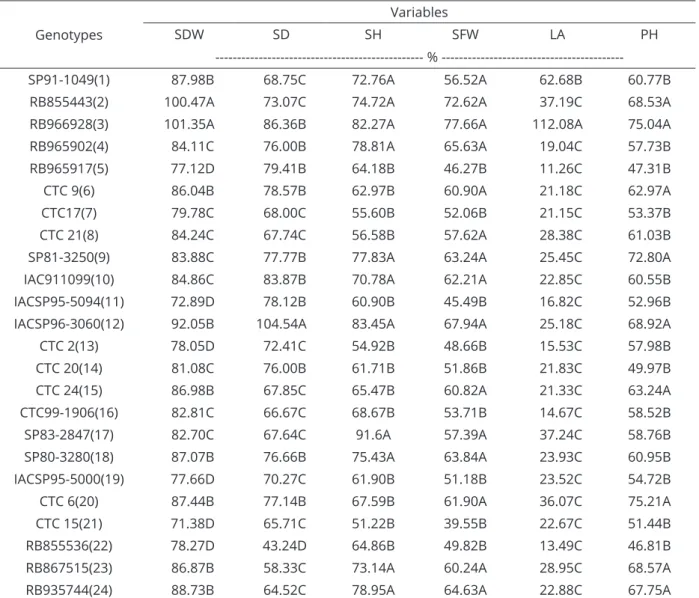
Regression adjustments for the variables: shoot length (with and without growth regulator); root length (cm); shoot and root fresh mass (g); shoot and root dry mass (g); leaf area

[...] c. Permitir que os indivíduos e a coletividade compreendam a natureza complexa do meio ambiente natural e do meio ambiente criado pelos homens como resultante da

Baseada no modelo de estágios de desenvolvimento de leitura (estágio logográfico, alfabético e ortográfico), Frith (1985) define a dislexia do desenvolvimento como

Similarmente ao que foi feito nos testes realizados anteriormente com a bobina de Rogowski apenas, as formas de onda observadas e registradas no osciloscópio utilizado são referentes

A partir dos estudos ressaltados neste tópico, é possível ver a importância de uma vida saudável, não só fisicamente como culturalmente, na qual sejam