38
THE FOSSILIZATION OF THE BRAZILIAN ELECTRIC MATRIX UNDER THE
LIFE-CYCLE ASSESSMENT PERSPECTIVE
Ricardo Mattos e Dinato1* and Luiz Kulay2
1 Center for Sustainability Studies, Business Administration School of São Paulo, Getúlio Vargas Foundation,
Av. 9 de Julho, 2029 – 11º floor – São Paulo/SP – Brazil – 01313-902 E-mail: [email protected], web: http://www.fgv.br/ces
2 Chemical Engineering Department, Polytechnic School, University of São Paulo, Av. Prof. Lineu Prestes,
580 – Bloco 18 – São Paulo/SP – Brazil – 05508-900
E-mail: [email protected], web: http://sites.poli.usp.br/pqi
Keywords Brazilian Electric Matrix, grid, Life-Cycle Assessment, Brazil
Abstract The increasing participation of fossil fuel thermoelectric plants in the Brazilian
electricity grid in the past few years has led to a worsening of its environmental impact, a correlation made evident by data on CO2 emissions divulged by the Ministry of
Science, Technology and Innovation (Ministério da Ciência, Tecnologia e Inovação, MCTI) for the National Interconnected System since 2006. Moreover, the environmental concerns are often limited to quantifying the emissions so as to inform the country’s energy planning.
The present study assesses the environmental impact of the Brazilian electricity grid during the period 2006-2013 in order to verify the environmental effects of the use of different sources in terms of Climate Change (CC), Consumption of Primary Energy (CPE), Freshwater Eutrophication (FEu), Terrestrial Acidification (TAc), Agricultural Land Occupation (ALO), and Natural Land Transformation (NLT). It was also made a comparison between CO2 emission data divulged by MCTI — who quantifies only the
burning of fossil fuel — and greenhouse gases emission (GHG) inside the Life Cycle Thinking model.
The results show an increase in the environmental impact in almost all categories. In FEu, the 2009 impact was only 46% when compared to 2013; for TAc, 2009 emissions were 53% when compared to 2013. In face of the LCT model, the emission data divulged by MCTI are revealed to be underreported. The results of both cases, however, are compatible in terms of variation trends. It is concluded that a systemic approach of the environmental impact of electricity generation would bring more subsidies for a more efficient energy planning.
1. INTRODUCTION
The Brazilian government often fails to consider environmental impact in its decision-making process for energy planning. When it does, it is often limited to the effects of Climatic Change.
The Ten Year Plan of Energy Expansion 2023 (Plano Decenal de Expansão de Energia 2023) [1] is the main agent for future action in the field. In environmental terms, the document considers renewable sources as important alternatives for lowering environmental impact —without specific development analyses — and estimates Greenhouse Gases (GHG) emissions from established directives. Another key document is the National Energy Plan 2050 (Plano Nacional de Energia 2050) [2], whose environmental focus is restricted to
39 climactic change, with brief reference to effects of ionizing radiation from nuclear sources.
For these reasons, modifications in the sources of electricity supply in Brazil have led to significant changes in environmental impact. Since 2006, the Ministry of Science, Technology and Innovation (Ministério da Ciência, Tecnologia e Inovação, MCTI) has disclosed carbon dioxide (CO2) emission data per unit of electricity generated in National
Interconnected System (Sistema Interligado Nacional, SIN), revealing an upward trend. [3] The present study analyzes the changes in the Brazilian grid, with a systemic focus made available by Life Cycle Thinking (LCT) on different kinds of environmental impact. Moreover, the paper compares data provided by MCTI — limited to CO2 emissions from
fossil fuel to generate power — with similar LCT data in order to discuss the effects of the different methodologies. It is expected that the conclusions will support a more effective energy plan for the country.
2. LIFE CYCLE MODELING
Life Cycle Modeling has a cradle-to-gate attributional focus for all modes of electricity generation of the Brazilian grid. The reference flow adopted was 1.0 MWh. Geographically, the data encompassed all the electricity available for use in Brazil, be it generated inside the country or imported. Temporally, it covered the period 2006-2013 so as to coincide with the MCTI horizon of measurement.
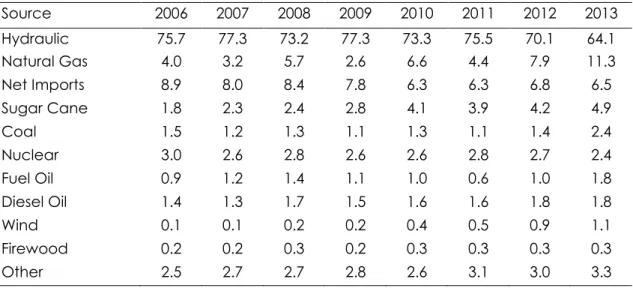
Table 1. Composition (%) of the Brazilian electricity grid in the period 2006-2013
Source 2006 2007 2008 2009 2010 2011 2012 2013 Hydraulic 75.7 77.3 73.2 77.3 73.3 75.5 70.1 64.1 Natural Gas 4.0 3.2 5.7 2.6 6.6 4.4 7.9 11.3 Net Imports 8.9 8.0 8.4 7.8 6.3 6.3 6.8 6.5 Sugar Cane Bagasse 1.8 2.3 2.4 2.8 4.1 3.9 4.2 4.9 Coal 1.5 1.2 1.3 1.1 1.3 1.1 1.4 2.4 Nuclear 3.0 2.6 2.8 2.6 2.6 2.8 2.7 2.4 Fuel Oil 0.9 1.2 1.4 1.1 1.0 0.6 1.0 1.8 Diesel Oil 1.4 1.3 1.7 1.5 1.6 1.6 1.8 1.8 Wind 0.1 0.1 0.2 0.2 0.4 0.5 0.9 1.1 Firewood 0.2 0.2 0.3 0.2 0.3 0.3 0.3 0.3 Other 2.5 2.7 2.7 2.8 2.6 3.1 3.0 3.3
Consumption and emissions data relative to each electricity source were collected from secondary data from Ecoinvent Database v.3.1 [4]. Environmental charges generated during electricity transmission, present in the Ecoinvent data, were excluded. The composition of the Brazilian grid during the 2006-2013 period was obtained through National Energy Balance (Balanço Energético Nacional, BEN) [5]. These data are presented on Table 1.
40 The sources under ―Other‖ — referring to supplementary energy sources such as black liquor, gas coke, waste, renewable and non-renewable secondary sources of energy — were excluded from the analysis, because of its minimal participation (2.5-3.3%) and the high level of imprecision associated to quantifying their use.
Brazil acquires and provides electricity to adjoining countries — the net balance is under ―Net Imports‖. The absence of official data on the provenance of these imports led to the adoption of secondary data from Ecoinvent [4]. Table 2 shows data on the electricity imported by Brazil according to country of origin, contribution percentage, and source. According to these data, 82% of the imported electricity comes from hydroelectric plants, and the remainder from natural gas thermoelectric plants.
Table 2. Origin and characteristics of the electricity imported by Brazil (2006-2013)
Country of origin Participation (%) Source
Paraguay 62 Hydraulic (100%)
Argentina 28 Natural Gas (66%) + Hydraulic
(34%)
Venezuela 6.0 Hydraulic (100%)
Uruguay 4.0 Hydraulic (100%)
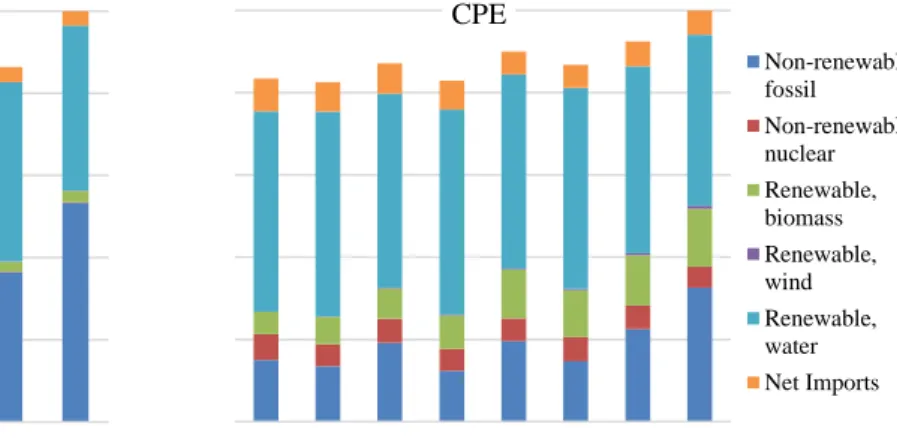
Figure 1 shows the result of the LC model. Sources were grouped into classes according to provenance of the primary energy, so as to make the presentation and analysis more concise.
Figure 1. LC-modeling from the Brazilian electricity grid
The environmental effects on six impact categories were quantified: Climate Change (CC), Consumption of Primary Energy (CPE), Terrestrial Acidification (TAc), Freshwater Eutrophication (FEu), Agricultural Land Occupation (ALO), and Natural Land Transformation (NLT). These estimates came from the application of the following Life Cycle Impact Assessment methods: IPCC 2007 GWP 100a for CC; ReCiPe Midpoint (H) – v.1.11 for FEu, TAc, ALO, and NLT; and Cumulative Energy Demand (CED) – v.1.01 for CPE.
41 2006 2007 2008 2009 2010 2011 2012 2013 TAc Non-renewable, fossil Non-renewable, nuclear Renewable, biomass Renewable, wind Renewable, water Net Imports 2006 2007 2008 2009 2010 2011 2012 2013 CPE Non-renewable, fossil Non-renewable, nuclear Renewable, biomass Renewable, wind Renewable, water Net Imports
3. RESULTS AND DISCUSSION
Figures 2-4 show the results of the study. The impact of the generation of 1.0 MWh in Brazil has two distinct stages within the analyzed period. The first one, 2006-2011, dominated by hydroelectricity (73.2-77.3%); the second one begins in 2012 with an increase in the role of thermoelectricity, with a prevalence of 22.5% in 2013. Out of this total, the largest portion comes from fossil fuels, such as natural gas, oil, and coal, which have been taking over the hydroelectric plants. This evolution is corroborated by CPE results shown in Figure 2.
Figure 2. Impact on Climate Change and Consumption of Primary Energy
The increase in the use of ― enewable, biomass‖ as a primary energy source was prompted by an increase in the use of sugar cane bagasse. Under CC, the emissions in 2009 accounted for 75% of the emissions in 2013.
Figure 3. Impact on Freshwater Eutrophication and Terrestrial Acidification
The prominent use of fossil fuels leads to increases in FEu and TAc (Figure 3). The impact on FEu in 2009 was only 46% when compared to 2013; as for TAc, emissions in 2009 were 53% of the emissions in 2013. 0% 20% 40% 60% 80% 100% 2006 2007 2008 2009 2010 2011 2012 2013 CC 0% 20% 40% 60% 80% 100% 2006 2007 2008 2009 2010 2011 2012 2013 FEu
42 2006 2007 2008 2009 2010 2011 2012 2013 NLT Non-renewable, fossil Non-renewable, nuclear Renewable, biomass Renewable, wind Renewable, water Net Imports
Figure 4. Agricultural Land Occupation (m2a) and Natural Land Transformation (m2)
According to Figure 4, the vast majority of the impact on ALO is due to the use of biomass — sugar cane bagasse (75%) and firewood (25%) — used in thermoelectric plants. This result was expected because of an increase in ― enewable biomass‖ in the national grid, as shown in Table 1. This occurs because of a trend in the installation of cogeneration systems in sugar and alcohol plants. NLT was the only category that showed a decrease during the period, due to a reduced reliance on hydroelectric plants.
Figure 5 compares CO2 emissions divulged by MCTI [3] with GHG values totaled for the
entire LC.
Figure 5. GHG emissions of the Brazilian electricity grid according to different approaches
It should be noted that there is a similar trend of increase and decrease in both methods, regardless of the values. This behavior shows the significant influence of ―Non-renewable, fossil‖ in the LCT results, even during the 2006-2011 period in which hydroelectricity was prevalent. In 2008 and 2010, years in which hydroelectricity use was lowest (73.2% and 73.3%), the R coefficient — which measures the ratio of emission data between LCT and MCTI — is at a low for the period (4.44 and 4.18). In other years, when hydroelectricity ranges from 75.5-77.3%, the ratio increases, 6.28 ≤ ≤ 7.72. Thus, when the role of fossil fuels in the grid increases, the values from the two methods get closer, thus R → 1.0. This occurred in 2012 and 2013, when the lowest R-values of the period were found (3.40 and 2.67).
0% 20% 40% 60% 80% 100% 2006 2007 2008 2009 2010 2011 2012 2013 ALO 32 29 48 25 51 29 65 96 201 197 213 193 213 198 221 256 0,0 0,1 0,2 0,3 2006 2007 2008 2009 2010 2011 2012 2013 GHG (kg CO2eq / MWh) Direct Emissions Life Cycle Thinking
43 4. CONCLUSIONS
The present study has analyzed, within a LCT perspective, the environmental impact caused by the variation in sources of electricity in the Brazilian grid. In addition, the CO2 emission data derived from the use of fossil fuels, as divulged by MCTI, was
compared with LCT data, so as to discuss specific aspects of both methodologies in terms of Energy Planning. The results have led to believe that the increase in the role of thermoelectric plants using fossil fuels in the Brazilian grid has also caused it to become more polluting. This trend, observed in terms of CC and CPE, is also seen in other impact categories: FEu, TAc, and ALO.
Comparison with the LCT model has revealed that the MCTI emission data are underreported. The results of both cases, however, are compatible in terms of variation trends. It seems that the upward trend in the role of thermoelectric plants will be confirmed. The MCTI has not yet published its 2014 report, but it can be projected from the available data the figure of 134 kg CO2/MWh, which is 40% higher than what was
reported in 2013. More detailed studies on this topic are encouraged in order to better plan reductions in environmental and economic impacts of the electricity sector. ACKNOWLEDGEMENTS
Luiz Kulay would like to thank CAPES for the financial support granted for this study, provided through the project CAPES / FCT 2012 – n. 350/13.
REFERENCES
[1] Ministério de Minas e Energia, Plano Decenal de Expansão de Energia 2023, Brasília (2014). Ciência
[2] Brasil, Ministério de Minas e Energia and Empresa de Pesquisa Energética, Demanda de
Energia 2050, Série Estudos da Demanda de Energia, Rio de Janeiro (2014).
[3] Brasil, Ministério da, Tecnologia e Inovação. Disponível em: <http://www.mct.gov.br/index.php/content/view/321144.html#ancora>. Acesso em 13 fev. 2015.
[4] Centre for Life Cycle Inventories, Ecoinvent version 3.1.
[5] Brasil, Ministério de Minas e Energia and Empresa de Pesquisa Energética, Balanço

![Figure 5 compares CO 2 emissions divulged by MCTI [3] with GHG values totaled for the entire LC](https://thumb-eu.123doks.com/thumbv2/123dok_br/19195691.951689/5.892.146.752.662.872/figure-compares-emissions-divulged-mcti-values-totaled-entire.webp)