Faculdade de Engenharia
Optimization of FPSO Glen Lyon Mooring Lines
Paulo Alexandre Rodrigues de Vasconcelos Figueiredo
Tese para obtenção do Grau de Doutor em
Engenharia Mecânica
(3º ciclo de estudos)
Orientador: Professor Doutor Francisco Miguel Ribeiro Proença Brójo
I would like to dedicate my thesis to the most important person for me, my son. He was born with twenty four weeks and with six hundred grams and lived for four weeks. He was the best fighter ever, he fought for his life like nothing I have ever seen before. We will meet again in heaven baby, daddy Loves you. You’re the best thing that has ever happen to me. Thank you for letting me be a dad for a month, thank you very much my son.
The thesis is also dedicated to my better half Vera Joaquim as well as to my family and friends. Thank you all for the support.
Acknowledgments
I would like to take this opportunity to express my sincere gratitude to Professor Francisco Miguel Ribeiro Proença Brójo for his dedication, encouragement, knowledge, availability and help. I would like to express my gratitude during the time as a student of Aeronautical Engineering Bachelor and Masters degree, during all the time of the PhD, as well as letting me perform the first steps in lecturing at the University the disciplines of Thermal engines, High flight Velocity and Aircraft Propulsion II.
I would like to thank to my present and past colleges of work at CEIIA, specially to Tiago Rebelo and Francisco Cunha.
I want to thank Orcina Team for loan me the software needed for my PhD, specially to Yvonne Morgan and Dave Thomas. Thank you for your support.
Last by not least I would like to thank Mr. Karl C. Strømsem for all the support regarding the development of the PhD. Your help was priceless. Thank you very much.
The current study was funded in part by Fundação para a Ciência e Tecnologia (FCT), under project UID/EMS/00151/2013 C-MAST, with reference POCI-01-0145-FEDER-007718.
Durante as operações de prospeção e extração de petróleo e gas em águas profundas e ul-tra profundas, o fundeamento de navios é um importante fator para o desenvolvimento do campo petrolífero. Para estas profundidades, infra-estruturas convencionais e.g. plataformas petrolíferas não são aplicáveis devido ao ambiente violento colinear e não colinear do local (lo-calização, ondas, correntes subaquáticas e de superfície, marés, etc.). Para conjuntos de poços subaquáticos, é comum o uso de Platformas de produção, armazenamento e descarga (FPSO) como plataforma de superficie para periodos de exploração longos.
Os custos subaquaticos referem-se ao custo do projeto marinho e normalmente incluem os custos de capital capex e custos operacionais opex. Na produção de hidrocarbonetos os capex e os opex aumentam exponencialmente com o aumento da profundidade, resultando na necessidade do desenvolvimento da fase de projeto detalhado necessário para análises de componentes para verificar a resistência dos mesmos, dutilidade e fadiga, quer na rigidez, instabilidade, corrosão, etc.
O projeto de campos petrolíferos são na maioria das vezes sobreestimados (de forma bastante conservativa) devido a imensos requisitos e modelos complexos de avaliação de custos. Após projeto e instalação de todas as infraestruturas e componentes, assim como durante o longo pe-riodo útil de extração de hidrocarbonetos, toda a ancoragem deve suportar as cargas ambientais de forma a não comprometer a operação.
Cada campo petrolífero possui um desenvolvimento singular, uma vez que os fenómenos ambi-entais são únicos em cada localização do globo terrestre. Este trabalho refere a optimização de um sistema de amarração para águas profundas para o campo de Schiehallion, ou por outras palavras, todo o desenvolvimento de ancoragem de um navio FPSO, desde o posicionamento no local com as forças ambientais e as caracteristicas do navio (Orcaflex), posterior otimização do sistema de ancoragem por um sistema equivalente (Matlab), desenho mecânico do sistema de ancoragem (CATIA), cálculo estrutural detalhado (Altair e Nastran) e análise de vida à fadiga. De forma a reproduzir o processo de ancoragem, é efetuada uma comparação inicial do FPSO inicial (Schiehallion FPSO) que esteve em operação no local desde 1993 até à sua substituição pelo novo navio (Glen Lyon FPSO), através da implementação e gestão do campo petrolífero de acordo com os poços antigos como os poços descobertos recentemente. A posterior otimização de todo o sistema de fixação foi verificada assim como a análise estrutural final detalhada dos componentes específicos em localizações especificas com grande probabilidade de falha. Através deste trabalho, todo o processo que leva à otimização das linhas de amarração do Glen Lyon é completamente detalhado desde a análise do navio ao detalhamento do desenho mecânico, os constrangimentos e requisitos que foram aplicados, estudos e opções efetuadas durante a fase de desenvolvimento crítico são apresentados e discutidos.
Palavras-chave
Sistema de amarração em catenária, sistemas de fundeamento, ancoradouro offshore, corrente com e sem elo central, otimização de amarras.
During oil and gas inspection and extraction operations both in deep and ultra-deep water, vessel mooring is a very important factor for the development of oil fields. For these depths, standard stand-alone surface facilities e.g. jack up rigs or offshore fixed platforms are not suitable due to the harsh collinear and non-collinear environment in-situ (location, waves, surface and underwater current, sea tides, ice, etc.). For deep sea wells clusters, it is usual to use floating production storage offloading (FPSO) as surface platforms for long time exploitation periods. Subsea expenditure, refers the cost of the subsea project and generally includes the capital expenditures (capex) and operational expenditures (opex). In the production of hydrocarbons
capex and opex exponentially increases with increasing depth, resulting in a need for precise
de-tailed design phase for analysis of systems to verify components strength, ductility and fatigue, stiffness, instabilities, corrosion etc.
The design of oilfields is most of the times overrated (in a very conservative way) due to several requirements and complex models of costs evaluation. After detailed phase and installation of all facilities and components, as well as due to the expected life design for hydrocarbons exploitation all anchoring system shall withstand the environmental loads in order to not com-promise the operation.
Each oilfield has a unique development, since environmental phenomena are unique in each earth location. This work refers to the optimization process of an anchoring system for deep waters in the Schiehallion Field, or in other words, the complete development of the moor-ing system for a FPSO, from the positionmoor-ing in-situ with environmental conditions and vessel characteristics (Orcaflex), further optimization of the mooring system for an equivalent system (Matlab), mechanical design of the mooring system (CATIA), structural detailed analysis (Altair and Nastran) as fatigue life analysis.
In order to reproduce all the mooring process, it is performed and initial comparison of the former FPSO (Schiehallion FPSO) that has been working in-situ since 1993 till its replacement for the new vessel (Glen Lyon FPSO). Due to the latest discoveries in the oilfield, the project has to be redesigned alongside with former wells and having in consideration recent discovered wells. Further optimization of the complete fixation system was verified as well as finally detailed structural analysis of specific components in key locations with higher margin of failure. Within this work, all the methodology which led to the optimization of Glen Lyon mooring lines was fully detailed from vessel analysis to detailed mooring mechanical design, constraints and requirements were applied, trade-offs and assumptions made during this critical development phase are presented and discussed.
Keywords
Catenary mooring system, mooring lines, offshore anchoring, studlink and studless chain, moor-ing lines optimization.
Contents
1 Introduction 1
1.1 Motivation . . . 1
1.2 Purpose and Contribution . . . 2
1.3 Research objectives . . . 4
1.4 Thesis Outline . . . 5
2 Literature Review 7 2.1 The Oil and Gas Industry . . . 7
2.2 The Offshore Oil & Gas . . . 8
2.3 Oil Field Main Components and facilities . . . 11
2.3.1 Topside structures . . . 11
2.3.2 Seabed Components . . . 11
2.3.3 Connection between structural elements . . . 13
2.4 The Schiehallion Oil Field . . . 14
2.5 Schiehallion FPSO VS Glen Lyon FPSO . . . 16
2.5.1 Schiehallion FPSO . . . 16
2.5.2 Glen Lyon FPSO . . . 18
2.6 Mooring Systems . . . 21
2.7 Mooring Line Components . . . 24
2.7.1 Studless Vs Studlink chain elements . . . 25
2.7.2 Sheathed spiral strand steel wire rope . . . 26
2.7.3 Suction piles . . . 28
2.7.4 Regulation and Norms . . . 29
2.8 Environmental condition . . . 30
2.8.1 Waves . . . 31
2.8.2 Wind . . . 35
2.8.3 Sea Currents . . . 37
2.9 State of the art - Mooring Systems . . . 39
2.10 Remarks . . . 48
3 Mooring analysis 49 3.1 Natural periods and frequencies . . . 49
3.2 Current and Wind Loads on FPSO Structures . . . 50
3.2.1 Current Loads on FPSO Structures . . . 50
3.2.2 Wind Loads on FPSO Structures . . . 51
3.3 Statics of mooring lines . . . 51
3.3.1 Method of Analysis . . . 52
3.3.2 Maximum Design Conditions . . . 52
3.3.3 Catenary equations - Inelastic . . . 56
3.3.4 Catenary equations - Elastic . . . 60
3.4 Glen Lyon analysis methodology . . . 62
3.4.1 Five component mooring line . . . 63
3.5 Dynamic of mooring lines . . . 65
Optimization of FPSO Glen Lyon Mooring
3.6 The model . . . 67
3.6.1 The software: Orcaflex . . . 67
3.6.2 Initial considerations and assumptions . . . 68
3.6.3 Boundary Conditions . . . 69
3.6.4 Objects and elements . . . 71
3.6.5 Mesh elements . . . 74
3.6.6 Mesh Convergence . . . 75
3.7 Results . . . 76
3.8 Conclusions . . . 81
3.9 Next steps . . . 82
4 Mooring line Optimization 83 4.1 Mooring line costs . . . 83
4.2 Requirements & opportunities . . . 85
4.3 Optimization . . . 87 4.3.1 Software . . . 87 4.3.2 Methodology . . . 87 4.3.3 Genetic algorithms . . . 89 4.3.4 Script/code assumptions . . . 90 4.4 Results . . . 91 4.5 Conclusions . . . 95 4.6 Next steps . . . 97
5 Design and strength analysis 101 5.1 Structural design . . . 101
5.1.1 Design specifications . . . 102
5.1.2 Design criteria . . . 102
5.1.3 Loads . . . 104
5.1.4 Mooring design . . . 105
5.1.5 CAD - Dassault Catia V5 . . . 105
5.2 Structural analysis - FEM . . . 107
5.2.1 FEM - Finite element method . . . 108
5.2.2 Finite element method - Steps and theory . . . 109
5.2.3 Stiffness criteria . . . 111
5.2.4 Load sign convention and reference systems . . . 111
5.2.5 Materials . . . 112
5.2.6 Software - Nastran & Altair . . . 112
5.2.7 FEM model description . . . 113
5.2.8 FEM Mesh convergence . . . 114
5.2.9 Connections, constraints and forces . . . 115
5.2.10 Results . . . 117
5.2.11 Fatigue life . . . 126
5.3 Conclusions . . . 127
6 Conclusions & Final remarks 129 6.1 Conclusions . . . 129
6.1.1 Summary of the thesis . . . 129
6.1.3 Difficulties and limitations . . . 132
6.1.4 Future work . . . 133
6.2 Publications during this work . . . 133
6.2.1 Publications dissertation related . . . 134
6.2.2 Publications dissertation non related . . . 134
Bibliografia 135 A Annexes 143 A.1 Riser analysis assumptions . . . 143
List of Figures
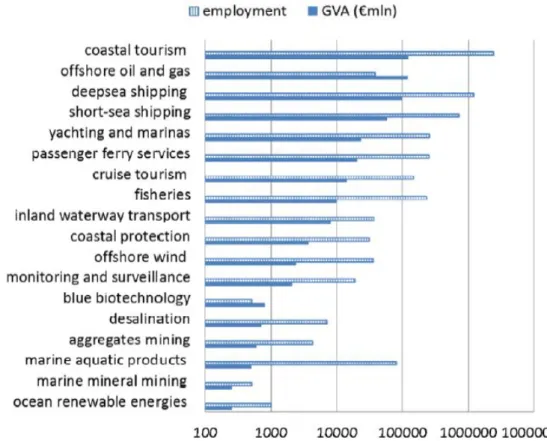
1.1 Employment and economic size of marine and maritime economic activities,
log-arithmic scale . . . 3
2.1 Consumption of Coal, Oil and Natural Gas . . . 7
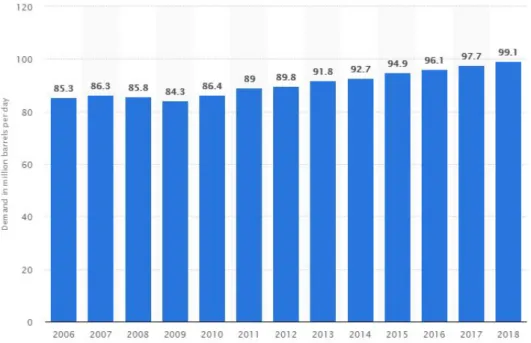
2.2 Daily demand for crude oil worldwide from 2006 to 2018 (in million barrels) . . . 8
2.3 Dry Tree and Wet Tree Systems . . . 10
2.4 Courtesy of Oceaneering - Stand-Alone . . . 10
2.5 Courtesy of Keppel Corp - BW Offshore’s Berge Helene FPSO . . . 12
2.6 Typical Subsea Production System With Wet Tree . . . 13
2.7 Schiehallion and Loyal Fields . . . 14
2.8 Schiehallion and Loyal Fields . . . 15
2.9 Schiehallion and Loyal Fields . . . 17
2.10 Schiehallion FPSO . . . 18
2.11 Glen Lyon FPSO . . . 20
2.12 Turret Mooring System of BW Pioneer FPSO . . . 22
2.13 Turret schematic . . . 22
2.14 Mooring plan . . . 23
2.15 Mooring stopper arrangement . . . 23
2.16 Principal mooring components . . . 24
2.17 Glen Lyon mooring line segments . . . 25
2.18 Stud Vs studless links . . . 26
2.19 Structure of a synthetic wire rope . . . 27
2.20 Spiral strand wire rope . . . 28
2.21 Suction pile . . . 29
2.22 WSW wave form parameters . . . 32
2.23 North Sea 100 year Hs criteria . . . 33
2.24 Spectral densities following the formulation of NPD, API, Harris-DNV and Ochi-Shin 35 2.25 Bathimetry of Schiehallion fields . . . 37
2.26 Current depth profile . . . 39
3.1 2D forces acting on mooring line element . . . 57
3.2 Moored vessel with one anchor line . . . 59
3.3 Multi-segmented catenary configuration . . . 63
3.4 Finite difference method example . . . 67
3.5 Mooring line Layout at turret . . . 68
3.6 Mooring arrangement . . . 70
3.7 Default representation of Orcaflex Line model . . . 72
3.8 Default representation of Orcaflex Line model . . . 73
3.9 General Static Orcaflex Flowchart . . . 74
3.10 General Dynamic Orcaflex Flowchart duration . . . 74
3.11 Developed model in Orcaflex for Glen Lyon FPSO . . . 75
3.12 Mesh convergence Vs Solved Time . . . 76
3.13 Effective tension in all mooring lines . . . 76
Optimization of FPSO Glen Lyon Mooring
3.15 Effective Tension - Bundle 2 . . . 77
3.16 Effective Tension - Bundle 3 . . . 78
3.17 Effective Tension - Bundle 4 . . . 78
3.18 Von Mises Stress in all mooring lines . . . 79
3.19 Von Mises stress - Bundle 1 . . . 79
3.20 Von Mises stress - Bundle 2 . . . 80
3.21 Von Mises stress - Bundle 3 . . . 80
3.22 Von Mises stress - Bundle 4 . . . 81
3.23 Surface Vs seabed - Effective tension (force) . . . 81
4.1 Mooring chain element cost per diameter . . . 84
4.2 Mooring spiral strand wire rope cost per meter . . . 85
4.3 Optimization methodology flowchart . . . 88
4.4 Genetic algorithm implementation diagram . . . 89
4.5 Minimum suspended catenary versus mooring line costs . . . 92
4.6 Mooring line offset - 2D view . . . 93
4.7 Mooring line offset - 3D view . . . 93
4.8 Effective tension in all mooring lines . . . 94
4.9 Effective Tension - Bundle 1 . . . 94
4.10 Effective Tension - Bundle 2 . . . 95
4.11 Effective Tension - Bundle 3 . . . 95
4.12 Effective Tension - Bundle 4 . . . 96
4.13 Von Mises Stress in all mooring lines . . . 96
4.14 Von Mises stress - Bundle 1 . . . 97
4.15 Von Mises stress - Bundle 2 . . . 97
4.16 Von Mises stress - Bundle 3 . . . 98
4.17 Von Mises stress - Bundle 4 . . . 98
4.18 Surface Vs seabed - Effective tension (force) . . . 99
5.1 Diagram of mooring design for certification . . . 102
5.2 Typical stress rupture curve . . . 103
5.3 Design of the full system in CATIA V5 . . . 106
5.4 Stud link element . . . 106
5.5 Stud less link element . . . 106
5.6 Main points for structural analysis . . . 107
5.7 View 1 of load reference system . . . 112
5.8 View 2 of load reference system . . . 112
5.9 View 3 of load reference system . . . 112
5.10 Tetra element of second order . . . 113
5.11 Quality index of the second order 3D elements . . . 114
5.12 Mesh convergence Vs solved time (FEM) . . . 115
5.13 Rigid element between chain links . . . 116
5.14 Detail of rigid element between chain links . . . 116
5.15 Detail of single point constraint . . . 116
5.16 Force applied in the model . . . 117
5.17 Detail of the force applied in the model . . . 117
5.19 157mm studless chain element link displacement . . . 118
5.20 157mm studless chain element link stress . . . 119
5.21 152mm studless chain element link displacement . . . 119
5.22 152mm studless chain element link stress . . . 120
5.23 137mm studless chain element link displacement . . . 120
5.24 137mm studless chain element link stress . . . 121
5.25 152mm stud link chain element link stress . . . 121
5.26 137mm stud link chain element link stress . . . 122
5.27 Central studless element link general load path . . . 122
5.28 Central stud link element link general load path . . . 123
5.29 Straight section of a studless link element load path . . . 123
5.30 Straight section of a stud link element load path . . . 124
5.31 Bend section of a studless link element load path . . . 124
5.32 Bend section of a stud link link element load path . . . 125
5.33 Crown section of a studless link element load path . . . 125
5.34 Crown section of a stud link link element load path . . . 126
5.35 Cycles to failure . . . 127
A.1 Schematic of Production Riser . . . 143
A.2 Forward hull plan . . . 146
A.3 Hull design of Glen Lyon . . . 147
List of Tables
2.1 Existing Production and Water Injection Wells associated with the development . 15
2.2 Specification of Schiehallion FPSO . . . 19
2.3 Specification of Glen Lyon FPSO . . . 20
2.4 Existing Production and Water Injection Wells . . . 20
2.5 Chain properties . . . 27
2.6 Wire properties . . . 28
2.7 100 year wind velocity . . . 35
2.8 Operation Draught . . . 36
2.9 Wind speed averaging time factors . . . 37
3.1 Recommended analysis method and conditions . . . 52
3.2 Mooring line data . . . 69
3.3 Riser I-tube coordinates . . . 69
3.4 Mooring lines coordinates . . . 71
3.5 Load Case . . . 71
3.6 Mesh Convergence . . . 75
4.1 Quotation price of chain elements . . . 84
4.2 Quotation price of spiral strand wire . . . 84
4.3 Chain properties and allowables . . . 86
4.4 Wire properties and allowables . . . 86
4.5 Optimized mooring line results . . . 91
4.6 Comparison between former and optimized mooring lines . . . 99
5.1 Material and properties . . . 113
5.2 FEM - Mesh Convergence . . . 114
5.3 Margins of safety - Studless Vs Stud link . . . 122
5.4 Fatigue life - Loads . . . 127
A.1 Riser configuration parameters . . . 144
A.2 Riser properties . . . 144
A.3 Hydrodynamic coefficients . . . 144
A.4 Mass of buoyancy section including riser . . . 144
A.5 Marine growth profile . . . 144
A.6 Weight and outer diameter of riser including marine growth . . . 144
List of Acronyms
ALS Accidental Load state
API American Petroleum Institute
ASME American Society of Mechanical Engineers ASV Autonomous surface vehicle
AUV Autonomous underwater vehicle BBLS Barrels
BOP Blow Out Preventer BTU British Thermal Units CAD Computer aided desing CAE Computer aided engineering CAM Computer aided manufacturing CAPEX Capital Expenditures
CFRP Carbon Fiber Reinforced Polymer
DNV-GL Det Norske Veritas (Norway) and Germanischer Lloyd (Germany) DP Dynamic Positioning
ISO International Organization for Standardization FEM Finite element method
FLS Fatigue limit states
FPSO Floating Production Storage Offloading FPU Floating Production Unit
MBL Minimum breaking load
mmboe Million Barrels of Oil Equivalent MSL Mean Sea Level
NPD Norwegian Petroleum Dictorate OPEX Operational Expenditures
rms Root Mean Square ROV Remote operated vehicle
SLS Serviceability limit states TLP Tension Leg Platforms ULS Ultimate Load state WEC Wave Energy Converters WSW West Soutwest
Nomenclature
a Area D Diameter m mass E Young’s modulus Hs Wave height Tp Wave periodH Horizontal component of cable tension ds Infinitesimal element of the cable
D (chapter 3) - Hydrodynamic mean normal force F Hydrodynamic mean tangential force
A (chapter 3) - Cross sectional area of cable line w Weight per unit length of the line of water
T Line tension
ls Minimum length of the chain
lmin Minimum length of the cable line
X (chapter 3) - Total horizontal distance x (chapter 3) - Suspended horizontal distance
ls Suspended catenary cable length
M Total displacement of the FPSO
Aii or Ajj Added Mass
Bjj Damping at natural frequency
kii Stiffness
I44 Moments of inertia of roll
I55 Moments of inertia of pitch
I66 Moments of inertia of yaw
ρ Density of water g Acceleration of gravity
Aw Waterplane area
GMT Transverse metacentre heights
GMM Logitudinal metacentre heights
Cl Horizontal stiffness
θl Angle of infinitesimal mooring line
FWj Steady wind force
FCj Current force
F(j2) Mean second order force ˆ
ξj(1) Most probable maximum value of the first order ˆ
ξj1/3(1) Most probable significant value of the first order ˆ
ξj(2) Most probable maximum value of the second order ˆ
ξj1/3(2) Most probable significant value of the second order
m0 Moment of Area
m2 Second moment of area of first order motion response spectrum
S(ω) Wave spectral density
β Heading angle
Optimization of FPSO Glen Lyon Mooring
ϕ Potential velocity
ζ Wave elevation U Wind Speed ET Effective tension
Chapter 1
Introduction
The present thesis considers the development of an optimized method of mooring lines for large oil and gas extraction marine vessels, moored to the seabed. This system is connected to an internal forward turret allowing the vessel to freely rotate. As in any oilfield development, it is necessary to understand the redevelopment of the wells, the harsh environmental conditions, depth and fundamental loads and the sequence of events. It is important to verify the mooring system both in macro (system analysis) and micro scale (detailed component analysis).
This chapter presents the main reason behind the choice of this topic, the motivation beneath it, the importance of understanding the complete sequence of requirements and assumptions from first development to its redevelopment, choices, steps and further analysis, as well as the contribution to the scientific community, engineer development centers and private offshore companies and suppliers. This chapter also presents the established objectives of the work. This doctoral project has given rise to 2 publications in international conferences throughout the course of the study. In the last section a general outline of this chapter is summarized for a better understanding.
1.1
Motivation
In the context of deep sea oil and gas exploration, floating marine structures have an impor-tant role in the development of an oilfield. For deep waters (the depth of deep water subsea field ranges between 200m and 1500m [1]) there are a lot of challenges in the hydrocarbons inspection, research, production and extraction.
Floating structures are frequently used by the oil and gas industry for drilling, well interventions, production and storage at sea. These structures are maintained on station by a variety of mooring line types and systems. Simple anchoring systems are being used for several centuries, however in the past decades the mooring systems have been updated mainly for the oil and gas industry due to the need of increasing profit in the commercialization of hydrocarbons by lowering CAPEX.
Nowadays, the available mooring systems play a major role in the development of any oilfield due to the challenges of harsh environmental operational conditions and effective costs. Each oilfield has to be designed individually without any possibility of using the same layout for different oilfields.
In order to be exploitable, the oilfield shall have reliable systems adapted for long term mooring with the possibility of being updated through innovative designs and cheaper materials as well as new methodologies in an iterative process during all service life. Usually the mooring systems are designed in the conceptual phase, remaining the same in both preliminary and detailed design
Optimization of FPSO Glen Lyon Mooring
and with few modifications until the decommissioning phase. In this context it is possible to update the existent oilfield through improved methodologies, new materials, new technology and in-situ testing acquired data during the exploitation phase.
Under this context, several questions arise through the mooring design, from the vessel posi-tioning, environmental conditions, materials selection, mooring layout, type of catenary used and segment lengths. Finally it is necessary to perform strength and fatigue analysis of the most probable elements to fail.
Therefore, it is important to improve the design process adopted in computational methods in order to replicate more accurately experimental results in a wider range of environmental conditions.
The scope of this work is to improve an existing mooring system for Glen Lyon FPSO at the same time as being a cost-effective alternative as well as reducing the environmental footprint left by the oil and gas industry.
1.2
Purpose and Contribution
According to European Commission, sea dependent economic activities (the so called blue econ-omy) are estimated to represent 5.4 millions jobs with a revenue value just under 500 billions euros per year. In Europe 37% of internal trades and 75% of external trades are seaborne [2]. It is known that both Sea and Coasts are the drivers of the blue growth. If ten years ago the ports and coastal communities were the centers of ideas and innovation, nowadays three new factors are becoming the new drivers. The new factors are the rapid technological progress (ROV’s, AUV’s, etc.) for offshore in deep waters, the global awareness of finite resources of the land and freshwater and finally the need to reduce the greenhouse gas emissions (either from new developments of offshore renewable energy and environmental protection).
Blue growth has opened new opportunities for new investments, improvements and maritime research. These opportunities are created due to significant growth potential, either economi-cally through job creation or as a steering wheel helping Europe out of economic crisis through new product development, clean energy or sustainable food. It represents a major role of 2020 strategy. In figure 1.1 both employment and economic size of marine and maritime economic activities can be verified. Blue economy has individual factors depending on each others using the sea sustainably [3].
After several requirements, the European Commission has decided that the new opportunities with job-creation potential from research and development to deliver sustainable technology improvements and innovation are divided in five major value chains, blue energy, aquaculture, marine coastal and cruise tourism, marine mineral resources and blue biotechnology.
In the context of this dissertation it is important to analyze with deeper understanding the value chain of marine mineral resources. The prices for energy and non-energy raw materials is having increments of about 15% for non direct energy entities, and variables values for raw energy
Figure 1.1: Employment and economic size of marine and maritime economic activities, logarithmic scale (image from ref. [2])
components (e.g. crude oil). These increments are a result of the new emerging economies and consumer demanding countries like China, Brazil or Europe as a whole. Besides crude oil, the exploitation and mining of minerals including cobalt, copper and zinc are expected to be 5% extracted from the seabed by 2020. This value is expected to rise again up to 10% by 2030. The mineral mining is expected to growth from 0 to €5 billion by 2020 to €10 billion by 2030.
Boron and lithium are expected to be economically feasible to be extracted from seawater. There are very promising deposits in metallic sulphides which emerge from hydrothermal ore deposits in volcanically active zones. Due to high pressures and high temperature in this re-gions, the impact of the disturbance of marine biodiversity should be protected since they are performed within areas under national jurisdiction (exclusive economic zones and continental shelf) and due to the fact that is easier to transport from sea to land.
Assuming that mineral extraction from seafloor does indeed take place, European marine com-panies and research centers with specialization in ships and underwater activities/products and services will play a major role in the development of the Blue Economy. Product suppliers and I&D research centers will have to be updated with latest technology, less expensive systems shall adopt less environmental aggressive practices in the development of those systems and components, such as mechanical parts (risers, mooring lines, jack up rigs, anchors, etc.) and technological products (ROV’s, AUV’s, gliders, ASV, etc.). Their experience, continuous com-petitiveness and dependance of financial means will allow the possibility of obtaining licenses in international waters since they are less likely to harm unique ecosystems. The experience of the oil and gas industry will be beneficial to the marine minerals extraction sector.
Neverthe-Optimization of FPSO Glen Lyon Mooring
less, the industry of oil and gas will likely continue their robust evolution and it will be required new robust analysis methods and components to fulfill blue growth requirements.
1.3
Research objectives
Schiehallion and Loyal fields are located 130km West Shetland and 35km from Faroe Islands (UK) at quadrants 204/205. Schiehallion field was discovered in 1993 and Loyal field was discovered in 1994. They have been in production since 1998 with a total production to date over 30 mmboe of oil and associated gas though the Schiehallion FPSO [4].
The fields are exploited through FPSOs and they have produced approximately 61 million cubic meters of oil crude and 4.6 billions of cubic meters of gas from 1998 to 2009[4]. Recent studies have confirmed that a significant oil potential still remain to be exploited from these reservoirs and new nearby discoveries have confirmed the need to be developed by subsea tie-backs to Schiehallion infrastructure and FPSO [4].
Schiehallion FPSO was designed for 25 years and new discoveries will require an operational FPSO available until 2045. Current Schiehallion FPSO has been deteriorated over the years which makes the vessel infeasible to fulfill future requirements. In this context a new FPSO was developed. The fields were redeveloped with some existent facilities being reused as part of the project known as ”QUAD 204”. In this context a new mooring system was developed. Since the short transition time from Schiehallion FPSO to QUAD 204 FPSO, same principles were applied. Although the environmental impact assessment has some major considerations [4] re-garding the environmental sensitivities of leaking products, the mooring system is always over designed placing tonnes of stainless steel underwater without regarding the best optimized de-sign. With a new optimized design it would be possible to minimize even more the environmen-tal impact of the mooring lines in the seabed benthic communities, fisheries, birds and marine mammals but also reducing the CAPEX for BP Exploration Operating Company Limited (BP). The main objective of this work is to develop a optimized mooring line system for the new FPSO Glen Lyon at Schiehallion Field. The process of this optimization must be continuous and efficient from environmental conditions to capital expenditures. In the end of this thesis an optimized mooring line system is presented and compared with the existent one.
Through the development of this optimization model, it will be possible to apply the same princi-ples to other focus areas described in the Blue Growth document from European Commission [2]. It will be possible to apply both in Blue Energy (in terms of offshore renewable energy technolo-gies such as wave power devices, ocean thermal energy conversion and offshore wind turbines), Aquaculture area, in terms of mooring the cages in the Atlantic Ocean and in Maritime, Coastal and Cruise Tourism for anchoring tourism vessels.
In the development of this thesis the standard methodology of product development cycle will be used, from conceptual design to detailed design. Each oilfield has a unique development, since environmental phenomena are unique in each earth location. Furthermore this work refers
the optimization of an anchoring system for deep water in the Schiehallion Field, or in other words, the whole development of the mooring system for a specific FPSO.
In an early phase it will be performed hydrodynamic analysis (interaction fluid-structure) in order to place the FPSO in the correct location, as well as to have the ability to weathervane in the turret due the collinear an non-collinear applied forces (environmental conditions). This analysis will provide the base line to vessel positioning and it will be compared with the mooring line described in the references in order to validate the model.
After this step, an optimization of the model will be performed in Matlab through an iteration process to demonstrate the best optimized mooring system for the Glen Lyon FPSO. With this information, several CAD models were designed in CATIA V5 with the critical locations and then a strength and fatigue analysis is performed. Margins of safety are taken and discussed.
The mooring sequence will be developed as well as the methodology of the optimization. With this thesis it will be possible to develop new fields of study in the context of blue growth strategy of mooring vessels since one of the objectives of European Commission is the sea transporta-tion. This thesis will allow the development of mooring systems for Portuguese companies not only for oil and gas fields, but also for new fields of activity, e.g., renewable offshore energy, aquaculture, marine and coastal tourism, offshore mining etc. In terms of research and devel-opment it will be possible to increase the funding opportunities in the universities and centers of engineering due to new fields of expertise.
This new strategy alongside with new developments, research innovation and new mooring sys-tem methodologies will allow small and medium size companies with deep water activities to place their products in the market. Entities like CEiiA, OceanScan, Abissal OS, Institute of Sys-tems and Robotics, etc. This strategy will allow also micro companies and state entities such as Forum Oceano, Observatório da Madeira, WaveEC, Compta, Sparos, Moínho de Ilhéus, Find-Fresh, Aquazor, Alga plus, Iberagar or OceanPrime the possibility to start Offshore Aquaculture in Portuguese Coasts as well as mining operations from the complex mooring system point of view.
1.4
Thesis Outline
The present document is organized in 6 chapters. The present one, provides the motivation, purpose and contribution, main research objectives and the thesis outline. In this chapter it was verified the need for research in the maritime field as well as existent investments. The European case was analyzed with special focus on the Portuguese case.
In the second chapter a brief explanation of the oil industry is performed as well as the detailed upstream process. After understanding the oil and gas development process, the layout of the northern sea oilfield is detailed. The Schiehallion field was analyzed according to the expansion process and according to recent discoveries in near oil wells. A comparison between former and new FPSO was performed as well.
Optimization of FPSO Glen Lyon Mooring
After understanding both extraction processes, components and the specific oilfield layout were verified as well as the environmental conditions of the oilfield. Predominant wind, waves and currents were analyzed as well as main direction of the external loads. Since the offshore industry is heavily actuated by European/world oil and gas standards, the main standards will be analyzed regarding the mooring systems. Chapter two also includes the latest state of the art of anchoring systems.
In the third chapter, mooring line conditions were presented, as well as the need for segmen-tation of the mooring equipment. Segmented mooring lines were analyzed and results are com-pared with the former mooring system. Orcaflex from Orcina Ltd will was used for quasi-static and dynamic analysis, both for frequency and time domain. FEM elements were analyzed, mesh convergence was performed and the global mooring layout was given.
After the comparison of the FPSO’s mooring system Glen Lyon in the Schiehallion field in chapter 4 an optimization was performed using Matlab (Genetic Algorithms). Results will be compared from first mooring system to the optimized mooring system. A cost effective analysis was per-formed as well to determine the benefits of the optimized system. At the end of this chapter the final mooring line was achieved and it was generated a cloud point plot for easy verification of the optimized mooring line.
On the firs part of the fifth chapter of this work, a detailed design of a mooring line was per-formed. The details will focus on the most critical points of the mooring lines. The detailed design was performed using CAD software CATIA V5 R24 for both studless and stud link elements. Good practices of design were applied for offshore structures and metal elements.
Still on the chapter five, the stress analysis of the chain elements was performed. Material properties, criteria, conditions, loads, etc., was discussed according to suppliers as well as operational conditions in the element links. FEM analysis will be performed in thee steps, pre-processing, solver and post-processing. In both pre-processing and post-processing Altair soft-ware (Hypermesh and Hyperview) was used. The solver will be MSC Nastran. A mesh convergence was performed relating processing time with accuracy. FEM process was also described and re-sults were compared with material allowable, both for Ftu (Tension ultimate) and Fty (tension yield). A fatigue analysis was performed and results were compared with DNV-GL standards. Chapter six presents the general discussion and conclusions of the work developed during the present dissertation. It summarizes the most important achievements of this study and presents future work suggestions. It presents also the issues encountered during the development of the optimization process.
Chapter 2
Literature Review
The present chapter gives a macro description of the literature review performed during this work for mooring lines and anchoring systems. Theoretical framework and context basis of oil and gas as a whole, from the understanding of onshore and offshore industry (from economical point of view and maritime investment), passing to main components and infrastructures to the physical location of the specific oilfield is presented. In the final part of this chapter a literature review of mooring lines is introduced with the latest and updated developments in the research of mooring lines.
A comparison between the former and new FPSO is performed, as well as the comprehension of the full mooring system, from main components and equipments to international norms in the underwater industry of mooring equipment.
2.1
The Oil and Gas Industry
Nowadays there is a major dependence on petroleum and natural gas. World energy consumption has increased since 1950s. Non renewable energy (fossil fuel) is the most used energy worldwide with an average value up to 80% [1] of world energy consumption. The evolution of energy consumption and projection for the next years is presented in figure 2.1.
Figure 2.1: Consumption of Coal, Oil and Natural Gas (image from ref. [1])
Optimization of FPSO Glen Lyon Mooring
barrels annually or 1130,8 barrels per second [5]. The daily demand for crude oil worldwide is presented in figure 2.2.
Figure 2.2: Daily demand for crude oil worldwide from 2006 to 2018 (in million barrels, image from ref. [5])
Since the world spins around that precious product hidden most of the times at several hundreds or thousands meters depth in a porous space of a special rock, the term oil and gas cover almost all concentrations of natural hydrocarbons wherever the physical state they are. In a former commercial way the liquid hydrocarbons are known as raw or crude oil, gas hydrocarbons are known as natural gas and the solid hydrocarbons products are known as asphaltenes and petroleum bitumen.
The industry of oil and gas industry is a millions industry, one of the biggest of all times it has the largest companies of the world, from oil refining to distribution of oil derivatives. In this context several small companies are dedicated to specific sectors of the industry, such as exploration and production (upstream), refining and distribution (downstream) and the critical sector of transportation crude oil, petroleum and liquified natural gas (midstream). This thesis will focus on the exploration and production (upstream sector) of oil and gas products.
2.2
The Offshore Oil & Gas
Between 1800 and 1900 onshore oil-wells were drilled through weight drops through a cable. This former technique worked for low depths in non full steady wells. With the need to ex-ploit hydrocarbons at higher depths, it became necessary to implement more effective drilling methods such as rotating drills and circulating mud systems, this system is known as rotating rigs.
en-gines. As more and more companies started to drill onshore hydrocarbons, the discovery of major wells started to decrease, exploitation of small wells increased, increasing costs. The next step was to drill in the sea. The process to explore and extract oil and gas through rotary rigs in open sea is known as offshore oil and gas production or just offshore production. Although the first onshore well was drilled in 1859 by Colonel Edwin Drake [6], the beginning of offshore oil and gas exploitation started in 1947 when Kerr-McGee completed the first ever successful offshore well in the Gulf of Mexico off Louisiana in 4.6 meters of water. The whole concept of subsea oilfield was applied in the beginning of the seventies, by placing both injec-tion and producinjec-tions wells and producinjec-tion equipment under water at seabed. After processing hydrocarbons in the subsea wellhead, the produced hydrocarbons would flow to a nearby on-shore processing facility by pipelines or vessels. This concept was the start of subsea offon-shore engineering [1].
Water depths less than 200 meters are defined as shallow-waters, greater than 200 meters but under 1500 meters are considered deep waters and above 1500 meters are known as ultra deep waters. In a shallow specific reservoir and one satellite well, the subsea costs are relatively flat with increasing depth. However, the cost increases with increasing water depth for more than one well.
Subsea costs as referred before, are the costs of the full project. Generally it includes capital expenditures (CAPEX) and operational expenditures (OPEX). Capital expenditures includes the total amount of costs necessary for the start of the project, as the required investment to put a project into operation from concept design, engineering construction to final installation. On the other hand the capital expenditures respects all the expenses during normal standard oper-ation of an infrastructure or facility including man labor, utilities, materials and other related expenses. There are several points of interest in OPEX, such as operational, testing, mainte-nance etc.
The subsea oilfield production system is characterized either as wet tree or dry tree oilfield. In dry systems, trees are on the platform or close to the platform, wet systems can be everywhere else in a field development whether in a satellite well, a cluster of wells, template wells or tie-back wells [1]. Dry and wet systems can be seen in figure 2.3. Since the Schiehallion field is a Stand-Alone surface facility connected to several clusters, this work will focus only on Stand-Alone developments.
Stand-Alone layouts of offshore development are used most of the times for big reservoirs since both CAPEX and OPEX are very high and the return of investment versus the risk is very difficult to justify. In recent years due to the increase of the price of crude oil, there has been some popularity in the development of oil and gas subsea Stand-alone layouts since they are eco-nomically feasible. The operators verified that the overall capital expenditures can decrease if the same facility is capable to serve a cluster of wells and underwater structures rather than continue to build a new structure for every new discovered well.
Stand-Alone facilities are normally capable of having more than one field connected providing the flexibility for future satellites, however it has the disadvantages of requiring an early start up. They are only feasible for larger projects due to higher costs. For deep sea applications,
Optimization of FPSO Glen Lyon Mooring
Figure 2.3: Dry Tree and Wet Tree Systems (image from ref. [1])
FPSOs are used as surface facilities rather than common Jack-Up rigs (figure 2.4).
Figure 2.4: Courtesy of Oceaneering - Stand-Alone
In a proper way, the upstream process of offshore exploitation of hydrocarbons is a cycle, starting on the injection of salt water or carbon dioxide from the topside facility into the injection well and then the streaming from the production well to the surface facility of hydrocarbon products. In this context it is important to understand the main components of the oil and gas extraction as well as detailing the top facility vessel main components.
2.3
Oil Field Main Components and facilities
In order to detail the main components of an oil field it is important to separate the topside structures or facilities, the seabed components and the connection structural elements between them. This section will focus on the mechanical parts.
2.3.1
Topside structures
There are several topside structures or facilities depending on the size and operation depth [6]. There are shallow water facility complexes, gravity based complexes, compliant towers and floating production units (such as FPSOs, tension leg platforms, semi-submersible platforms and spars). In this work it will be taken in consideration only FPSO type facilities (in this case a vessel).
Since a FPSO is a stand-alone structure it does not need external infrastructure such as pipelines or storage compartments to be connected to other fixed facilities. The production unit has the storage within the vessel reducing the need for complex systems. Both crude oil, gas and solid hydrocarbons are offloading to tankers at periodic intervals depending on the capacity of the FPSO. The vessel is a tanker hull type vessel or a barge and due to new discoveries of new oil fields in higher depths they dominate almost all developments above 100 meters depth, such as Glen Lyon FPSO with a operational depth of 395 meters.
Both risers and wellheads from the seabed are located on a central point or on a bow-mounted turret so that the ship can weathervane and rotate freely to the sum of all external forces: wind, waves and current. The vessel is moored to the ground through segmented mooring lines with sheathed spiral strand wire and chain connection elements connected to several anchors (known as static position mooring - POSMOR), or it can also be dynamically positioned using thrusters (dynamic positioning - DYNPOS).
The main processing facility is placed on deck, while both storage and offloading is performed through the hull to a shuttle tank. It can also be used for transportation of equipment such as pipelines or risers [6]. An FPSO can be seen in the figure 2.5.
2.3.2
Seabed Components
The underwater systems used for hydrocarbons production are defined as Subsea production systems. The main components for subsea production systems consist of two wells (a completed well for injection and other completed well for production), subsea wellhead, subsea production trees (normally Christmas tree), subsea drilling systems, umbilicals and riser systems, manifolds, jumpers, tie-in and flowline systems, and control systems. Figure 2.6 shows a typical subsea production system with wet tree. This systems dictate the operation procedure. The reservoir is analyzed, then facilities are installed and drilling components are used. After the discovery of oil and gas the extraction process begins.
The subsea wellheads and Christmas trees are the most important components in subsea pro-duction systems. The wellhead is basically an end cap component sealing and supporting the
Optimization of FPSO Glen Lyon Mooring
Figure 2.5: Courtesy of Keppel Corp - BW Offshore’s Berge Helene FPSO
well. It also supports the BOP stacking during drilling and after completion. On the other hand the Christmas tree is a stack of devices and valves installed on the subsea well (wellhead) and provides an interface between the well and the production facility. The Christmas tree allows a controllable production.
The drilling system is a very important system in oil and gas exploration. This process is charac-terized by many components from drilling the well to wells completion. The main components are both drilling risers and drilling bits. The process can be applied through drilling submersibles or drilling ships.
A completion riser is normally used for running the tubing hanger and tubing through the drilling riser and BOP into the well-bore. The completion riser can be used to run the Christmas tree and its exposed to harsh external loads such as drilling risers curvature or the upper and lower joints connection.
In order to simplify the subsea systems, subsea manifolds have been used in the oil and gas industry. Manifolds have the purpose of minimize the use of pipelines and risers and optimize the flow of production in the system. The manifold is an arrangement of valves, pipes and tubes designed to combine, control, distribute and monitorize the fluid flow. They are installed at the seabed to gather product or to inject water or gas into wells. There are several types of manifolds in operation from a simple pipeline end manifold (PLEM) to large structures such as an entire subsea process system. In other words a manifold is a structural component (frame) with piping, control module, valves, pigging loop, flow meters etc.
The subsea system used to join two underwater components is called a tie-in system. For flowlines, tie-in systems are used to connect a tree or several trees to a manifold, trees between them, or a pipeline end to a tree or to a manifold. Between structures, jumpers, umbilicals and risers are used to connect components. Jumpers are short connection elements used to transport production fluids from one subsea component to another, for example a tree and a
Figure 2.6: Typical Subsea Production System With Wet Tree (image from ref. [1])
manifold, or manifold and an export sled. Umbilicals are used to distribute energy while risers are components used to connect the underwater equipment with topside structures, they are pressurized and used to transport the hydrocarbon components. The connecting elements are described in the next section.
2.3.3
Connection between structural elements
The subsea control system receives and transmits the data between surface and seabed, it oper-ates the valves and chokes on Christmas trees, manifolds/temploper-ates and pipelines. The subsea control system helps to monitorize the status of production by indicating in-situ conditions such as temperature, pressure, sand detection, hydrates, wax and asphalthenes, etc.
As mentioned before, both umbilicals and risers are the connection elements between subsea and surface components. Subsea umbilicals are used in many underwater applications. They are a combination of many components, fiber optic cables, electric cables, steel tubes and thermoplastic hoses, or just two or three of these components for specific operations. The umbilicals have several functionalities such as water injection, well work-over control, subsea manifold control, chemical injection and electrical power supply. Subsea production risers con-sists on conduction production pipes connecting the surface to the wellheads at the sea bottom. Risers can be rigid, flexible or hybrid, hybrid risers are a combination of both the previous types. There are four types of production risers, steel catenary risers (SCRs), top tensioned risers (TTRs), flexible risers and hybrid risers. In this work only flexible risers were considered.
Optimization of FPSO Glen Lyon Mooring
2.4
The Schiehallion Oil Field
The Schiehallion oil field was discovered in 1993 by the semi-submersible drilling rig Ocean Alliance. Both loyal and Schiehallion fields are located in quadrants 204 and 205 of the UKTS, 130 km West of Shetland and 35 km East of Faroe-UK boundary in medium water depth 350-500 meters [7]. The oil reserves are estimated to be approximately between 450 and 600 million barrels. Although the discovery in 1993 the production only have started on 29 July 1998. By operation in the Schiehallion field, the use of sharing helicopters and supply vessels is feasible due to nearest distance to the Foinavel and Loyal fields which lie within 15 km. The production life was estimated to be only of 17 years with a daily output (max) of 142 000 barrels a day. The field relies on subsea wellhead technology due to water depth. The system for oil flowing from pipelines to the FPSO is performed through the use of production risers [8].
Schiehallion and Loyal fields location can be observed in figure 2.7.
Figure 2.7: Schiehallion and Loyal Fields´satellite view (image from ref. [7])
The fields have been exploited through the use of the Schiehallion FPSO vessel via a multi-centre subsea infrastructure, and they have produced approximately 61 million standard cubic meters of oil (384 million barrels) and 4.6 billion standard cubic meters of gas (163 billion standard cubic feet) from 1998 to 2009. The oilfield comprises five drill centers with 53 active wells, 52 trees, 25 production wells and 28 water injection wells in a very extensive underwater infrastructure (Central, North, West, North West and Loyal) [4].
Both gas and water injection lines are connected to the Schiehallion FPSO through several risers, 10 production, 3 water injection, 1 gas import/export riser and 1 gas lift riser. As referred in the previous chapter both flowlines and risers have a number of subsea structures, including, jumpers, manifolds flowlines, among others. Table 2.1 shows the type of wells in the Schiehal-lion field.
All solid and liquid hydrocarbons are exported from the FPSO via Shuttle tankers. The gas export pipeline to Sullom Voe Oil Terminal in the Shetland Islands is connected to the FPSO [7], any
Table 2.1: Existing Production and Water Injection Wells associated with the development (image from ref. [9])
Drill Centre Number of active wells Number of active water injection wells
Central 16 9
West 6 9
North West 1 2
North 0 3
Loyal 4 4
excess gas remaining in the production is exported to Magnus on the East of Shetland via Sullom Voe [10].
The oilfield is operating since 1998, however recent discoveries, production history and expe-rience from previous existing wells have confirmed that is still a very significant oil potential reserves in the fields ready to be exploited from these reservoirs. Other nearby oil reserves and gas discoveries have been pointed to have feasible potential to be developed in a nearby future by underwater tiebacks to Schiehallion and Loyal Infrastructures. In order to exploit the remaining reserves it would be necessary to keep the Schiehallion FPSO on-station for a further period then the projected design life of 25 years. The new FPSO shall withstand more 25 years operation in-situ. The subsea layout can be observed in figure 2.8.
Figure 2.8: Schiehallion and Loyal Fields detailed view (image from ref. [7])
There has been a deterioration of the production operation efficiency due to the operational challenges in recent years. The existing FPSO in unable to fulfill the needs for processing re-quirements of the anticipated economic field life. The whole system and existing fields are being redesigned and redeveloped as ”Project QUAD 204”. With the additional wells and ex-pansion of the subsea fields and infrastructure, the facilities will be re-used wherever possible. Hence, some will be disconnected, isolated and suspended for the moment, but they will be kept for future operational considerations due to its potential [4] [9].
Optimization of FPSO Glen Lyon Mooring
The Schiehallion field development is performed throwout a consortium of several partners. The partners are BP, Shell, Amerada Hess, Statoil, Murphy and OMV. BP is the final operator respon-sible for the upstream process. The development of the oil field in expenditures is estimated to be around £1000million.
Both for the installation process of the vessel and in accordance with Petroleum Act 1998, BP is the operator for both former and new FPSO. Britoil limited is the operator of the fields alongside with the department of Energy and Climate Change.
In partnership with public stakeholders and regulatory consultation, the decommissioning pro-grammes are submitted according with international and national regulations and DECC guide-lines. The decommissioning project plan has a schedule outlined of three years. It was started in 2013 [7]. The layout of the Schiehallion Oil field is presented in figure 2.9.
2.5
Schiehallion FPSO VS Glen Lyon FPSO
For the development of the new oil field, it was imperatively necessary to replace the former FPSO for a new FPSO ready for production, yet, more robust and with more capacity than the previous one, capable to withstand the environmental conditions in the same location until 2035 at least. Within this context it is important to understand the main differences between them.
2.5.1
Schiehallion FPSO
Schiehallion FPSO was a new type of platform for oil and gas operated by BP. The FPSO was designed to withstand extreme sea conditions in the Schiehallion field, either waves, currents or wind loads. She was built and delivered to BP in 1996 by Harland and Wolff of Belfast, being the largest FPSO at that time. The hydrocarbon extracted arrives at the turret in the bow region of the vessel from underwater components or through on-vessel facilities via 15 dynamic risers. The vessel has approximately 246 meters length, a breadth of 45 meters, a depth of 27 meters and an internal turret with 14 meters of diameter (size of the cylinder) [8]. The cylinder is installed in the bow region at the upper deck level supported by the turret collar. As mentioned before the vessel has a design life of 25 years and a theoretical fatigue life of 50 years for environmental loads [4]. All load cases will be discussed later on the next chapter. Several load cases will be defined according to standards and industry norms.
The full crude oil storage capacity has a combined amount of 950 000 barrels and the storage tanks are in the middle body region of the vessel. The vessel has ability to take on board daily 154 000 barrels of crude oil [4]. The on board processing facilities have 3 steps for the processes. The first one is for the recovery of reservoir products, the second is for cleaning and re-injection of water and gas into the wells and the third is the chemical treatments of the facilities. The export of oil from the FPSO is performed via shuttle tanker Loch Rannoch (Constructed at Daewoo’s shipyard in South Korea, operated by BP) [8]. The offloading process of
Optimization of FPSO Glen Lyon Mooring
Figure 2.10: Schiehallion FPSO (image from ref. [12])
oil crude from the FPSO takes place every 3 to 6 days. Loch Rannoch has DP (Dynamic Positioning) compatible with the Schiehallion oil field allowing an accurate positioning from the tanker to the FPSO helping to prevent the overall through-put oil supply from decreasing in production. As referred before both flexible risers carrying the oil and gas, the anchor lines and control umbilicals all reach the surface inside the turret. The Schiehallion FPSO has a accommodation on board for 123 personnel [11]. The Schiehallion FPSO can be seen in figure 2.10.
The mooring system from the seabed is connected to the turret and then connected to the vessel via the turret collar, the station keeping system has a weathervane turret allowing the turret free rotation movement. Table 2.2 shows the specifications of the Schiehallion FPSO [8]. This table is used for comparison between Schiehallion and Glen Lyon FPSO. In the next chapter all external forces will be discussed and analyzed.
2.5.2
Glen Lyon FPSO
The re-development of the Schiehallion oil field had 3 possible main approaches:
• Possibility of continuing with the existing FPSO with minimal modifications undertaken offshore;
• Bringing the existing FPSO ashore to be refurbished;
• Replacement of the existing FPSO with more storage capacity with new built facilities.
The winning concept was a new turret-moored FPSO since there was a need for a continuous oil production in-situ as well as the continuation of the exported hydrocarbon gases via the existing West of Shetland Pipeline system (WOSP). Both fluids and conditions at the Schiehallion and Loyal fields (the oils are not at high temperature or pressure) are favorable due to the quality of the crude oil (classed as medium crudes containing low proportion of volatile components). The new FPSO would need to have increased storage and production capacity in order to achieve the optimum reservoir recovery and extending the service field life allowing any future
expan-Table 2.2: Specification of Schiehallion FPSO (image from ref. [8])
Length 246.00 m
Breadth 45.00 m
Depth 27.00 m
Draught (full load condition) 19.70 m
Displacement 194785 t
LCG From AP 108.36 m
VCG from BL 15.83 m
GMT 3.13 m
Natural Surge Period 125.54 sec
Natural Sway Period 169.28 sec
Natural Heave Period 11.65 sec
Natural Roll Period 15.53 sec
Natural Pitch Period 10.46 sec
Natural Yaw Period 92.37 sec
Storage capacity 950000 t
Peak 154000 barrels of oil/day
Design Life 25 years
Operating depth 395.00 m
Turret 14 m diameter with 360 rotation
Mooring 14 anchor chain legs in groups
Type 6.25 inch studless chain and wire rope
sion. All the possible future expansions could potentially be developed by subsea tie-back to the new infrastructure as referred before.
Glen Lyon is larger than the existing Schiehallion FPSO and it was designed for 25 years. Glen Lyon FPSO has 270 meters in length, 52 meters in breadth with an operational draught of 14 to 20 meters depth[11]. The new FPSO has also more accommodation on board, 125 personnel although it is capable to accommodate during periods of high activity a total of 168 personnel (hook-up, commissioning and turnarounds).
One important parameter of the Glen Lyon FPSO is the double hull, sided, double-bottomed construction designed to better withstand fatigue and corrosion resistant suitable for harsh environmental operations.
Like the former FPSO, Glen Lyon is permanently moored in its operational location by the turret mooring system. It allows the vessel to weathervane around the cylinder in the turret system. Schiehallion FPSO had 14 mooring line system while the new FPSO requires 20 mooring lines arranged in four bundles connected to 20 suction pile anchors. The radius performed by the new mooring lines is greater than the previous ones. The installation of the new FPSO involved a re-attachment of the existing risers, umbilicals and flowlines.
Besides the size, Glen Lyon is able to process and export up to 130 000 barrels a day and store up to 800 000 barrels [13]. The Glen Lyon FPSO can be seen in figure 2.11.
Table 2.3 shows the specifications of the Glen Lyon FPSO [11] [15]. The comparison between the two FPSO can be observed in Table 2.4
Optimization of FPSO Glen Lyon Mooring
Figure 2.11: Glen Lyon FPSO [14]
Table 2.3: Specification of Glen Lyon FPSO (image from ref. [16])
Length 270.00 m
Breadth 52.00 m
Depth 30.00 m
Draught (full load condition) 20.00 m
Displacement 244342 t
LCG From AP 126.66 m
VCG 18.55 m
GMT 3.39 m
Roll radius of gyration 17.33 m
Pitch radius of gyration 70.77 m
Yaw radius of gyration 70.77 m
Natural Roll Period 22.85 sec
Natural Pitch Period N/A
Natural Yaw Period N/A
Storage capacity 1080000 t
Peak 320000 barrels of oil/day
Design Life 25 years
Operating depth 395 m
Turret 24 m diameter with 360 rotation
Mooring 20 anchor chain legs in 4 groups
Type 6.25 inch studless chain and wire rope
Table 2.4: Existing Production and Water Injection Wells (image from ref. [10])
Design capacity Schiehallion FPSO Glen Lyon FPSO
Oil fluids cubic meters/day 50200 50900
Oil production cubic meters/day 35000 20700
Gas production standard cubit meters 3964300 6230000
2.6
Mooring Systems
There has been a consistent demand for offshore resources and hydrocarbon products. Unlike trading ships, FPSO’s stay at pre-defined position, year after year without regular dry docking need for maintenance operations.
The powerful floating structures used for petroleum activities are maintained on station for a very long time by a variety of mooring line types and systems. For centuries, there has been the system of a single anchor mooring system from the bow [17]. However, with increasing depth, specific requirements and products associated with station keeping have increased. For floating structures used for offshore oil and gas operations, it has resulted in new and more developed materials and technology for different combination of mooring lines. A good example is the steel wire rope for deep water application like the ones used nowadays in TLP in order to improve horizontal and vertical plane responses.
Through the past years, the engineering operators of mooring design has been known by the experience developed of ship building and offshore structures [18]. The main objective of the mooring system in any vessel is to allow the relative movement of the ship according to external loads in-site ensuring that the ship remains very close to the point it was originally designed for, since both structural and functional inadequacy affects also the efficiency of energy conversion used in station keeping and offshore operations[19].
The mooring systems can be passive (if the movements have limited effect on the device ef-ficiency and the purpose is just station keeping), active (if the system stiffness is the most important factor in the dynamic response of the device) and reactive (if the mooring provides a reaction force).
Mooring systems can also be classified based on the layout configuration: spread, turret, single point and dynamic mooring.
• The spread mooring systems consists on multiple mooring lines attached to the floating body. The movements are limited to horizontal excursion and they do not rotate about its hull. It comprises the catenary, multi-segmented lines and taut lines. These systems are very expensive;
• Catenary turret moored (internal or external) consists on several mooring lines connecting a floating vessel or structure allowing weathervaning around the turret;
• Single Anchor Leg Mooring (SALM) is a floating structure connected to a single or multiple buoy and it is able to weathervane around the buoy;
• Articulated Loading Column (ALC) on the other hand is a floating structure able to weath-ervane around a bottom hinged column;
• Fixed Tower Mooring is also a floating structure that can weathervane around the mooring point (composed by a anchored tower into the seabed).
In the context of this work only passive mooring system is considered with a catenary turret mooring system as it can be seen in figure 2.12.
Optimization of FPSO Glen Lyon Mooring
Figure 2.12: Turret Mooring System of BW Pioneer FPSO (image from ref. [20])
The mooring system consists of all the components required for anchoring the vessel from the turret to the seabed. The main components are the turret (as mentioned before), mooring lines (chains, shackles, steel wire rope, etc.), buoys (when applicable) and anchors. For Glen Lyon FPSO all anchors are suction pile type buried deep into the seabed.
The Glen Lyon FPSO is moored by a catenary wire and chain mooring line attached to a geo-stationary internal turret. The turret can be seen in figure 2.13.
Figure 2.13: Turret schematic (image from ref. [21])
The turret was placed at the Schiehallion field and is passively weathervaned with no thruster assistance. The anchor piles are located at a greater radius than the existing piles. The mooring was designed for a 100 year intact system with one line failed condition to avoid uplift at the anchor piles. The mooring system was designed for 25 years, however the target design life for
mooring components was designed for 250 years. The mooring system was designed to have 20 to 24 mooring lines in 4 identical bundles arranged at 90°. The mooring system is symmetrical with four bundles with twenty to twenty-four lines in total mooring lines. The mooring plan can be seen in figure 2.14.
Figure 2.14: Mooring plan (image from ref. [16])
Besides the 24 meters of turret nominal diameter, the chain stoppers were re-arranged in two radii. Three lines from each bundle were placed on an outer diameter of 20 meters and an elevation of 0.5 meters above the hull baseline, while two lines placed on a outer diameter of 13 meters with an elevation of 1 meter below the hull baseline both coincident with the center of the turret. A scheme of the mooring lines location in the turret can be seen in figure 2.15.
Figure 2.15: Mooring stopper arrangement (image from ref. [16])
On the other side, the turret has also the risers used for oil and gas operations (injection and production). The system has 20 risers in 4 identical bundles arranged at 90 °between them
![Figure 2.3: Dry Tree and Wet Tree Systems (image from ref. [1])](https://thumb-eu.123doks.com/thumbv2/123dok_br/18859682.930261/32.892.118.735.105.425/figure-dry-tree-wet-tree-systems-image-ref.webp)

![Figure 2.6: Typical Subsea Production System With Wet Tree (image from ref. [1])](https://thumb-eu.123doks.com/thumbv2/123dok_br/18859682.930261/35.892.230.708.105.443/figure-typical-subsea-production-wet-tree-image-ref.webp)
![Figure 2.8: Schiehallion and Loyal Fields detailed view (image from ref. [7])](https://thumb-eu.123doks.com/thumbv2/123dok_br/18859682.930261/37.892.295.642.576.912/figure-schiehallion-loyal-fields-detailed-view-image-ref.webp)
![Figure 2.9: Schiehallion and Loyal layout (image from ref. [9])](https://thumb-eu.123doks.com/thumbv2/123dok_br/18859682.930261/39.892.197.740.193.1031/figure-schiehallion-loyal-layout-image-ref.webp)
![Figure 2.10: Schiehallion FPSO (image from ref. [12])](https://thumb-eu.123doks.com/thumbv2/123dok_br/18859682.930261/40.892.139.713.105.404/figure-schiehallion-fpso-image-from-ref.webp)
![Figure 2.12: Turret Mooring System of BW Pioneer FPSO (image from ref. [20])](https://thumb-eu.123doks.com/thumbv2/123dok_br/18859682.930261/44.892.125.729.107.445/figure-turret-mooring-bw-pioneer-fpso-image-ref.webp)
![Figure 2.15: Mooring stopper arrangement (image from ref. [16])](https://thumb-eu.123doks.com/thumbv2/123dok_br/18859682.930261/45.892.245.694.745.1040/figure-mooring-stopper-arrangement-image-ref.webp)
