Advanced Oxidation/Reduction Processes
for As(III) and Cr(VI) Oxyanions
Removal from Water
Thesis submitted in partial fulfillment of the requirements for the degree of Doctor of Philosophy in Environmental Engineering
at the Faculty of Engineering, University of Porto
Belisa Alcantara Marinho
Supervisor: Vítor Jorge Pais Vilar, PhD. Co-Supervisors: José Carlos Brito Lopes, PhD.
Rui Alfredo da Rocha Boaventura, PhD.
Laboratory of Separation and Reaction Engineering – Laboratory of Catalysis and Materials (LSRE-LCM)
Department of Chemical Engineering Faculty of Engineering
This work was financially supported by: Project POCI-01-0145-FEDER-006984 – Associate Laboratory LSRE-LCM funded by FEDER through COMPETE2020 – Programa Operacional Competitividade e Internacionalização (POCI) and by CAPES Foundation, Ministry of Education of Brazil through scholarship (BEX-983/2013-06).
FEUP - LSRE - LCM - Universidade do Porto © Belisa Alcantara Marinho, 2013-2017 All rights reserved
Acknowledgments
I would like to sincerely acknowledge my supervisor Dr. Vítor Vilar, for the opportunity to perform this thesis under his guidance, for providing me all the necessary resources and support to carry out this work, as well as his enriching presence in the discussion and resolution of the difficulties encountered. I am also thankful to my co-supervisors: Dr. Carlos Lopes, for sharing the knowledge about the NETmix reactor and for all support; and Dr. Rui Boaventura, for all support and for giving useful comments and suggestions to improve this manuscript. Without your assistance and valuable knowledge would not have been possible to conclude this work.
I am also very grateful to Dr. Raquel Cristóvão for all the guidance, help and encouragement and to Dr. Ridha Djellabi for all help during the time that we worked together.
Thanks Dr. Madalena Dias for letting me to attend your classes during my first year and for all contribution in the work with the NETmix reactor.
Special thanks to those who somehow helped me, contributing for the accomplishment of my work: Bianca Chaves, Petrick Soares, André Fonseca, André Monteiro, Francisca Moreira and Caio Rodrigues.
An extended greeting goes to all colleagues from LSRE for the partnership and good work environment. Thanks to those who shared good moments with me in many refreshing coffees, lunches, conferences, lab routines and also in moments outside FEUP: Lucila Doumic, Bianca Molinari, André Nogueira, Adriana Arcy, Laís Lopes, Jonathan Espíndola, Inalmar Segundo and Batuira Filho.
Particular thanks to all friends that I met here in Porto and those who helped me to not feel alone during this time far from home: Maria Alice Cechinel, Raissa Atzingen, Bárbara Araújo, David Guimarães, Paulo Mazur, Gabriela Lacet, Evelyn Soares, Carolina Ferreira, Carolina Santos, Nayala Gazola, Joana Brás
and Marta Brás. Special thanks to Luciana Mazur for being during all time in these four years both helpful colleague and friend for all seasons.
I would like to express my genuine acknowledgment to the persons that I left in Brazil: my family, especially my parents, Edlaine and Luiz, and sister Beatriz, and also my friends. Thank you for all unconditional support, love and patience. Finally, I am thankful to God for giving me strength and perseverance to get here and for putting all these magnificent people in my way.
“Só se nos detivermos a pensar nas pequenas coisas chegaremos a compreender as grandes.”
Abstract
Water pollution by human activities is a global environmental problem that requires innovative solutions. In the last years, the advanced oxidation processes (AOPs) have been acquiring high relevance for the treatment of water contaminated with organic compounds. However, these processes are also able to treat inorganic compounds, mainly by changing the metal/metalloid oxidation state, turning these compounds less toxic or soluble.
The current thesis focuses on the assessment of some AOPs for Cr(VI) reduction and As(III) oxidation. Two AOPs were tested for the treatment of each contaminant: (i) Fe(III)/UV system in the presence of organic sacrificial agents and heterogeneous photocatalysis also in presence of sacrificial agents for the Cr(VI) reduction; (ii) UVC-H2O2 and heterogeneous photocatalysis for the As(III) oxidation.
The photocatalytic reduction of Cr(VI) by Fe(III)/UV in the presence of organic sacrificial agents was conducted in a lab-scale tubular photoreactor with compound parabolic collectors under simulated solar radiation. The effect of parameters such as iron and citric acid concentrations, pH, temperature, UV irradiation source and initial Cr(VI) concentration on the process efficiency were analyzed, and also the addition of other organic ligands like oxalic acid, maleic acid and EDTA. However, the presence of citric acid proved to enhance the Cr(VI) reduction by Fe(III)/UV due to the formation of Fe(III)-Citrate complexes, providing a quicker pathway for ferric iron regeneration in the presence of UV-Visible light. At optimized conditions (Cr(VI):Citric acid molar ratio 1:3; 0.16 mM of Fe(III), at pH 5.0), the photocatalytic reduction of 0.7 mM of Cr(VI) present in a real galvanic effluent was completed achieved (below the detection limit (DL) of the analytical method) after 30 min.
The reduction of Cr(VI) by heterogeneous photocatalysis, in the presence of organic sacrificial agents was conducted in: (i) a lab-scale tubular photoreactor with compound parabolic collectors, packed with cellulose acetate monolithic (CAM) structures coated with TiO2-P25 thin films by dip coating method and under simulated solar radiation; (ii) a lab-scale micro-meso-structured (NETmix) photoreactor with cellulose acetate (CA) sheet coated with TiO2-P25 by spray system and under simulated solar radiation; (iii) a NETmix photoreactor with photocatalyst thin film deposited on the front glass slab (GS) or on the network of channels and chambers imprinted in the back stainless steel slab (SSS) by spray system and under simulated solar radiation or UVA-LEDs illumination. In the first heterogeneous photocatalytic system, the effect of TiO2 layers number on the Cr(VI) photoreduction was analyzed. At the optimal amount, the support geometry allowed a high surface-area-to-volume ratio, offering an illuminated catalyst surface area per unit of volume inside the reactor of 212 m2 m-3. Following, operating conditions such as pH value, citric acid concentration, irradiation source and initial Cr(VI) concentration were analyzed. Several organic species were also tested as hole scavengers. Results indicate reduction rates of 0.09 mmolCr(VI) m-3illuminated volume s-1 and a photonic efficiency of 1.9% during the reduction of 0.02 mM of Cr(VI) with 6 P25layers and 6.9 mM of citric acid at pH 2.5 and 25 ºC. Furthermore, the catalytic bed was reused for 10 consecutive cycles with almost no efficiency decrease after the second cycle, achieving near 100% Cr(VI) removal after 90 min.
The second photocatalytic system comprises a micro-meso-structured reactor with a back acrylic slab where chambers and channels are imprinted and a frontal borosilicate slab with especially high UV transparency. The reactor geometry provides an efficient exposure of TiO2-P25 CA sheets to radiation, with an illuminated surface per unit of volume inside the reactor of 333 m2 m-3. Different organic species were tested as hole scavengers, being the tartaric acid the most
efficient. The effect of the degree of mixing inside the photoreactor, according to the Reynolds number, on the Cr(VI) photocatalytic reduction was then evaluated. Following, operating conditions such as TiO2 mass, tartaric acid concentration, pH value, temperature and initial Cr(VI) concentration were analyzed. Results indicate high reduction rates (1 mmolCr(VI) m-3illuminated volume s-1) and a photonic efficiency of 3.96% for Re = 830, 30 mg TiO2 and 1.8 mM of tartaric acid, at pH 3.0 and 25 ºC. The CA sheets coated with thin films of TiO2-P25 showed to be suitable for continuous Cr(VI) reduction, without losing efficiency during 3 consecutive photocatalytic cycles.
In the third photocatalytic system using the same amount of catalyst, the reduction of Cr(VI) was evaluated using different catalysts (Fe2O3, ZnO, WO3, CdS, TiO2 -PC500, TiO2-PC105, TiO2-P25) irradiated by simulated solar light. Using TiO2 -P25, the reaction rate was evaluated for two illumination sources, solar light or UVA-LEDs. In order to evaluate the effects of back side (BSI) and front side (FSI) illumination mechanisms, NETmix with the front glass slab or/and back stainless steel slab coated with TiO2-P25, respectively, was irradiated by UVA-LEDs. At optimized conditions, the reduction rates were 1.16 and 3.61 mmolCr(VI) m-3illuminated volume s-1, for the BSI and FSI mechanisms, respectively. The reusability of the photocatalytic films on the NETmix was also evaluated for three consecutive cycles using fresh Cr(VI) solutions.
Finally, the photocatalytic oxidation of As(III) species over UVC/H2O2 and heterogeneous TiO2/Fe2O3 photocatalysis was performed in the NETmix photoreactor under UVA or UVC-LEDs illumination. In the UVC-LEDs/H2O2 system, the influence of hydrogen peroxide concentration was verified, however as the UVC-LEDs photon flux was too low, the As(III) oxidation was not efficient. Nevertheless, in the heterogeneous photocatalytic systems, the As(III) oxidation was assessed and the effect of various parameters such as the catalyst load, the H2O2 addition and the illumination mechanism (BSI or FSI) were
evaluated. At the optimized conditions with TiO2 thin films in presence of H2O2, the oxidation rates were 0.44 and 1.22 mmolAs(III) m-3illuminated volume s-1, for the BSI and FSI mechanisms, respectively. Also, the catalyst reuse was performed in the best operational conditions, showing no efficiency loss during 3 consecutive photocatalytic cycles.
Resumo
A poluição da água pelas atividades humanas é um grande problema ambiental global que requer soluções inovadoras. Nos últimos anos, os processos de oxidação avançados (POAs) têm adquirido relevância para o tratamento de águas contaminadas com compostos orgânicos. No entanto, esses processos também são capazes de tratar compostos inorgânicos, principalmente através da mudança no estado de oxidação do metal/metalóide, tornando estes compostos menos tóxicos ou solúveis.
A presente tese centra-se na avaliação de alguns POAs para promover a redução de Cr(VI) e a oxidação de As(III). Foram testados dois tipos de POAs para o tratamento de cada contaminante: (i) sistema Fe(III)/UV na presença de agentes sacrificantes orgânicos e fotocatálise heterogênea também na presença de agentes sacrificantes para a redução de Cr(VI); (ii) UVC-H2O2 e fotocatálise heterogênea para a oxidação de As(III).
A redução fotocatalítica de Cr(VI) via Fe(III)/UV na presença de agentes sacrificantes orgânicos foi realizada em um fotorreator tubular de escala laboratorial com coletores parabólicos compostos sob radiação solar simulada. Foram analisados o efeito de parâmetros como as concentrações de ferro e ácido cítrico, pH, temperatura, fonte de irradiação UV e concentração inicial de Cr(VI) na eficiência do processo e também a adição de outros ligantes orgânicos como ácido oxálico, ácido maleico e EDTA. No entanto, a presença de ácido cítrico provou ser a melhor condição para a redução de Cr(VI) por Fe(III)/UV devido à formação de complexos de Fe(III)-Citrato, proporcionando uma via mais rápida para a regeneração do iões férricos na presença de luz UV-visível. Em condições otimizadas (proporção molar de Cr(VI):Ácido cítrico de 1:3, 0.16 mM de Fe(III), a pH 5.0), a redução fotocatalítica de 0.7 mM de Cr(VI) presente em um efluente
real de galvanoplastia foi completamente atingida (abaixo do limite de deteção (DL) do método analítico) após 30 min.
A redução de Cr(VI) por fotocatálise heterogênea, na presença de agentes sacrificantes orgânicos, foi realizada em: (i) um fotorreator tubular de escala de laboratorial com coletores parabólicos compostos, empacotado com estruturas monolíticas de acetato de celulose (MAC) revestidas com filmes finos de TiO2 -P25 por método de revestimento por imersão e sob radiação solar simulada; (ii) um fotorreator micro-meso-estruturado (NETmix) de escala laboratorial onde foram inseridas folhas de acetato de celulose (AC) revestidas com TiO2-P25 por sistema de pulverização e sob radiação solar simulada; (iii) fotorreator NETmix com filme fino de fotocatalisador depositado na placa de vidro superior ou na rede de canais e câmaras impressas na placa de aço inoxidável inferior por sistema de pulverização e sob radiação solar simulada ou iluminação LEDs-UVA.
No primeiro sistema de fotocatálise heterogênea, o efeito do número de camadas de TiO2 na fotoredução Cr(VI) foi analisada e, na quantidade ideal, a geometria do suporte permitiu uma alta relação superfície-volume, oferecendo uma área de superficial de catalisador iluminada por por unidade de volume dentro do reator de 212 m2 m-3. Em seguida, foram analisadas as condições operacionais, tais como valor de pH, concentração de ácido cítrico, fonte de irradiação e concentração inicial de Cr(VI). Várias espécies orgânicas também foram testadas como agentes sacrificantes para reagir com as lacunas. Os resultados indicam taxas de redução de 0.09 mmolCr(VI) m-3illuminated volume s-1 e uma eficiência fotônica de 1.9% durante a redução de 0.02 mM de Cr(VI) com 6 camadas de P25 e 6.9 mM de ácido cítrico a pH 2.5 e 25 ºC. Além disso, as estruturas MAC foram reutilizadas durante 10 ciclos consecutivos com quase nenhuma diminuição de eficiência após o segundo ciclo, atingindo remoções próximas a 100% (Cr) após 90 min.
O segundo sistema fotocatalítico compreende um reator micro-meso-estruturado com uma placa de acrílico inferior onde são impressos câmaras e canais e uma placa superior de vidro borossilicato com uma elevada transparência a radiação UV. A geometria do reator proporciona uma eficiente exposição das folhas de AC com filmes de TiO2-P25 à radiação, com uma superfície iluminada por unidade de volume dentro do reator de 333 m2 m-3. Diferentes espécies orgânicas foram testadas como agentes sacrificantes para reagir com as lacunas, sendo o ácido tartárico o mais eficiente. O efeito do grau de mistura dentro do fotorreator, de acordo com o número de Reynolds, foi avaliado na redução fotocatalítica de Cr(VI). Em seguida, foram analisadas as condições operacionais tais como massa de TiO2, concentração de ácido tartárico, valor do pH, temperatura e concentração inicial de Cr(VI). Os resultados indicam elevada taxa de redução (1 mmolCr(VI) m-3illuminated volume s-1) e eficiência fotônica de 3.96% para Re = 830, 30 mg de TiO2 e 1.8 mM de ácido tartárico, a pH 3.0 e 25 ºC. As folhas de AC revestidas com filmes finos de TiO2-P25 mostraram ser adequadas para redução contínua de Cr(VI), sem perda de eficiência, durante 3 ciclos fotocatalíticos consecutivos.
No terceiro sistema fotocatalítico, a redução de Cr(VI) foi avaliada utilizando a mesma quantidade de diferentes catalisadores (Fe2O3, ZnO, WO3, CdS, TiO2 -PC500, TiO2-PC105, TiO2-P25) irradiados por luz solar simulada. Usando TiO2 -P25, a taxa de reação foi avaliada para duas fontes de irradiação, luz solar ou LEDs-UVA. Para avaliar os efeitos dos mecanismos de iluminação posterior (BSI) e frontal (FSI) foi usado o reator NETmix com a placa de vidro superior e/ou a placa de aço inoxidável inferior revestida com TiO2-P25. Em condições otimizadas, as taxas de redução foram de 1.16 e 3.61 mmolCr(VI) m-3illuminated volume s-1, para os mecanismos BSI e FSI, respectivamente. A reutilização dos filmes fotocatalíticos no NETmix também foi avaliada por três ciclos consecutivos usando soluções novas de Cr(VI).
A oxidação fotocatalítica das espécie As(III) através dos sistemas UVC/H2O2 e fotocatálise heterogênea com TiO2/Fe2O3 e foi realizada no fotorreator NETmix sob iluminação de LEDs-UVA ou -UVC. No sistema LEDs-UVC/H2O2, a influência da concentração de peróxido de hidrogênio foi verificada. No entanto, devido ao baixo fluxo de fotões emitidos pelos LEDs-UVC, a oxidação de As(III) não foi eficiente. Por outro lado, nos sistemas de fotocatálise heterogênea, a oxidação As(III) foi atingida e avaliou-se o efeito de vários parâmetros, como a quantidade de catalisador, a adição de H2O2 e o mecanismo de iluminação (BSI ou FSI). Nas condições otimizadas com filmes finos de TiO2, as taxas de oxidação foram de 0.44 e 1.22 mmolAs(III) m-3illuminated volume s-1, para os mecanismos BSI e FSI, respectivamente. Além disso, a reutilização do catalisador foi realizada nas melhores condições operacionais, não mostrando perda de eficiência durante 3 ciclos fotocatalíticos consecutivos.
Table of Contents
1
Introduction ...1
1.1 General aspects of arsenic and chromium ... 3
1.1.1 Sources of arsenic and chromium ... 5
1.1.2 Distribution of arsenic and chromium in natural waters and environmental impact ... 8
1.1.3 Arsenic and Chromium Speciation ... 11
1.1.4 Toxicity and human health ... 13
1.1.5 Analytical techniques ... 15
1.2 Arsenic and chromium removal from water/wastewater ... 18
1.2.1 Adsorption ... 19
1.2.2 Coagulation ... 20
1.2.3 Electrochemical methods ... 21
1.2.4 Ion exchange ... 22
1.2.5 Membrane separation ... 23
1.2.6 Phytoremediation, bioremediation, biosorption and biofiltration ... 24
1.2.7 Oxidative/Reductive processes ... 26
1.3 Advanced oxidation/reduction processes ... 28
1.3.1 Iron based processes ... 28
1.3.2 H2O2-UVC ... 32 1.3.3 Heterogeneous photocatalysis ... 32 1.3.3.1 Photocatalyst Immobilization ... 39 1.3.3.2 Photocatalytic Reactors ... 42 1.4 References ... 47 1.5 Objectives ... 63 1.6 Thesis outline ... 65
2
Materials and Methods ... 67
2.1 Chemicals and reagents ... 69
2.2 Analytical Methods ... 72
2.2.1 Total chromium concentration ... 72
2.2.2 Hexavalent chromium concentration ... 72
2.2.3 Total arsenic concentration ... 72
2.2.4 Pentavalent arsenic concentration ... 73
2.2.5 Dissolved iron concentration ... 73
2.2.7 pH, temperature, conductivity and dissolved oxygen ... 74 2.2.8 Dissolved organic carbon (DOC) ... 74 2.2.9 Low-molecular-weight carboxylate anions (LMWCA) ... 74 2.2.10 Ionic chromatography ... 74 2.2.11 Fourier transform infrared spectroscopy ... 75 2.2.12 Total suspended solids ... 75 2.2.13 Turbidity ... 75 2.2.14 Actinometry ... 75
2.2.14.1 Simulated sunlight (SUNTEST) ... 76 2.2.14.2 Visible lamp ... 77 2.2.14.3 UVA lamp ... 77 2.2.14.4 UVC lamp ... 77 2.2.14.5 LEDs-UVA ... 77 2.2.14.6 Natural sunlight ... 78 2.2.14.7 Calculations ... 78
2.2.15 Scanning electron microscopy (SEM) - Energy dispersive X-ray (EDX) ... 81 2.2.16 X-ray photoelectron spectroscopy (XPS) ... 81 2.3 Catalyst film preparation ... 81 2.3.1 Cellulose acetate monolithic structures... 81 2.3.2 Cellulose acetate sheets ... 83 2.3.3 Glass slab and stainless steel slab ... 84 2.4 Experimental units and procedures ... 85 2.4.1 Lab-scale tubular photoreactor ... 85 2.4.1.1 Experimental procedure ... 87 2.4.1.1.1 UVA-Vis/Fe(III)/organic ligands reaction ... 87 2.4.1.1.2 UVA-Vis/TiO2/scavenger ... 88
2.4.2 Lab-scale annular photoreactor ... 89 2.4.2.1 Experimental procedure ... 91 2.4.3 CPC solar pilot plant ... 91 2.4.3.1 Experimental procedure ... 92 2.4.4 Lab-scale micro-meso-structured reactor (NETmix) ... 93 2.4.4.1 Experimental procedure ... 102 2.4.4.1.1 Cr(VI) reduction ... 102 2.4.4.1.2 As(III) oxidation ... 102 2.5 References ... 104
3
Solar photocatalytic reduction of Cr(VI) over Fe(III) in the
presence of organic sacrificial agents ... 107
3.2 Materials and Methods ... 110 3.2.1 Wastewater characterization ... 110 3.3 Results and discussion ... 111 3.3.1 Effect of citric acid concentration on the photocatalytic reduction of Cr(VI) by Fe(III)/UVA-Vis/Citric acid system ... 111 3.3.2 Effect of iron concentration on the photocatalytic reduction of Cr(VI) by Fe(III)/UVA-Vis/Citric acid system ... 120 3.3.3 Effect of pH on the photocatalytic reduction of Cr(VI) by Fe(III)/UVA-Vis/Citric acid system ... 123 3.3.4 Effect of temperature on the photocatalytic reduction of Cr(VI) by Fe(III)/UVA-Vis/Citric acid system ... 126 3.3.5 Effect of irradiation source on the photocatalytic reduction of Cr(VI) by Fe(III)/Citric acid system ... 129 3.3.6 Effect of initial Cr(VI) concentration on its photocatalytic reduction by Fe(III)/UVA-Vis/Citric acid system ... 132 3.3.7 Effect of Fe(III)-carboxylate complex on the photocatalytic reduction of Cr(VI) ... 138 3.3.8 Real wastewater containing Cr(VI) ... 143 3.4 Conclusions ... 145 3.5 References ... 146
4
Photocatalytic Reduction of Cr(VI) Over TiO
2-Coated Cellulose
Acetate Monolithic Structures using Solar Light ... 149
4.1 Introduction ... 151 4.2 Materials and methods... 153 4.3 Results ... 154 4.3.1 Effect of TiO2 amount and CAM geometry on the photocatalytic reduction
of Cr(VI) by CAM-TiO2/UVA-Vis/citric acid system ... 154
4.3.2 Effect of pH on the photocatalytic reduction of Cr(VI) by CAM-TiO2
/UVA-Vis/citric acid system ... 166 4.3.3 Effect of citric acid concentration on the photocatalytic reduction of Cr(VI) by CAM-TiO2/UVA-Vis/citric acid system ... 169
4.3.4 Effect of initial chromium concentration on the photocatalytic reduction of Cr(VI) by CAM-TiO2/UVA-Vis/citric acid system ... 172
4.3.5 Effect of scavenger agent type on the photocatalytic reduction of Cr(VI) by CAM-TiO2/UVA-Vis system... 174
4.3.6 Effect of irradiation intensity on the photocatalytic reduction of Cr(VI) by CAM-TiO2/UVA-Vis/citric acid system ... 178
4.3.7 Effect of CAM reuse on the photocatalytic reduction of Cr(VI) by CAM-TiO2/UVA-Vis/citric acid system ... 179
4.4 Conclusions ... 183 4.5 References ... 184
5
Intensification of Heterogeneous TiO
2Photocatalysis using an
Innovative Micro-Meso-Structured Reactor for Cr(VI) Reduction
under Simulated Solar Light ... 189
5.1 Introduction... 191 5.2 Materials and Methods... 192 5.3 Results ... 193 5.3.1 Effect of scavenging agent type on the photocatalytic reduction of Cr(VI) by TiO2/UVA-Vis system ... 193
5.3.2 Effect of Reynolds number on the photocatalytic reduction of Cr(VI) by TiO2/UVA-Vis/tartaric acid system... 201
5.3.3 Effect of TiO2 mass on the photocatalytic reduction of Cr(VI) by TiO2
/UVA-Vis/tartaric acid system ... 205 5.3.4 Effect of tartaric acid concentration on the photocatalytic reduction of Cr(VI) by TiO2/UVA-Vis/tartaric acid system ... 207
5.3.5 Effect of pH on the photocatalytic reduction of Cr(VI) by TiO2
/UVA-Vis/tartaric acid system ... 209 5.3.6 Effect of initial Cr(VI) concentration on its photocatalytic reduction by TiO2/UVA-Vis/tartaric acid system... 211
5.3.7 Effect of temperature on the photocatalytic reduction of Cr(VI) by TiO2/UVA-Vis/tartaric acid system... 213
5.3.8 Effect of irradiation time on the photocatalytic reduction of Cr(VI) by TiO2/UVA-Vis/tartaric acid system... 215
5.3.9 Effect of dissolved oxygen concentration on the photocatalytic reduction of Cr(VI) by TiO2/UVA-Vis/tartaric acid system ... 217
5.3.10 Reuse of TiO2-CA structures in consecutive Cr(VI) reduction tests ... 218
5.4 Conclusions ... 221 5.5 References ... 223
6
Heterogeneous Photocatalysis for Hexavalent Chromium
Reduction: Effect of Reactor Configuration, Catalyst Type and
Light Source ... 227
6.1 Introduction... 229 6.2 Materials and Methods... 231 6.3 Results ... 232 6.3.1 Performance of different photoreactors on the photocatalytic reduction of Cr(VI) by TiO2/UVA-Vis/tartaric acid system ... 232
6.3.2 Effect of photocatalyst type over Cr(VI) reduction ... 239 6.3.3 Effect of radiation source on the photocatalytic reduction of Cr(VI) by TiO2-P25/tartaric acid system ... 243
6.3.4 Effect of irradiation mechanism on the photocatalytic reduction of Cr(VI) by TiO2-P25/tartaric acid system ... 246
6.3.5 Effect of photocatalyst reuse during the photocatalytic reduction of Cr(VI) by TiO2-P25/UVA-LEDs/tartaric acid system ... 250
6.4 Conclusions ... 254 6.5 References ... 256
7
Advanced Oxidation Processes using a Micro-Meso-Structured
Photoreactor (NETmix) under Microscale Illumination for As(III)
Oxidation to As(V) ... 259
7.1 Introduction ... 261 7.2 Material and Methods ... 263 7.3 Results ... 264 7.3.1 As(III) oxidation by H2O2/UVC-LEDs system ... 264
7.3.2 As(III) oxidation by TiO2/UVA-LEDs system ... 266
7.3.3 As(III) oxidation by Fe2O3/UVA-LEDs system ... 278
7.4 Conclusions ... 282 7.5 References ... 284
8
Conclusions and Future Work ... 287
8.1 Conclusions ... 289 8.1.1 Photocatalytic reduction of Cr(VI) by Fe(III)/UV in the presence of organic sacrificial agents ... 289 8.1.2 Reduction of Cr(VI) by heterogeneous photocatalysis in the presence of organic sacrificial agents ... 290 8.1.3 Photocatalytic oxidation of As(III) over UVC/H2O2 and heterogeneous
TiO2/Fe2O3 photocatalysis ... 294
List of Figures
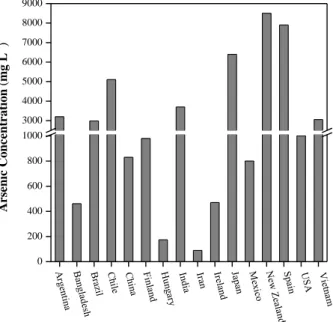
Figure 1.1 - Arsenic concentration in ground or surface water in different
countries. ... 9
Figure 1.2 - Arsenic Pourbaix diagram ([As] = 0.013 mM)... 12 Figure 1.3 - Chromium Pourbaix diagram ([Cr] = 0.02 mM). ... 13 Figure 1.4 - Techniques for the remediation of arsenic and chromium
contaminated waters. Adapted from Nidheesh and Anantha Singh [66], Singh et al. [34] and Mazur et al. [67]. ... 18
Figure 1.5 - Reactions scheme of an illuminated solution containing Cr(VI),
carboxylic acid (as oxalic, citric or tartaric acids) and Fe(III). Adapted from Hug et al. [123]. ... 31
Figure 1.6 - Schematic diagram for the photocatalytic transformation of
metal/metalloids on TiO2. Adapted from Litter [136]. ... 35
Figure 1.7 - Different reactor designs: a) Slurry Immersion Reactor; b) Slurry
Tubular Reactor Coupled with Compound Parabolic Collector; c) Spinning Disc Reactor; d) Fluidized Bed Reactor; e) Side-Emitting Optical Fibre Reactor; f) Monolith Reactor; g) Microreactor – Adapted from Van Gerven et al. [177] and Boyjoo et al. [188]. ... 45
Figure 2.1 - Catalytic bed before, during and after the coating process and the
tubular photocatalytic reactor packed with the CAM structures. ... 82
Figure 2.2 - Spray system picture. ... 84 Figure 2.3 - Schematic representation of the experimental set-up and views of
the lab-scale tubular photoreactor. ... 87
Figure 2.4 - Views of the lab-scale annular photoreactor and the schematic
representation of the experimental set-up. ... 90
Figure 2.5 - Views of the CPC solar pilot plant. ... 91 Figure 2.6 - Schematic representation of the CPC solar pilot plant. ... 92 Figure 2.7 - Scheme and photo of the NETmix reactor illuminated by simulated
solar light. ... 95
Figure 2.8 - Scheme and photo of the NETmix reactor illuminated by
UVA-LEDs/UVC-LEDs light. ... 96
Figure 2.9 - Normalized Output Power vs. Wavelength (nm) of UVA-LEDs.
Figure 2.10 - Relative Intensity vs. Angular Displacement of UVA-LEDs.
Picture from the fabricant data sheet. ... 97
Figure 2.11 - Normalized Output Power vs. Wavelength (nm) of UVC-LEDs.
Picture from the fabricant data sheet. ... 98
Figure 2.12 - Relative Intensity vs. Angular Displacement of UVC-LEDs.
Picture from the fabricant data sheet. ... 98
Figure 2.13 - Scheme and photos of the NETmix reactor. Configuration for
back-side-illumination. ... 100
Figure 2.14 - Scheme and photos of the NETmix reactor. Configuration for
front-side-illumination. ... 101
Figure 3.1 - Fe(III)-citrate speciation diagram for iron concentration of 0.04 mM
a) without and b) with equal citric acid molar concentration at 25 ºC. ... 112
Figure 3.2 - Influence of citric acid concentration on Cr(VI) photocatalytic
reduction ([Cr] = 0.2 mM) by Fe(III)/UVA-Vis/Citric acid system in the lab-scale photoreactor (SUNTEST at 500 W m-2). [Fe(III)] = 0.04 mM, pH = 3, T = 25 ºC. [citric acid] = () 0.04 mM, () 0.1 mM, () 0.2 mM, () 0.3 mM, () 0.4 mM, () 0.6 mM, () 0.8 mM, () 4 mM. ... 114
Figure 3.3 - Fe(III)-citrate speciation diagram for an iron concentration of
0.04 mM and different citric acid concentrations a) 0.1; b) 0.2; c) 0.3; d) 0.4; e) 0.6; f) 0.8; g) 4, at 25 ºC. ... 120
Figure 3.4 - Influence of iron concentration on Cr(VI) photocatalytic reduction
([Cr] = 0.2 mM) by Fe(III)/UVA-Vis/Citric acid system at pH 3 and 25 ºC in the lab-scale photoreactor (SUNTEST at 500 W m-2). [citric acid] = 0.6 mM, [Fe(III)] = (, ) 0.02 mM, (, ) 0.04 mM, (, ) 0.08 mM, (, ) 0.16 mM, (, ) 0.20 mM, (, ) 0.24 mM. Solid symbols – [Cr(VI)]/[Cr(VI)0]; open symbols – [Fe(total)]. ... 121
Figure 3.5 - Influence of iron concentration on Cr(VI) photocatalytic reduction
([Cr] = 0.2 mM) by Fe(III)/UVA-Vis/Citric acid system at pH 3 and 25 ºC. [citric acid] = 0.6 mM, [Fe(III)]0 = 0.02 mM (, ); 0.04 mM (, ); 0.08 mM (, ); 0.16 mM (, ); 0.20 mM (, ); 0.24 mM (, ). Solid symbols – [Fe(II)]; open symbols – [Fe(III)].. ... 122
xxv
Figure 3.6 - Influence of pH value on Cr(VI) photocatalytic reduction
([Cr] = 0.2 mM) by Fe(III)/UVA-Vis/Citric acid system in the lab-scale photoreactor (SUNTEST at 500 W m-2) with 0.04 mM of iron at 25 ºC. [citric acid] = 0.6 mM, pH = (, ) 3.0, (, ) 3.5, (, ) 4.0, (,) 4.5, (, ) 5.0, (, ) 6.0, (, ) 7.0, (, ) 8.0. Solid symbols – [Cr(VI)]/[Cr(VI)0]; open symbols – [Fe(total)]. ... 123
Figure 3.7 - Distribution of hexavalent chromium species as a function of the
solution pH ([Cr(VI)] = 0.2 mM; T = 25ºC). ... 125
Figure 3.8 - Influence of temperature on Cr(VI) photocatalytic reduction ([Cr] =
0.2 mM) by Fe(III)/UVA-Vis/Citric acid system in the lab-scale photoreactor (SUNTEST at 500 W m-2) with 0.04 mM of iron at pH 5.0. [citric acid] = 0.6 mM, temperature = (, ) 15 ºC, (, ) 17.5 ºC, (, ) 20.0 ºC, (, ) 25 ºC, (, ) 30.0 ºC, (, ) 35.5 ºC, (, ) 40.0 ºC. Solid symbols – [Cr(VI)]/[Cr(VI)0]; open symbols – [Fe(total)]. ... 127
Figure 3.9 - Fe(III)-citrate speciation diagrams for an iron concentration of
0.04 mM and different temperatures (a) 15ºC; b) 17.5ºC; c) 20ºC; d) 30ºC; e) 35ºC; f) 40ºC. ... 128
Figure 3.10 - Influence of irradiance source on Cr(VI) photocatalytic reduction
([Cr] = 0.2 mM) by Fe(III)/Citric acid system with 0.04 mM of iron at pH 5.0 and 25 ºC. [citric acid] = 0.6 mM; irradiance source = () SUNTEST at 500 W m-2, () SUNTEST at 300 W m-2, () UVC lamp, () UVA lamp, () visible lamp, () solar light. ... 131
Figure 3.11 - Influence of Cr(VI) initial concentration on its photocatalytic
reduction by Fe(III)/UVA-Vis/Citric acid system at pH 5.0 and 25 ºC in the lab-scale photoreactor (SUNTEST at 500 W m-2), with the respective concentrations:
a) [citric acid] = 0.6 mM, [Fe(III)] = 0.04 mM, [Cr(VI)] = () 0.02 mM; () 0.2 mM; () 0.4 mM; () 0.8 mM. b) [Fe(III)] = 0.04 mM, [Cr(VI)] and [citric acid] = () 0.02 and 0.06 mM; () 0.2 and 0.6 mM; () 0.4 and 1.2 mM; ( ) 0.8 and 2.4 mM. c) [Cr(VI)], [citric acid], [Fe(III)] = ( ) 0.02, 0.06, 0.004 mM; () 0.2, 0.6, 0.04 mM; ( ) 0.4, 1.2, 0.08 mM; ( ) 0.8, 2.4, 0.16 mM. ... 133
Figure 3.12 - Chromium speciation diagrams for different initial Cr(VI)
concentrations a) 0.02 mM; b) 0.2 mM; c) 0.4 mM; d) 0.8 mM. ... 136
Figure 3.13 - Fe(III)-citrate speciation diagrams for different initial Cr(VI), citric
acid and Fe(III) concentrations: a) 0.02, 0.06, 0.04 mM; b) 0.02, 0.06, 0.004 mM; c) 0.4, 1.2, 0.04 mM; d) 0.4, 1.2, 0.08 mM; e) 0.8, 2.4, 0.04 mM; f) 0.8, 2.4, 0.16 mM, respectively. ... 137
0
10
20
30
40
50
60
70
80
90
0.0
0.2
0.4
0.6
0.8
1.0
C
r(V
I)
/
C
r(V
I)
0 RAD-ON0
10
20
30
40
50
60
70
80
90
0.0
0.2
0.4
0.6
0.8
1.0
C
r(V
I)
/
C
r(V
I)
0 RAD-ON0.0
0.2
0.4
0.6
0.8
1.0
C
r(V
I)
/
C
r(V
I)
0 RAD-ON0.0
0.2
0.4
0.6
0.8
1.0
C
r(V
I)
/
C
r(V
I)
0 RAD-ONFigure 3.14 - Influence of scavenging agent on Cr(VI) photocatalytic reduction
([Cr] = 0.2 mM) by Fe(III)/scavenging agent system with [scavenging agent] = 0.6 mM, 0.04 mM of iron at pH 5.0 and 25 ºC in the lab-scale photoreactor (SUNTEST at 500 W m-2). Scavenging agent = (, ) citric acid, (, ) oxalic acid, (, ) maleic acid, (, ) EDTA. Solid symbols – [Cr(VI)]/[Cr(VI)0]; open symbols – [Fe(total)]. ... 139
Figure 3.15 - Fe(III) speciation diagrams for an iron concentration of 0.04 mM
and different scavenging agents with [scavenging agent] = 0.6 mM. a) oxalic acid; b) maleic acid (no complex formation); c) EDTA at 25 ºC. ... 142
Figure 3.16 - Photoreduction of Cr(VI) present in a real wastewater by a
Fe(III)/UVA-vis/Citric acid system with 2.4 mM of citric acid and 0.16 mM of iron at pH 5.0, 25 ºC in the lab-scale photoreactor (SUNTEST at 500 W m-2). a) Solid symbol – [Cr(VI)]/[Cr(VI)0]; open symbol – [Fe(total)], b) Fe(II) () and Fe(III) () concentrations. ... 144
Figure 4.1 - Influence of the number of TiO2-P25 layers (deposited on the CAM structures) on the Cr(VI) photocatalytic reduction ([Cr(VI)] = 0.02 mM) by CAM-TiO2/UVA-Vis/citric acid system at pH 3.0 and 25 ºC (43.9 WUV m-2); [Citric acid] = 0.6 mM; TiO2 layers number = () 3, () 6, () 9, () 12. .. 155
Figure 4.2 - Systems under front-side illumination (FSI) and back-side
illumination (BSI) with different TiO2 thin films thickness. ... 157
Figure 4.3 - Vertical cut of the tubular reactor packed with the different CAM
geometries tested and scheme of the CAM walls irradiated by FSI or BSI. ... 162
Figure 4.4 - Influence of the CAM-TiO2-P25 system and its geometry on the Cr(VI) photocatalytic reduction ([Cr(VI)] = 0.02 mM) by TiO2/UVA-Vis/citric acid system at pH 3.0 and 25 ºC (43.9 WUV m-2); [Citric acid] = 0.6 mM; Slurry TiO2 = (); CAM-TiO2 geometry = () a), () b), () c). ... 163
Figure 4.5 - SEM images of (a, b) fresh CAM-TiO2 sample, c) used CAM-TiO2 sample; EDX spectra of d) natural CAM sample, e) fresh CAM-TiO2 sample and f) used CAM-TiO2 sample. ... 164
Figure 4.6 - XPS survey of a) fresh CAM-TiO2 sample and b) used CAM-TiO2 sample; XPS Ti 2p / Cr 2p spectra of c) fresh CAM-TiO2 sample and d) used CAM-TiO2 sample. ... 166
Figure 4.7 - Influence of pH value on the Cr(VI) photocatalytic reduction
([Cr(VI)] = 0.02 mM) by CAM-TiO2/UVA-Vis/citric acid system at 25 ºC (43.9 WUV m-2); [Citric acid] = 0.6 mM; 6 TiO2-P25 layers; pH = () 2.5, () 4.0, () 5.0, () 6.0. ... 168
Figure 4.8 - Influence of citric acid concentration on Cr(VI) photocatalytic
reduction ([Cr(VI)] = 0.02 mM) by CAM-TiO2/UVA-Vis/citric acid system at pH 2.5 and 25 ºC (43.9 WUV m-2). 6 TiO2-P25 layers; Citric acid concentration (mM) = () 0.0, () 0.2, () 0.4, () 0.6, () 1.2, () 2.3, () 4.6, () 6.9. ... 171
Figure 4.9 - Influence of initial Cr(VI) concentration on its photocatalytic
reduction by CAM-TiO2/UVA-Vis/citric acid system at pH 2.5 and 25 ºC (43.9 WUV m-2). [Citric acid] = 6.9 mM; 6 TiO2-P25 layers; [Cr(VI)]0 (mM) = () 0.01, () 0.02, () 0.03, () 0.04, () 0.05, () 0.06; () [Cr(VI)]0 = 0.06 mM and [Citric acid] = 20.7 mM. ... 174
Figure 4.10 - Influence of scavenger agent type on Cr(VI) photocatalytic
reduction ([Cr(VI)] = 0.02 mM) by CAM-TiO2/UVA-Vis system at pH 2.5 and 25 ºC (43.9 WUV m-2). [scavenger agent] = 6.9 mM; 6 TiO2-P25 layers; scavenger agent = () Maleic acid, () Oxalic acid, () Citric acid, () EDTA. ... 176
Figure 4.11 - Influence of source of light on Cr(VI) photocatalytic reduction
([Cr(VI)] = 0.02 mM) by CAM-TiO2/UVA-Vis/citric acid system at pH 2.5; [Citric acid] = 6.9 mM; 6 TiO2-P25 layers; irradiation source = () SUNTEST at 27.1 WUV m-2 () SUNTEST at 43.9 WUV m-2, () Natural sunlight at 31 WUV m-2. ... 179
Figure 4.12 - Reuse of CAM-TiO2 on Cr(VI) photocatalytic reduction ([Cr(VI)] = 0.02 mM) by CAM-TiO2/UVA-Vis/citric acid system at pH 2.5 and 25 ºC (43.9 WUV m-2). [Citric acid] = 6.9 mM; 6 TiO2-P25 layers; Cycles number = () 1, () 2, () 3, () 4, () 5, () 6, () 7, () 8, () 9, () 10. ... 180
Figure 4.13 - Reuse of CAM-TiO2 on Cr(VI) photocatalytic reduction ([Cr(VI)] = 0.02 mM) by CAM-TiO2/UVA-Vis/citric acid system at pH 2.5 and 25 ºC (43.9 WUV m-2), considering the CAM structures washing between cycles. [Citric acid] = 6.9 mM; 6 TiO2-P25 layers; Cycles number = () 1, () 2. ... 182
Figure 5.1 - Influence of different scavengers on the Cr(VI) photocatalytic
reduction ([Cr(VI)] = 0.02 mM) by TiO2/UVA-Vis system at pH 3.0 and 25 ºC in the NETmix reactor (43.9 WUV m-2); (a) Cr(VI) reduction at [scavenger concentration] = 1.2 mM; TiO2 mass = 30 mg; Re = 540. Scavenger: () citric acid, () oxalic acid, () tartaric acid, () methanol, () ethanol; (b) Scavenger consumption () citric acid, () oxalic acid, () tartaric acid and DOC removal () citric acid, () oxalic acid, () tartaric acid. ... 195
Figure 5.2 - Influence of Reynolds number on Cr(VI) photocatalytic reduction
([Cr(VI)] = 0.02 mM) by TiO2/UVA-Vis/tartaric acid system at pH 3.0 and 25 ºC in the NETmix reactor (43.9 WUV m-2); [tartaric acid] = 1.2 mM; TiO2 mass = 30 mg. Re = () 70, () 160, () 270, () 540, () 830, () 1100. ... 203
Figure 5.3 - Influence of TiO2 mass immobilized in the cellulose acetate sheet on Cr(VI) photocatalytic reduction ([Cr(VI)] = 0.02 mM) by TiO2 /UVA-Vis/tartaric acid system at pH 3.0 and 25 ºC in the NETmix reactor (43.9 WUV m-2). [tartaric acid] = 1.2 mM; Re = 830; TiO2 mass = () 0 mg, () 10 mg, () 20 mg, () 30 mg, () 40 mg, () 50 mg, () 60 mg. ... 206
Figure 5.4 - Influence of tartaric acid concentration on Cr(VI) photocatalytic
reduction ([Cr(VI)] = 0.02 mM) by TiO2/UVA-Vis/tartaric acid system at pH 3.0 and 25 ºC in the NETmix reactor (43.9 WUV m-2). [tartaric acid] = () 0.3 mM, () 0.6 mM, () 1.2 mM, () 1.8 mM, () 2.4 mM; TiO2 mass = 30 mg; Re = 830. ... 208
Figure 5.5 - Influence of pH on Cr(VI) photocatalytic reduction ([Cr(VI)] =
0.02 mM) by TiO2/UVA-Vis/tartaric acid system at 25 ºC in the NETmix reactor (43.9 WUV m-2); [tartaric acid molar ratio] = 1.8 mM; TiO2 mass = 30 mg; Re = 830; pH = () 3.0, () 4.0, () 5.0, () 6.0, () 7.0. ... 209
Figure 5.6 - Influence of initial chromium concentration on Cr(VI)
photocatalytic reduction by TiO2/UVA-Vis/tartaric acid system at pH 3.0 and 25 ºC in the NETmix reactor (43.9 WUV m-2); TiO2 mass = 30 mg; Re = 830; [Cr]0 = () 0.01 mM, () 0.02 mM, () 0.03 mM, () 0.04 mM, () 0.05 mM, () 0.06 mM. [tartaric acid] = 1.8 mM; () [Cr]0 = 0.06 mM. [tartaric acid] = 5.4 mM. ... 212
Figure 5.7 - Influence of temperature on Cr(VI) photocatalytic reduction by
TiO2/UVA-Vis/Tartaric acid system at pH 3.0 in the NETmix reactor (43.9 WUV m-2); [Cr]
0 = 0.02 mM; [tartaric acid] = 1.8 mM; TiO2 mass = 30 mg; Re = 830; Temperature = () 15 ºC, () 25 ºC, () 35 ºC. ... 214
Figure 5.8 - Influence of irradiation time on Cr(VI) photocatalytic reduction by
TiO2/UVA-Vis/Tartaric acid system at pH 3.0 and 25 ºC in the NETmix reactor (43.9 WUV m-2); [Cr]0 = 0.02 mM; [tartaric acid] = 1.8 mM; TiO2 mass = 30 mg; Re = 830; Cr(VI) decay: a) in function of time; b) in function of accumulated energy. 𝜏 = () 0.88 min, () 0.82 min, () 0.77 min; ... 216
Figure 5.9 - Influence of dissolved oxygen on Cr(VI) photocatalytic reduction
by TiO2/UVA-Vis/Tartaric acid system at pH 3.0 and 25 ºC in the NETmix reactor (43.9 WUV m-2); [Cr]0 = 0.02 mM; [tartaric acid] = 1.8 mM; TiO2 mass = 30 mg; Re = 830; Cr(VI) decay: continuous air () and N2 () bubbling. Dissolved oxygen concentration = air () and N2 () bubbling. ... 218
Figure 5.10 - Reuse of TiO2-P25 CA sheets on Cr(VI) photoreduction using the micro-meso-structured photoreactor (43.9 WUV m-2) at pH 3.0 and 25ºC; [Cr]0 = 0.02 mM; [tartaric acid] = 1.8 mM; TiO2 mass = 30 mg; Re = 830; Cycles
number = () 1, () 2, () 3, () 4, () 5, () 6, () 7, () 8, () 9, () 10. ... 219
Figure 6.1 - Influence of TiO2-P25 amount deposited on the CAM structures of the MTP and on the glass slab of the NETmix on the Cr(VI) photocatalytic reduction ([Cr(VI)] = 0.02 mM) by TiO2/UVA-Vis/tartaric acid system at pH 3.0 and 25 ºC; [Tartaric acid] = 1.8 mM; TiO2 amount deposited on the CAM structures = () 30 mg, () 40 mg, () 50 mg, () 60 mg. TiO2 amount deposited on the glass slab = () 10 mg, () 20 mg, () 30 mg, () 40 mg, () 50 mg, () 60 mg. ... 234
Figure 6.2 - Scanning of CAM walls: (—) without catalyst film, (—) with catalyst film in one side, (—) with catalyst film in both sides. ... 239
Figure 6.3 - Energy levels of calculated conduction and valence band edges (ECB and EVB) and band-gap energies (Eg) of semiconductors at pH 3.0 and 25ºC. 241
Figure 6.4 - Cr(VI) photocatalytic reduction for different catalysts ([Cr(VI)] =
0.02 mM) by UVA-Vis/tartaric acid system at pH 3.0 and 25 ºC using the NETmix reactor; [Tartaric acid] = 1.8 mM; Catalyst amount = 20 mg; Catalyst = () TiO2-P25, () TiO2-P25-PEG, ()TiO2-PC500, ()TiO2-PC105, () CdS-PEG, () WO3-PEG, () ZnO, () Fe2O3, () no catalyst. ... 242
Figure 6.5 - Influence of TiO2-P25 amount deposited on the glass slab of the NETmix on the Cr(VI) photocatalytic reduction ([Cr(VI)] = 0.02 mM) by TiO2 -P25/UVA-LEDs /tartaric acid system at pH 3.0 and 25 ºC; [Tartaric acid] = 1.8 mM; TiO2 amount = () 10 mg, () 20 mg, () 40 mg, () 60 mg, () 100 mg, () 150 mg. ... 245
Figure 6.6 - Influence of TiO2-P25 amount deposited on the NETmix channels and chambers on the Cr(VI) photocatalytic reduction ([Cr(VI)] = 0.02 mM) by TiO2-P25/ UVA-LEDs /tartaric acid system at pH 3.0 and 25 ºC; [Tartaric acid] = 1.8 mM; TiO2-P25 amount = () 41 mg, () 111 mg, () 203 mg. ... 247
Figure 6.7 - Influence of the illumination type on the Cr(VI) photocatalytic
reduction ([Cr(VI)] = 0.02 mM) by TiO2-P25/tartaric acid system at pH 3.0 and 25 ºC using the NETmix reactor; [Tartaric acid]= 1.8 mM; TiO2-P25 amount deposited on the glass slab = 20 mg: TiO2-P25 amount in the channels and chambers = 111 mg. Reactor configuration: () TiO2-P25on glass slab using the back acrylic slab, () TiO2-P25on glass slab using the back stainless steel slab, () TiO2-P25on glass slab with iron addition, () TiO2-P25 on back stainless steel slab, () TiO2-P25 on glass slab and on back stainless steel slab. ... 249
Figure 6.8 - Reuse of TiO2-P25 films deposited on the NETmix glass slab (a) or NETmix stainless steel slab (b and c) on Cr(VI) photoreduction ([Cr(VI)] = 0.02 mM) by TiO2-P25/UVA-LEDs/tartaric acid system at pH 3.0 and 25 ºC;
[Tartaric acid]= 1.8 mM (a, b) or 0.18 mM (c); TiO2-P25 mass = 20 mg (a) or 111 mg (b and c). Cycles number = () 1, () 2, () 3. ... 252
Figure 7.1 - Influence of H2O2 concentration on the As(III) oxidation ([As(III)] = 1.33 × 10⁻² mM) by UVC-LEDs/H2O2 system at pH 5.0 and 20 ºC; [H2O2]= (, ) 0.7 mM, (, ) 2.9 mM, (, ) 5.9 mM, Solid symbols – [As(III)]/[As(III)]0; open symbols – H2O2 consumption. ... 265
Figure 7.2 - Energy levels of calculated conduction and valence band edges (ECB and EVB) and band-gap energies (Eg) of semiconductors at pH 5.0 and 20ºC. 270
Figure 7.3 - Influence of TiO2 mass on the As(III) oxidation ([As(III)] = 1.33 × 10⁻² mM) by UVA-LEDs/TiO
2/NETmix-GS system at pH 5.0 and 20 ºC; TiO2 mass = () 10 mg, () 20 mg, () 40 mg. ... 271
Figure 7.4 - Distribution of As(III) species as a function of the solution pH
([As(III)] = 1.33 × 10⁻² mM; T = 20ºC; ionic strength = 0.1 M). ... 272
Figure 7.5 - Distribution of As(V) species as a function of the solution pH
([As(V)] = 1.33 × 10⁻² mM; T = 20ºC; ionic strength = 0.1 M). ... 273
Figure 7.6 - Influence of H2O2 concentration on the As(III) oxidation ([As(III)] = 1.33 × 10⁻² mM) by UVA-LEDs/TiO2/NETmix-GS system at pH 5.0 and 20 ºC; TiO2 mass = 20 mg; [H2O2]= () 0.0 mM, (, ) 0.3 mM, (, ) 0.7 mM, (, ) 1.5 mM, (, ) 2.9 mM, (, ) 4.4 mM, (, ) 5.9 mM. Solid symbols – [As(III)]/[As(III)]0; open symbols – H2O2 consumption. ... 274
Figure 7.7 - Influence of H2O2 concentration on the As(III) oxidation ([As(III)] = 1.33 × 10⁻² mM) by UVA-LEDs/TiO2/ NETmix-SSS system at pH 5.0 and 20 ºC; TiO2 mass = ~111 mg; [H2O2]= () 0.0 mM, (, ) 0.3 mM, (, ) 1.5 mM, (, ) 2.9 mM, (, ) 4.4 mM. Solid symbols – [As(III)]/[As(III)]0; open symbols – H2O2 consumption. ... 276
Figure 7.8 - As(III) oxidation ([As(III)] = 1.33 × 10⁻² mM) by UVA-LEDs/TiO2/ H2O2/NETmix-SSS system at pH 5.0 and 20 ºC; TiO2 mass = ~111 mg; [H2O2] = 0.3 mM. () As(total), () As(V), () As(III). ... 277
Figure 7.9 – Reuse effect of TiO2-P25 films deposited on the NETmix stainless steel slab on the As(III) oxidation ([As(III)] = 1.33 × 10⁻² mM) by UVA-LEDs/TiO2/NETmix-SSS system at pH 5.0 and 20 ºC; TiO2 mass = ~111 mg; [H2O2]= 0.3 mM. Cycles number = (, ) 1, (, ) 2, (, ) 3. Solid symbols – [As(III)]/[As(III)]0; open symbols – H2O2 consumption. ... 278
Figure 7.11 - Influence of Fe2O3 mass and H2O2 presence on the As(III) oxidation ([As(III)] = 1.33 × 10⁻² mM) by UVA-LEDs/Fe2O3/ NETmix-GS system at pH 5.0 and 20 ºC; Fe2O3 mass = () 10 mg, () 20 mg, () 40 mg (without H2O2); Fe2O3 mass = (, ) 20 mg (with 0.7 mM of H2O2). Solid symbols – [As(III)]/[As(III)]0; open symbols – H2O2 consumption... 280
Figure 7.12 - Influence of H2O2 concentration on the As(III) oxidation ([As(III)] = 1.33 × 10⁻² mM) by UVA-LEDs/Fe2O3/NETmix-SSS system at pH 5.0 and 20 ºC; Fe2O3 mass = ~111 mg. [H2O2]= (, ) 1.5 mM, (, ) 2.9 mM, (, ) 4.4 mM. Solid symbols – [As(III)]/[As(III)]0; open symbols – H2O2 consumption. ... 281
List of Tables
Table 1.1 - Maximum level allowed in drinking water for some oxyanions by the
European Union, USA and Brazil legislation, values suggested by the WHO, potential health effects and common sources of each contaminant. ... 4
Table 1.2 - Analytical techniques for arsenic and chromium determination. ... 16 Table 1.3 - Quantum yield for the photoreduction of Fe(III) by various carboxylic
acids [115]. ... 30
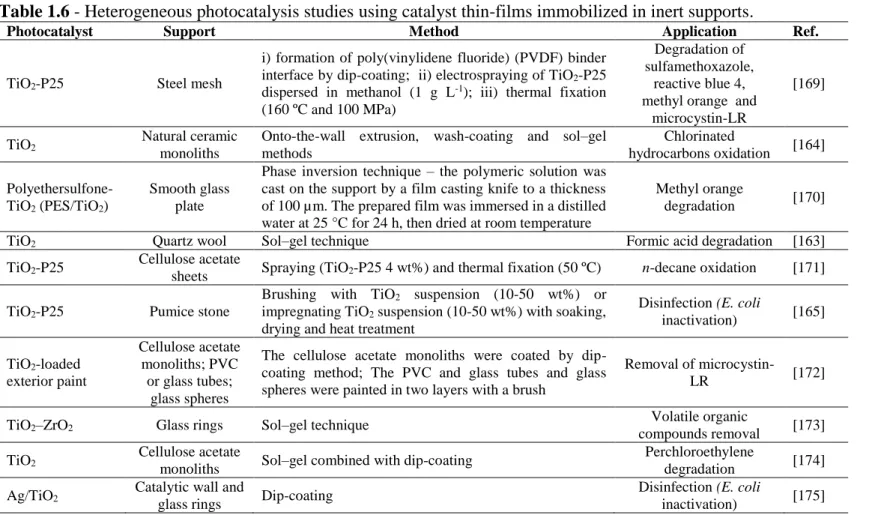
Table 1.4 - Studies on the As(III) oxidation by heterogeneous photocatalysis. 36 Table 1.5 - Studies on the Cr(VI) reduction by heterogeneous photocatalysis. 38 Table 1.6 - Heterogeneous photocatalysis studies using catalyst thin-films
immobilized in inert supports. ... 41
Table 1.7 - Comparison of catalyst coated surface per reaction liquid volume in
different photoreactor configurations (adapted from Van Gerven et al. [177]). 43
Table 2.1 - Energy levels values of calculated conduction and valence band edges
(ECB and EVB), band-gap energies (Eg) and pH of zero point charge (pHZPC) of semiconductors at pH 3.0 and 25ºC. ... 71
Table 2.2 - TiO2 P25, PC500 and PC105 characteristics. ... 71
Table 2.3 - Steps of graphite furnace method for As(total) determination. ... 73 Table 2.4 - Average UV intensity, photon flux and radiant power of the
irradiation sources. ... 80
Table 2.5 - NETmix geometrical characteristics. ... 94 Table 3.1 - Characteristics of the galvanic wastewater. ... 110 Table 3.2 - Zero order kinetic constants for photocatalytic Cr(VI) reduction by
Fe(III)/UV-Vis/Citric acid system along with the corresponding coefficient of determination (R2) and residual variance (S2r). ... 115 Table 4.1 - CAM thin films properties. ... 153 Table 4.2 - Photonic efficiencies and pseudo-first order kinetic constants for
Cr(VI) reduction along with the corresponding coefficient of determination (R2) and residual variance (S2r). ... 158
Table 5.1 - Properties of thin films deposited on CA sheets. ... 192 Table 5.2 - Photonic efficiencies and pseudo-first-order kinetic constants for
Table 6.1 - Film thickness and density along with the corresponding photonic
efficiencies, pseudo-first-order kinetic constants, coefficient of determination (R2) and residual variance (S2
r) for reduction of 0.02 mM of Cr(VI) with 1.8 mM of tartaric acid as scavenger, at pH 3.0 and 25 ºC. ... 236
Table 7.1 - Photonic efficiencies and pseudo-first-order kinetic constants along
with the corresponding coefficient of determination (R2) and residual variance (S2r) for oxidation of 0.0133 mM of As(III), at pH 5.0 and 20 ºC. ... 268
Table 8.1 - Comparison between the main results for reduction of 0.02 mM of
Cr(VI) by heterogeneous photocatalysis in different reactors and system configuration. ... 293
Notation
Acronyms
2-NB 2-Nitrobenzaldeyde
AAS Atomic absorption spectrometry AIP Adiabatic ionization potential AOPs Advanced oxidation processes
BSI Back-side illumination
CA Cellulose acetate
CAM Cellulose acetate monolithic structures
CEMUP Centro de Materiais da Universidade do Porto
CPC Compound parabolic collector
CT Concentration-time
CTC Charge-transfer-complex
DAD Diode array detector
DOC Dissolved organic carbon (mg L-1)
EDX Energy dispersive X-ray
FEUP Faculty of Engineering - University of Porto FSI Front-side illumination
GF-AAS Graphite furnace atomic absorption spectrometry
GS Glass slab
HPLC High performance liquid chromatography ISO International organization for standardization
LEDs Light-emitting diode
MTP Monolithic tubular photoreactor NETmix Micro-meso-structured photoreactor pHZPC Zero point of charge pH
Ref. Reference
SEM Scanning electron microscopy
SSS Stainless steel slab SUNTEST Solar radiation simulator TC Total carbon (mg L-1) TN Total nitrogen (mg L-1) TOC Total organic carbon (mg L-1) TSS Total suspended solids (mg L-1)
UV Ultraviolet
UVA Ultraviolet A
UVC Ultraviolet C
Vis Visible
ZVI Zero-valent iron
Symbols
Wavelength (nm)
Photonic efficiency (%)
max Maximum wavelength (nm)
x̅ Average wavelength (nm)
A Frequency factor (mM L-1 min-1)
C Concentration (mM)
C0 Initial concentration (mM)
d2ch Length of the monolithic channel (mm)
DL Detection limit (mM, M, mg L-1, g L-1)
E Energy (J)
E0 Redox potential (V)
Ea Activation energy (J mol-1)
ECB Energy level of conduction band edge (V)
Eg Energy of band gap (V)
EHOMO Energy of the highest occupied molecular orbital
EVB Energy level of valence band edge (V)
ew,ch Wall thickness of the monolithic channel (mm)
F0 Photon flux (einstein s-1)
h Incident radiation
k Kinetic constant (min-1, mM L-1 min-1, L kJ-1)
LCAM Length of the cellulose acetate monolith (mm)
NA Avogadro’s number (6.022 × 10²³ mol-1)
P Radiant power (W or J s-1)
QUV,n Accumulated energy (kJ L-1)
R Gas constant (8.314 J mol-1 K-1)
r0 Initial reaction rates (mM min-1)
R2 Coefficient of determination Re Reynolds number S2 r Residual variance ((mM L-1)2, mM2) T Temperature (ºC, K) t Time (min)
Tfinal Final temperature (ºC)
thold Hold temperature (ºC)
tn Time corresponding to n sample (s)
tramp Ramp temperature (ºC)
Vr Illuminated volume inside the reactor (L)
ρA,P25 Films density (mg cm−2)
Residence time (min)
𝜙 Quantum yield
Chemical names
ecb− Conduction band electron
HO2 Hydroperoxyl radical
hvb+ Valence band hole
O2− Superoxide radical
OH Hydroxyl radical
As(III) Trivalent arsenic As(total) Total arsenic
As(V) Pentavalent arsenic
As2O5 Arsenic pentoxide
CdS Cadmium sulfide
CO2 Carbon dioxide
CO2- Carbon dioxide anion radical Cr(III) Trivalent chromium
Cr(NO3 Chromium(III) nitrate
Cr(NO3)3.9H2O Chromium(III) nitrate nonahydrate Cr(total) Total chromium
Cr(VI) Hexavalent chromium
EDTA Ethylenediamine tetraacetic acid
Fe(II) Divalent iron
Fe(III) Trivalent iron Fe2O3 Iron(III) oxide
H2O2 Hydrogen peroxide
HF Hydrofluoric acid
HNO3 Nitric acid
K2Cr2O7 Potassium dichromate
NaAsO2 Sodium metaarsenite
NaOH Sodium hydroxide
NH4OH Ammonium hydroxide
NiCl2.6H2O Nickel chloride hexahydrate
O2 Oxygen molecular
PEG Polyethyleneglycol
TiO2 Titanium dioxide
TNBT Tetra-n-butyl orthotitanate
WO3 Tungsten trioxide
1
Introduction
This first chapter presents an overview of arsenic and chromium oxyanions occurrence in natural waters, their potential risks for the ecosystem and human health, as well as the current and potential treatment methods for water and wastewater remediation. The fundamentals concepts of the main advanced oxidative or reductive processes used in this thesis are detailedly described. Lastly, objectives and thesis outline are provided.
1.1 General aspects of arsenic and chromium
The concern about water quality and sanitation has increased during the last century. Since safe drinking water is scarce in several regions of the planet and fresh water is continuously polluted by countless contaminants, the water quality must be monitored and protected to reduce adverse health effects [1]. Unlike most organic pollutants, which can be biodegradable, inorganic chemicals, including oxyanions, are continuously accumulated in the environment [2], posing a threat to human health due to the potential risk of entry into the food chain. The ecosystem can be contaminated with inorganic chemicals from both natural and anthropogenic activities. Industrial processes such as electroplating, metal smelting and chemical manufacturing, are examples of anthropogenic sources of inorganic chemicals in water [3]. In order to protect the water quality, the World Health Organization (WHO) published the first guidelines for drinking-water quality in 1958 and the last update was in 2011. Additionally, others regulatory agencies have published local guidelines for drinking-water quality based on the treatment performance, analytical achievability and risks related to human health. Table 1.1 lists the maximum levels allowed in drinking water for some oxyanions contaminants by the European Union, USA and Brazil legislation, as well as the values suggested by the WHO. The potential health effects and the common sources of each contaminant are also presented.
Table 1.1 - Maximum level allowed in drinking water for some oxyanions by the European Union, USA and Brazil
legislation, values suggested by the WHO, potential health effects and common sources of each contaminant.
Contaminant Maximum allowed contaminant level Potential health effects Common sources Ref. EUa USAb Brazilc WHOd
Sb (g L -1) (M) 5 0.04 6 0.05 5 0.04 20 0.16 Blood alterations
Fire retardants, petroleum refineries, combustion of Sb-rich coal, electronic
waste [4], [5] As (g L -1) (M) 10 0.13 10 0.13 10 0.13 10 0.13
Risk of cancer, circulatory system alterations, skin
damage
Erosion of natural deposits, glass and electronics wastes [6] Cr (g L -1) (M) 50 0.96 100 1.92 50 0.96 50 0.96
Risk of cancer, allergic dermatitis
Erosion of natural deposits, pulp mills, electroplating, textile dyeing, leather
tanning and metallurgy factories
[7], [8] NO3- (g L -1) (M) 50000 962 10000 161 10000 161 50000 962 Blue-baby syndrome
Erosion of natural deposits, sewage,
fertilizers [9], [10] NO2- (g L -1) (M) 500 11 1000 22 1000 22 3000 65 Blue-baby syndrome
Erosion of natural deposits, sewage,
fertilizers [11], [12] Se (g L -1) (M) 10 0.13 50 0.13 10 0.13 40 0.51
Circulatory problems, hair and fingernails loss, numbness in fingers or
toes
Erosion of natural deposits, petroleum
and metal refineries, mines [13], [14] a – European Union Council Directive (98/83/CE, 3/11/1998); b – United States Environmental Protection Agency (EPA) in https://www.epa.gov/ground-water-and-drinking-water/table-regulated-drinking-water-contaminants#Inorganic; c – Brazilian Ministry of Health (Act 2914, 12/12/2011); d – World Health Organization - Guidelines for drinking-water quality - 4th ed.
In water contaminated with inorganic chemicals, the options for its remediation usually require an oxidative or reductive process to achieve the less soluble or less mobile form. Arsenic and chromium are examples of oxyanions that require initially an oxidative and a reductive pre-treatment step before their removal, respectively. The most toxic and mobile arsenic species is the trivalent one, being necessary a previous oxidation to remove it from water. However, chromium in its hexavalent form is more toxic and mobile than the trivalent one, being necessary a reductive process for water remediation. Additionally, arsenic and chromium are in the top of the 20 substances that pose the most significant potential threat to human health according to the Agency for Toxic Substances and Disease Registry (ATSDR 2015, USA). Therefore, the present chapter briefly reviews the sources, chemistry, toxicity, distribution, analytical methods and removal techniques of arsenic and chromium from water. Special emphasis is given to the photocatalytic treatment systems.
1.1.1 Sources of arsenic and chromium
Arsenic is a metalloid with distribution on earth of approximately 2.5 mg kg-1 and about 3.5 mg in the human body. Elemental arsenic occurs in three different allotropic forms: i) metallic arsenic, ii) yellow arsenic and iii) black arsenic. However, its incidence in the free state is uncommon, being widely distributed in soils, water, air and biota in more than 200 different minerals as a trace impurity or primary constituent, mostly in association with sulfides and oxides [15-18]. Typically, inorganic and organic arsenic compounds are non-volatile white powders, with no smell and no taste, being not detectable by the human sense. They can be easily solubilized depending on the pH, redox conditions, temperature and solution composition. The speciation is a key factor for monitoring the arsenic mobility, availability and toxicity [17, 18].
Usually, natural process as volcanic emissions and erosion of natural deposits are the most substantial processes responsible to mobilize arsenic species to the environment [16, 17]. The water contamination by arsenic is a problem that reaches all parts of the world. The health problems associated with water contaminated by arsenic are alarming in countries with high arsenic concentrations in all environmental compartments (Argentina, Bangladesh, Chile, China, Hungary, India, Mexico, Nepal, Rumania, Taiwan, Vietnam and the United States) and where the groundwater is one of main sources of drinking water and presents arsenic concentrations beyond its safe limit (Bangladesh, Brazil, China, Canada, England, India, Nepal, Thailand, United States) [18, 19]. Although natural activities are the main source of arsenic contamination, anthropogenic activities accentuated this problem. Even though in some countries inorganic arsenic compounds can no longer be used in agriculture, organic arsenic compounds are still used as pesticides [17]. In addition, activities in mining areas enhance the mobilization of arsenic and other co-pollutants. The use of arsenic contaminated groundwater for irrigation purposes in crop fields also elevates the arsenic contamination [16].
Arsenic is used in alloys, lead-acid batteries for automobiles and small quantities of elemental arsenic are added to other metals to form metal mixtures or alloys. Others processes as wood preservation, combustion of fossil fuels, and urban wastes are additional pathways for environmental arsenic problems and the contamination of soil sediments, water and food chain [18, 20].
The wood preservation with chromated copper arsenate (CCA) (hexavalent chromium, and pentavalent arsenic) is no longer used in several countries. However, constructions older than 20 years may still contain these compounds. As CCA is a water-soluble inorganic pesticide, it can be eluted from CCA-treated wood by exposure to rainwater or diffused in the air if the CCA-treated wood is incinerated. In Japan, for example, an earthquake in 2011 generated about 20
million tons of debris mainly from destroyed wooden houses which may contain high levels of chromium, copper and arsenic [21]. In the USA, the picnic tables have to be coated with an appropriate penetrating oil every two years to minimize the leaching of the toxic compounds and the adverse dermal contact [22].
Chromium was isolated and discovered as an element in 1797 from a sample of crocoite (PbCrO4), a mineral used as pigment. It occurs naturally on Earth’s crust in an average of 100 mg kg-1 as constituent of the granitic and basaltic igneous rocks, limestone, sandstones and ultramafic rock [23]. Besides the crocoite, chromium is found in other minerals as chromite (FeCr2O4), vauquelinite (CuPb2CrO4PO4OH), tarapacaite (K2CrO4) and bentorite (Ca6(CrAl)2(SO4)3). The major reserves of chromium are localized in China, India, Kazakhstan and South Africa, being 95% of the world reserves localized in the last two countries. Depending on the environmental conditions, it may continue in the original minerals or co-precipitated with manganese, aluminum and iron oxides and hydroxides, which are usually adsorbed on soil particles or complexed with soil organic compounds [24]. Chromium can occur in oxidation states ranging from −2 to +6. However, only trivalent (Cr(III)) and hexavalent (Cr(VI)) species are stable. The most common form that naturally occurs in the environment is Cr(III), which is insoluble in natural waters under near neutral conditions, presenting very low mobility and bioavailability. On the other hand, under strong oxidizing conditions, Cr(VI) can occur and persists in polyatomic anionic forms [23]. In fact, these two common forms are extremely different in charge, toxicity and physicochemical properties, being the speciation indeed an essential parameter [25].
Chromium has a large range of uses in the metals and chemical industries, as stainless steel and noniron alloys production, electropainting, pigments, leather processing, catalysts, surface treatments, wood preservation and refractories bricks. Its use in alloys enhances the metal resistance to impact, corrosion and
![Figure 1.2 - Arsenic Pourbaix diagram ([As] = 0.013 mM).](https://thumb-eu.123doks.com/thumbv2/123dok_br/18908140.936046/54.748.171.538.99.430/figure-arsenic-pourbaix-diagram-as-mm.webp)
![Figure 1.3 - Chromium Pourbaix diagram ([Cr] = 0.02 mM).](https://thumb-eu.123doks.com/thumbv2/123dok_br/18908140.936046/55.748.209.581.101.433/figure-chromium-pourbaix-diagram-cr-mm.webp)