Published by Canadian Center of Science and Education
Market Timing and Selectivity: An Empirical Investigation of
European Mutual Fund Performance
Luís Oliveira1, Tomás Salen2, José Dias Curto1 & Nuno Ferreira1 1 ISCTE-IUL Business School and BRU-Business Research Unit, Lisbon, Portugal 2 ISCTE-IUL Business School, Lisbon, Portugal
Correspondence: Luís Oliveira, ISCTE Business School, Complexo INDEG/ISCTE, Av. Forças Armadas, 1649-026 Lisboa, Portugal. Tel: 351-217-903-000. E-mail: [email protected]
Received: November 21, 2018 Accepted: December 11, 2018 Online Published: December 30, 2018 doi:10.5539/ijef.v11n2p1 URL: https://doi.org/10.5539/ijef.v11n2p1
Abstract
Using the models proposed by (Treynor & Mazuy, 1966; Henriksson & Merton, 1981), the present study examines the selection and timing abilities of mutual fund managers to denote the practice of these strategies as a means to achieve superior performance. For the 163 European equity mutual funds that followed active management strategies between January 2000 and December 2016, there was no evidence that fund managers used market timing abilities to anticipate the market movements. However, the selectivity component of returns presents slightly positive results, despite the poor overall performance.
Keywords: mutual funds, performance evaluation, selectivity, market timing, European funds 1. Introduction
Traditional finance assumes that market agents possess homogeneous beliefs and that their actions on financial markets reflect them. However, we can observe that several fund managers have the capacity to achieve continuously superior returns when compared to the stock market. This topic has been the subject of many studies and debates, particularly in the 1980s and 1990s. This question is of great significance because a portion of the rate of return generated by the funds is paid annually to fund managers as management fees. Therefore, the main goal of the present study is to examine if European mutual fund managers denote market timing abilities in their strategies as a means to achieve superior performance.
The work of (Jensen, 1968) regarding mutual fund performance evaluation is pioneering. Whereas Jensen‘s model consists of a single factor equation, several developments of this measure have been proposed to capture distinct factors that influence the fund managers‘ performance. These models aim to study two specific components of fund returns. The selection of the best assets with a similar risk profile (selectivity) is as important as the predictive power of market fluctuations and the resulting allocation of investments between different risk segments (market timing), i.e., the stock market and the risk-free market. Superior performance can be achieved if managers develop both selectivity and market anticipation strategies. Some authors evaluate their separate contributions through non-parametric tests, but we focused on the parametric tests of (Henriksson & Merton, 1981; Treynor & Mazuy, 1966) because they are based on publicly available information and do not rely on the knowledge of the fund managers‘ market forecasts.
To conduct this study, we retrieved a large sample of European mutual fund data from the Bloomberg database comprising the returns of 163 mutual funds from 2000 to 2016. Considering the effects of the financial crisis of 2007, which are still being felt in Europe, we split the sample into two distinct subsets, the pre-crisis period from January 2000 to July 2007 and the financial crisis period from August 2007 to December 2016.
Our research contributes to the literature in two main innovations: foremost, many studies focus on the US stock market, the performance of European fund managers has not been thoroughly examined. Thus, our work aims to be a world geographical reference. The great financial crisis of 2007 and the consequent European sovereign debt crisis are clear time frames with a sizable effect on stock market volatility and, if fund managers possess market timing ability, they could obtain profits and achieve higher returns. By splitting the sample into these subsets, we can determine if the return dynamics differ over time considering selectivity and market timing skills.
The main findings of our work indicate that European fund managers lack market timing capacities and the coefficients‘ estimates negatively affect the selectivity component of the performance measured using single factor models. The selectivity and market timing components of returns also show a strong negative correlation with each other, which indicates that a mutual fund manager tends to focus on a particular skill from time to time. Both findings are in agreement with several previous studies in this field such as (Treynor & Mazuy, 1966; Henriksson, 1984; Chang & Lewellen, 1984; Fletcher, 1995; Fung, Xu, & Yau, 2002).
The remainder of this paper is organized as follows. Section 2 presents a brief literature review. We describe the methodology in Section 3 and the data sample is characterized in Section 4. Section 5 presents the empirical results of the mutual fund managers‘ performance and Section 6 presents robustness tests. The final section presents the conclusions.
2. Literature Review
The work of (Jensen, 1968) and the proposed model can be considered the main reference in terms of performance evaluation. The model captures the excess return generated by the portfolio through the fund managers' predictive ability. In his study, which examined the performance of 115 actively managed mutual funds from 1944 to 1964, the author did not find evidence that mutual fund managers outperformed the market. Despite the results, Jensen‘s work had the capacity to motivate further studies on this subject including those of (Black, Jensen, & Scholes, 1972) and (Blume & Friend, 1973).
(Grinblatt & Titman, 1989b) used the (Jensen, 1968) model to measure the performance of equity mutual funds from 1974 to 1984. A distinctive quality of their work is that gross returns were approximated through their quarterly portfolio holdings. Although they found abnormal performance, particularly among the funds with the smallest net assets, these funds had the highest expenses, which undermined their superior performance.
Despite the widespread use of the (Jensen, 1968) measure, several authors began to question its capacity to properly evaluate mutual fund performance. One of the major issues highlighted was that the model did not distinctively capture the managers‘ ability to suitably select undervalued assets and their capability to interpret market movements and act on their forecast (Note 1). The distinction between these two measures of performance was outlined by (Jensen, 1972). He demonstrated that if the market timing activities of fund managers contribute to the returns, the (Jensen, 1968) equation may be biased (Note 2).
Fama (1972) developed a theoretical model in which he allowed for separate measurement of the selectivity and market timing components of fund returns. However, his model is difficult to apply because it requires information that is not readily available: time series of the projections for the target risk level for the fund and the fund managers‘ expectations of market movements and market allocation strategies.
In addition to the work of Fama (1972), other authors developed models that require only publicly available information to derive conclusions regarding the individual contributions of selectivity and market timing to fund returns. Treynor and Mazuy (1966) proposed a model to which they added a quadratic term to the (Jensen, 1968) equation, the square of the market risk premium, to capture the effects of market timing decisions. The analysis of 57 open-end funds in the US market between 1953 and 1962 revealed no evidence that managers had been able to beat the market through their forecasts. Using the Pfleiderer and Bhattacharya (1983) model, Lee and Rahman (1990) found evidence of positive and significant market timing capacities from US mutual fund managers from 1977 to 1984. Notably, although this measure is similar to that of Treynor and Mazuy (1966), the market timing activity is constrained to be non-negative.
Following on the work of (Treynor & Mazuy, 1966; Merton, 1981; Henriksson & Merton, 1981) proposed a similar model to individually assess the contributions of selectivity and market timing. However, instead of a quadratic term, their model incorporates a dummy variable that aims to capture the market timing skill of fund managers when the managers predict that the stock market will outperform the bond market and when they forecast that the bond market will provide better returns than the stock market. Based on their landmark study, (Henriksson, 1984) examined the returns and performance of 116 US mutual funds between 1968 and 1980 and found no evidence that fund managers had taken advantage of market timing strategies. However, the results showed that, for most of the funds in the study, attempts to predict the market had negative effects on the performance of the portfolios under management. Applying the same methodology, (Chang & Lewellen, 1984) evaluated the performance of 67 US mutual funds from 1971 to 1979 and reached similar conclusions as those of Henriksson.
Several authors have examined the performance of mutual funds in other markets. Using the methodologies proposed by (Henriksson & Merton, 1981; Treynor & Mazuy, 1966; Philippas, 2002) found no evidence of
market timing abilities and even generated statistically significant negative estimations for the parameter disclosing this skill in the Greek mutual fund market. (Tripathy, 2005) also used both models to empirically assess the performance of Indian mutual funds and did not find that managers were engaged in market timing strategies.
Romacho and Cortez (2006) studied the selectivity and market timing skills of managers in the Portuguese market using a sample of 21 mutual funds from 1996 to 2001. To better assess the consistency of their results, the authors used two models to test the return components:a nonparametric model proposed by (Merton, 1981) and a parametric model similar to that used by (Henriksson, 1984). Based on the empirical results, the authors could not conclude that fund managers exhibited selectivity or market timing capabilities. They also found a negative market timing coefficient regarding domestic portfolios.
Other investment vehicles than mutual funds have been studied, including hedge funds. Hedge funds possess distinct characteristics from mutual funds as they are subject to a lower level of regulation than mutual funds, can invest in a wider range of securities and incur higher leverage levels. They are also less liquid than mutual funds because most of them have a ―lockup period‖ during which they aim to generate returns and investors cannot redeem their investment.
Fung, Xu, and Yau (2002) studied a sample of 115 hedge funds from 1994 to 2000. The authors reached considerable conclusions, which highlighted the reduced capacity of managers of such funds to develop market timing strategies, despite exhibiting excellent selectivity capabilities. They also showed that larger funds gained higher returns, which appeared to indicate that they could be benefiting from economies of scale. However, these findings are contradictory to the work of (Grinblatt & Titman, 1989b).
Using both the (Henriksson & Merton, 1981) and the (Treynor & Mazuy, 1966) models, (Klein, Purdy, Schweigert, & Vedrashko, 2015) examined a sample of 198 Canadian hedge funds from 1998 to 2011. Their work was supported by the idea that Canadian hedge fund managers are conscious and have sufficient knowledge regarding commodity markets because Canada‘s economy is highly dependent on energy sources. They examined the capacity of managers to forecast movements of the commodity index and generated positive estimates for this parameter. However, most of the fund managers displayed negative market timing skill. (Borri & Cagnazzo, 2018) show that simple buy‐and‐hold strategies over‐perform market‐timing strategies effectively used by Italian investors in equity mutual funds. Furthermore, in all the markets considered, buy‐ and‐hold over‐performs market‐timing with extra returns that go from 0.24 per cent per quarter (Europe and euro area) to 0.87 per cent per quarter (US market). These differences are not explained by differences in risk and risk exposure.
Studies using more robust and sophisticated models have been developed to test market timing abilities. To evaluate the market timing capacity of fund managers, (Friesen & Sapp, 2007) measured the performance of 7,125 US mutual funds from 1991 to 2004 using the (Fama & French, 1993) three-factor model and the model proposed by (Carhart, 1997), which extends the (Fama & French, 1993) model to four factors. The findings revealed lower performance when the managers tried to develop market timing strategies against the possible performance they would obtain if they followed a passive portfolio management strategy. The authors quantified that market timing decisions generally reduced the annual rate of return by approximately 1.56%. More recently, (He, Cao, & Baker, 2015) applied the four-factor model to examine the performance of 170 actively managed Chinese open-end stock mutual funds from 2001 to 2011. Using the (Jensen, 1968), (Henriksson & Merton, 1981) and (Treynor & Mazuy, 1966) equations, they found increased evidence of negative estimates for the market timing parameter although most of the funds did not display a statistically significant estimate for this coefficient. (Leite & Cortez, 2015) studied the performance and performance persistence of French Socially Responsible Investment (SRI) funds during market crises. Using a multi-factor model approach, they found that the differences in their performance compared with their peers were anchored in the market conditions. During non-crisis periods, differences in the managerial abilities of the French SRI fund managers and that of their peers is not statistically significant. However, during crisis periods, French SRI funds present worse stock selection capacities and a significantly better ability to time the market.
In a perspective of academic literature research published on mutual fund performance in the US and UK, (Cuthbertson, Nitzsche, & O‘Sullivan, 2010a) found little evidence suggesting successful market timing abilities. In terms of after fees, the authors noted that a maximum of 5% of top performing UK and US equity mutual funds with positive-alpha performance, and around 20% of funds that have poor alpha performance. 75% of active funds are effectively zero-alpha funds. Moreover, the authors reinforced a strong advice for the investors to hold low cost index funds and avoid holding past ‗active‘ loser funds.
Non-parametric models have also been used to test for evidence of market timing skills. For this type of test, it is essential to know the managers‘ forecast ability or to have a reliable approximation of them. (Cuthbertson, Nitzsche, & O'Sullivan, 2010b) used a non-parametric test to study the behaviour of the returns obtained by UK equity and balanced mutual funds from January 1988 to December 2002 and concluded that fund managers were generally bad market timers. By examining the 1980-1999 US mutual fund market, (Jiang, 2003) also using a non-parametric approach found no evidence showing that fund managers enacted market timing strategies. Other studies have made significant contributions to the literature. (Bollen & Busse, 2001) measured the performance of 230 mutual funds using the models proposed by (Henriksson & Merton, 1981; Treynor & Mazuy, 1966). Using monthly and daily data, the authors found evidence of the market timing abilities of fund managers, which was higher in shorter periods of analysis. Subsequently, (Bollen & Busse, 2004) evaluated the returns of mutual funds in shorter periods. Their findings indicate that there was evidence of abnormal performance in shorter periods of time and that it is elapsed in longer time frames. They concluded that if a fund exhibits high returns, it generates an inflow of cash that may pose an investment challenge to achieve similar rates of return. This indicates that the dynamics associated with the investor cash flows can interfere with mutual fund performance.
Another approach has been to incorporate publicly available information. (Ferson & Shadt, 1996) labelled these models as conditional models of evaluation. Studying a sample of 67 mutual funds from 1968 to 1990, they found evidence that fund managers alter their portfolio risk levels in response to publicly available information. Controlling for public information suggested that the fund manager‘s selectivity abilities are centred on zero and they did not find evidence of negative market timing skills, as in most studies in the field.
To show whether it is possible to perform well by doing good, (Cortez, Silva, & Areal, 2012) investigate the style and performance of US and European socially responsible funds that invest in the global market. With respect of investment style, the authors found evidence that this kind of funds are strongly exposed to small cap and growth stocks. Additionally, their results pointed a significant home bias implying that investors in these funds may not fully benefit from the diversification that could potentially arise from a truly global investing. One issue that has been addressed in this line of research has been the choice of benchmark. Using the (Henriksson & Merton, 1981) and the (Chen & Stockum, 1986) (Note 3) models to study a sample of 101 UK unit trusts, (Fletcher, 1995) concluded that fund managers exhibited negative market timing skills despite being good stock pickers. However, although the general findings did not alter due to the choice of benchmark, the results were slightly different depending on the portfolio against which the funds‘ returns were evaluated. (Dellva, DeMaskey, & Smith, 2001) measured the performance of sector funds because many investors were using them as an investment vehicle. The author intended to verify if the market timing skill of sector fund managers could be captured through general market benchmarks and stated that, although the market timing estimate was negative for most funds irrespective of the benchmark, the selectivity estimates were positively affected by benchmarks that were more closely related to the fund‘s strategy. These results could be related with the findings of (Klein et al., 2015).
More recently (Tchamyou, Asongu, & Nwachukwu, 2018) investigate the effects of information asymmetry (between the realized return and the expected return) on market timing in the mutual fund industry. They found that equity funds with lower market risk exposure are catching-up with their counterparts with higher exposure to fluctuation in market conditions. (Liao, Zhang, & Zhang, 2018) examine Chinese mutual fund managers' abilities to time the market, market volatility, and market-wide liquidity. Using a sample of Chinese mutual funds, they employ both cross-sectional and bootstrap analyses and find strong evidence that, during 2001-2011, Chinese mutual fund managers demonstrated the ability to time market returns, volatility, and market liquidity. They also find top timers outperform bottom timers by 6–7% annually in out-of-sample tests, manifesting the practical meaning of timing ability.
As we have outlined, most studies reached the conclusion that in general fund managers exhibit negative market timing abilities. We analyse if European fund managers evidenced this skill from 2000 to 2016 and draw conclusions on the results.
3. Methodology
As in single-factor models, we estimated the risk-adjusted performance for each of the funds in the sample using a similar equation to that proposed by (Jensen, 1968, 1969),
Rp(t) – Rf(t)= αp+ βp x(t)+ εp(t) (1)
the rate of return separate from the systematic risk level, βp. The αp parameter captures the managers‘ contribution to the performance of the fund regarding asset selection ability, foresight and action on market fluctuations. The possibility of the fund manager to have a conscious action on the management of the βp parameter over time was not assessed individually. The variable x(t) is the risk premium of the passive portfolio calculated as the difference between the monthly rates of return of the market benchmark, Rm(t), and the risk-free rate, thus,
x(t)= [Rm(t) – Rf(t)]. εp (t) is the error term of the model for which the following characteristics shall be assumed:
E[εp(t)] = 0 E[εp(t)|x(t)] = 0
E[εp(t)|εp(t–i)] = 0, i = 1, 2, 3, …
Most the literature on the evaluation of the relative performance of mutual fund managers is based on models such as the one presented in equation 1, in which only one risk/return benchmark is considered. Due to its simplicity, this model has drawn positive interest in performance measurement. Although the single-factor model specified in Equation 1 has a reasonable capacity to isolate excess returns, given by αp (Note 4), it cannot capture the return component resulting from market timing strategies enacted by fund managers.
(Merton, 1981; Henriksson & Merton, 1981) developed a model that allows for the separate and simultaneous estimation of selectivity and market timing abilities exhibited by mutual fund managers. This model considers the managers‘ capacity to anticipate if the stock market will offer higher returns than the bond market [x(t)> 0] or vice-versa. Thus, the objective is to predict if the investment in the bond market will provide an equivalent return to that of the stock market [x(t)≤ 0] regardless of the magnitude of the differentials.
The authors showed that the sum of the conditional probabilities, P1(t) and P2(t), of an accurate prediction of the market in the next period is given by
P1(t) ≡ Prob [prediction x(t)≤ 0 | x(t)≤ 0] P2(t) ≡ Prob [prediction x(t)> 0 | x(t)> 0]
The sufficient condition for the managers‘ forecasting abilities to add value to the portfolio is P1(t) + P2(t)> 1. In this case, the manager follows a funding allocation strategy to the stock market and the risk-free market according to the following rule: if, at the end of the t-1 period, they expect that x(t)≤ 0, then a fraction η1 of the asset value under management is invested in the stock market and (1 η1) in the bond market; conversely, if the manager predicts that x(t)> 0, then they allocate a fraction η2 to the stock market and (1 η2) to the bond market. Thus, the variable that captures the effect of the management/decision skills of the portfolio manager is the systematic risk level, β(t), and η1 and η2 are the investment proportions in stocks depending on the evolution of the market, i.e., if the market is rising (bull market) or falling (bear market), respectively. Rationally, it is expected that η1 < η2 for the perfect market timer.
(Merton, 1981) showed that the return of an investment strategy based on perfect timing of the market is equivalent to the return from an investment strategy in which the manager allocates a percentage [P2 η2 + (1P2) η1] of the funds to the market portfolio and simultaneously acquires (P1+P21) (η2η1) "protective puts" on the market portfolio with an exercise price equal to the risk-free rate, Rf, and a premium of 0. The remainder of the asset value under management is invested in the bond market.
Based on this framework, (Henriksson & Merton, 1981) introduced the novel possibility of jointly estimating the asset selectivity and market timing capacities using the following parametric model:
Rp(t) – Rf(t)= αp+ β1p x(t)+β2p y(t)+ εp(t) (2)
In equation 2, is the excess return of the fund resulting from the security selection ability of the portfolio managers.
The market timing ability is captured by β2 and y(t) = max[0, Rf(t) Rm(t)] = max[0, x(t)]. For large samples of
many observations, the probability limits for the estimates of β1, β2 and α correspond to,
plim 𝛽̂1= P2 η2 + (1P2) η1
plim 𝛽̂2 = (P1+P21)(η2η1)
plim ̂ = 𝑅̅ 𝑅̅𝑓(𝑡)plim 𝛽̂1 𝑥̅plim 𝛽̂2 𝑦̅,
the plim 𝛽̂2 = (P1+P21) (η2η1), estimated via Ordinary Least Squares (OLS), appropriately measures the timing capacity of the portfolio manager: β2=0 if the manager did not show evidence of market timing abilities (P1+P2=1) or did not adjust the components related to the allocation of funds to the portfolio (η1=η2) according to
their forecast, for which the null hypothesis to be tested is defined by H0: β2=0. Thus, plim ̂= 𝑅̅ 𝑅̅𝑓(𝑡) plim 𝛽̂1 𝑥̅ plim 𝛽̂2 𝑦̅, allows for testing the security selection ability through the null hypothesis, defined as H0: α=0.
(Treynor & Mazuy, 1966) were the first authors to propose a model that captures market timing activity. The main difference between this model and that of (Merton, 1981; Henriksson & Merton, 1981) is that it tries to capture the effects of market timing decisions by adding a quadratic term to Jensen‘s equation. Equation 3 depicts the model specified by (Treynor & Mazuy, 1966),
Rp(t) – Rf(t)= αp+ β1p x(t)+β2p [x(t)]2+ εp(t) (3) if mutual fund managers can anticipate market movements, then they can hold a greater or lesser proportion of the market portfolio in their assets depending on the trend of the stock market. A positive and statistically significant estimation of the coefficient associated with the quadratic term (β2) indicates that the fund manager added value to the portfolio through development of a successful market timing strategy. The estimate for αp holds the same properties and is interpreted as in equation 2.
As noted by (Henriksson & Merton, 1981, p. 530), estimates for the coefficients derived using the OLS method are consistent because, for sufficiently large samples,
lim𝑁→∞[∑ 𝜀𝑝(𝑡)𝑁 ] = 0
However, considering the non-stationarity of the residuals associated with equations 1, 2 and 3, the OLS procedure is inefficient due to the potential presence of heteroscedasticity; the standard deviation of the estimation error (εp) is an increasing function of the independent variables, |x(t)|. To detect the presence of heteroscedasticity and first-order autocorrelation of the errors, we used the test proposed by (White, 1980) and the Lagrange multiplier of (Breusch, 1978) – (Godfrey, 1978), respectively. Although we do not report the results of the tests, they showed evidence that residuals are mostly heteroscedastic and autocorrelated, a problem that generates an efficiency loss in the OLS estimators, which could undermine the value of the statistical inferences reached. Therefore, we use the procedures proposed by (Newey & West, 1987) to correct any autocorrelation and/or heteroscedasticity problems that arise in the residual of the regressions.
4. Data
The sample of funds used in this study was obtained from the Bloomberg database, which provides monthly net asset values (NAV), in euros, for the participation units of many mutual funds domiciled in Europe from 2000 to 2016. We did not consider the funds that disappeared or were merged/integrated into other funds. Thus, our sample only considers the funds with uninterrupted end-of-the-month NAV between December 1999 and December 2016 to derive monthly rates of return for every month from 2000-2016, resulting in 204 monthly rates of return.
There may be multiple investment classes that present the same characteristics and are managed by the same fund managers within the same mutual fund and we removed these classes from the sample to avoid possible biases due to the calculation of multiple returns that refer to the same background. We kept only the main asset class (typically the asset class with an average asset value under the management of at least 80% of the total asset value of the fund). The sample comprised 163 actively managed open-end mutual funds classified according to the following asset classes: value (13), growth (78) and mixed blend (72) funds, according to the (Fama & French, 1992, 1993) Book-to-Market (BtM) classification. Considering the fund‘s strategy regarding the company size target, the sample was divided into small (44), mid (24) and large (95) funds. The Morningstar size classification was used. At the end of December 2016, the net asset value (NAV) of the funds in the sample was 77.1 billion euros. The regional extent of the investment policies for the selected funds was the grand Europe.
We excluded closed-end mutual funds, funds of funds, and funds that focus on index trading from our sample. Because only actively managed open-end mutual funds were considered, our sample allows for consistent examination of the economical and statistical significance of the selectivity and market timing abilities exhibited by fund managers.
After applying the described filters, on 31st of December of 2016, our sample covered 65% of the funds with similar characteristics available in the Bloomberg database and 49% of the net asset value under management. Growth funds were more represented in terms of the number of funds in the sample, 74%, and value funds represented 58%. Considering the fund‘s strategy for target company size, we found that small and mid-cap funds are more relevant in the sample, they represent 59% and 100%, respectively, of the funds in the sample. The sample stratification is detailed in Table 1a.
Table 1a. Investment style and size sample stratification
Total Value Blend Growth Small Mid Large
Number of funds 163 13 72 78 44 24 95
% of the sample 65% 62% 57% 74% 60% 100% 61%
NAV (106 €) 77,119 2,369 39,774 34,977 13,069 17,089 46,961
% of the sample 49% 33% 45% 58% 59% 100% 40%
Age (years) 23 28 23 22 20 21 24
NAV refers to the net asset value of the funds considered in the sample after applying the filters to the Bloomberg data. The percentage in relation to the sample (% of the sample) refers to the weight of the funds with the outlined characteristics in relation to the filtered Bloomberg data. Age is the number of years that the funds have been active.
The average age of the funds included in the sample is 23 years, ranging from 17 to 60. Half of the funds in the sample had been active for more than 20 years. Value and large-cap funds are amongst the oldest funds. The NAV and the number of funds at the end of 2016 that have the outlined attributes are reported in Table 1b.
Table 1b. Cross size and style sample stratification
Value Blend Growth
Number 2 11 31 Small NAV (106 EUR) 50 3,345 9,675 Number 1 7 16 Mid NAV (106 EUR) 865 5,748 10,476 Number 10 54 31 Large NAV (106 EUR) 1,454 30,681 14,826
For the Value/Mid-Small cross strategies, our sample includes only 3 funds. Growth/Mid-Small categories have 47 funds and the most representative cross strategy in the sample is the Large/Blend, which comprised 54 funds. The second-most represented categories are the Growth/Large and the Growth/Small strategies, with 31 funds each in the filtered sample.
After obtaining the monthly net value of the participation units of each fund using the Bloomberg‘s data, we calculated the respective returns. To use gross rates of return, we calculated the monthly logarithmic differences of the NAV of the participation units added to one-twelfth of the annual expenditure incurred by the funds (Note 5)
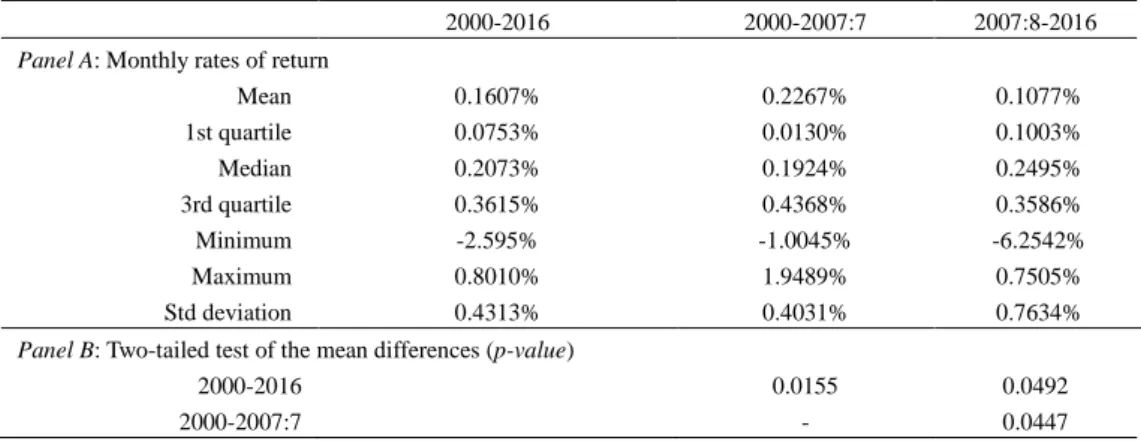
After the international financial crisis in the United States and Great Britain in mid-2007, we observed the proliferation of its effects on other European markets. With the start of the sovereign debt crisis, financial markets experienced a period with a high level of uncertainty that, given the volatility levels, reflects distinct investment conditions than in previous periods. Therefore, we split the observation period into two subsets: the pre-crisis period from January 2000 to July 2007 and the international economic and financial crisis period after August 2007. Panel A of Table 2 illustrates the monthly average rates of return for the entire observation period and for the two subsets in the sample.
Table 2. Monthly average rates of return
2000-2016 2000-2007:7 2007:8-2016
Panel A: Monthly rates of return
Mean 0.1607% 0.2267% 0.1077% 1st quartile 0.0753% 0.0130% 0.1003% Median 0.2073% 0.1924% 0.2495% 3rd quartile 0.3615% 0.4368% 0.3586% Minimum -2.595% -1.0045% -6.2542% Maximum 0.8010% 1.9489% 0.7505% Std deviation 0.4313% 0.4031% 0.7634%
Panel B: Two-tailed test of the mean differences (p-value)
2000-2016 0.0155 0.0492
Panel A depicts the distribution of the monthly average rates of return from 2000 to 2016 and for each subset examined: the pre-crisis period from January 2000 to July 2007 (2000-2007:7) and the financial crisis period after August 2007 (2007:8-2016). Panel B outlinesthe p-values of the mean differences between the monthly average rates of return considered for each period, assuming unequal variances. The null hypothesis considers that the mean difference in each period is 0.
Because the rates of government bonds are specific for each European country and the concept of riskless rate is not ensured, we use the one-month Euribor rate as a proxy of a theoretical risk-free rate. The one-month Euribor rate observed at the end of each month was transformed into a discount factor, B0.For consistency in the calculation of the monthly returns of the funds and the market portfolio, the monthly ―risk-free‖ interest rate was derived from the logarithmic differences between the monthly discount factors such that
Rf(t) = lnB0 (t) – lnB0 (t–1) (4) 5. Results
In this section, we report the risk-adjusted performance evidenced by European investment funds from January 2000 to December 2016. Foremost, the model specified in equation 1 enables estimation of the performance of the mutual fund managers of the sample, assuming the absence of market timing activity. Then, we examine the effects of the market timing decisions of mutual fund managers by isolating the selectivity and market timing components of the performance of the funds using the model proposed by (Henriksson & Merton, 1981), as described in equation 2. We measured the separate contributions of the selectivity capabilities and market timing skill of mutual fund managers using the (Treynor & Mazuy, 1966) model, as described in equation 3.
5.1 Performance Assuming the Absence of Market Timing Activity
As noted in previous studies, if we ignore that managers exhibit market timing skills, the estimates obtained for the
α coefficient generally tend to be negative and statistically significant for the entire sample period and the financial
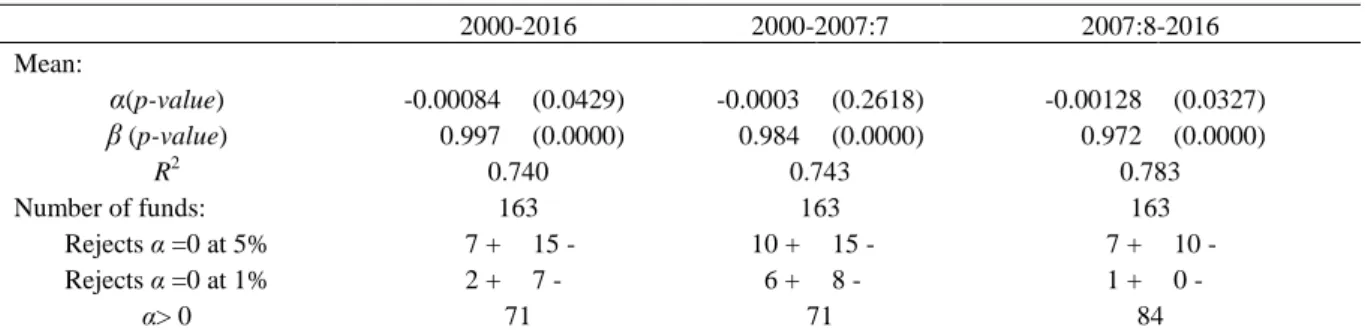
crisis period. Table 3 displays the regression statistics obtained by estimating equation 1.
Table 3. Results assuming the absence of market timing activity
2000-2016 2000-2007:7 2007:8-2016 Mean: α(p-value) -0.00084 (0.0429) -0.0003 (0.2618) -0.00128 (0.0327) β (p-value) 0.997 (0.0000) 0.984 (0.0000) 0.972 (0.0000) R2 0.740 0.743 0.783 Number of funds: 163 163 163 Rejects α =0 at 5% 7 + 15 - 10 + 15 - 7 + 10 - Rejects α =0 at 1% 2 + 7 - 6 + 8 - 1 + 0 - α> 0 71 71 84
Table 3 presents estimates for the coefficients of the model specified in equation 1, for the entire sample period from 2000 to 2016 and for each subset examined: the pre-crisis period from January 2000 to July 2007 (2000-2007:7) and the financial crisis period after August 2007 (2007:8-2016). Rows 5 and 6 indicate the number of estimated coefficients that present a positive or negative sign and for which it was possible to reject the null hypothesis. For example, 7 funds presented a positive estimate for theα parameter from 2000 to 2016, which was statistically significant with a confidence level of 95% or higher. The last row presents the number of funds with α > 0 in comparison with the total number of funds. The p-value refers to the statistical significance of the mean values.
In the pre-crisis period, the mean α is not significantly different from zero. For the period from 2000 to 2016, 71 of 163 funds present a positive selectivity ability. However, it should be noted that the estimate of α > 0 is statistically significant at the 5% level for only 7 of these funds. Surprisingly, the performance of mutual fund managers was better in the crisis period, in which 84 funds displayed a positive α estimate, 7 of which are statistically significant at the 5% level (this decreases to 1 if we consider a 1% significance level). Before August 2007, 10 funds displayed a positive and statistically significant selectivity estimate at a 5% significance level but, in this period, only 71 had positive alphas.
Considering the entire sample period, the results are in agreement with those presented by several authors including (Henriksson, 1984; Romacho & Cortez, 2006; Ferreira et al., 2013) (Note 6), which have also reported low performance estimates for different markets and time periods. In summary, the estimates found for the α parameter from 2000 to 2016 appear to suggest that European mutual fund managers showed poor performance in terms of their security selection ability.
5.2 Performance Assuming the Presence of Selectivity and Market Timing Activity Using the (Henriksson & Merton, 1981) Model
As described in Section 3, (Henriksson & Merton, 1981) developed an alternative model to that proposed by (Jensen, 1968) for measuring the performance of mutual funds. This model is specified in equation 2 and, although similar, allows for decomposition between the selectivity ability, α, and the market timing capacity, β2.
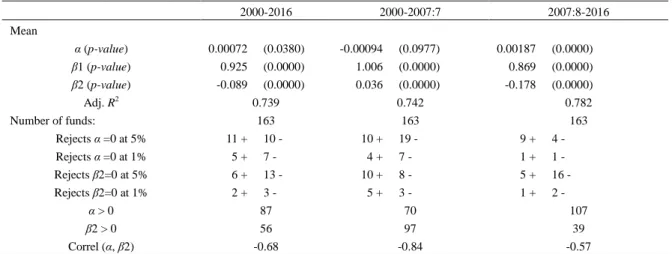
Table 4 summarizes the resulting coefficients estimated using equation 2. Comparing the results presented in Table 4 with the results of equation 1, we can observe that the selectivity ability measured by the α parameter estimate is generally slightly higher, which suggests that the ability to time the market was the main reason for the poor performance. If fund managers are generally poor market timers, equation 1 will tend to underestimate the return component influenced by the selection of undervalued assets, which shall be considered solely responsible for the negative performance. Therefore, by allowing the breakdown of the excess return into two components, equation 2 is more appropriate for evaluating the selectivity ability of mutual fund managers.
Table 4. Results assuming the presence of selectivity and market timing activity using the (Henriksson & Merton, 1981) model 2000-2016 2000-2007:7 2007:8-2016 Mean α (p-value) 0.00072 (0.0380) -0.00094 (0.0977) 0.00187 (0.0000) β1 (p-value) 0.925 (0.0000) 1.006 (0.0000) 0.869 (0.0000) β2 (p-value) -0.089 (0.0000) 0.036 (0.0000) -0.178 (0.0000) Adj. R2 0.739 0.742 0.782 Number of funds: 163 163 163 Rejects α =0 at 5% 11 + 10 - 10 + 19 - 9 + 4 - Rejects α =0 at 1% 5 + 7 - 4 + 7 - 1 + 1 - Rejects β2=0 at 5% 6 + 13 - 10 + 8 - 5 + 16 - Rejects β2=0 at 1% 2 + 3 - 5 + 3 - 1 + 2 - α > 0 87 70 107 β2 > 0 56 97 39 Correl (α, β2) -0.68 -0.84 -0.57
Table 4 presents estimates of the coefficients of the model specified in equation 2 for the entire sample period from 2000 to 2016 and for each subset examined: the pre-crisis period from January 2000 to July 2007 (2000-2007:7) and the financial crisis period after August 2007 (2007:8-2016). Rows 6 to 9 indicate the number of estimated coefficients that present a positive or negative sign and for which it was possible to reject the null hypothesis. For example, 11 funds presented a positive estimate for the α parameter from 2000 to 2016, which was statistically significant with a confidence level of 95% or higher. The last two rows present the number of funds with α > 0 and β2> 0. The
p-value refers to the statistical significance of the mean values.
The estimation results of equation 2 show that mutual fund managers generally lack the capacity to anticipate market movements. We found that 107 funds (65%) present negative market timing estimates and, from those that exhibit a positive estimate for β2, only 6 funds had a 5% significance level (this decreases to 2 if we consider a 1% significance level). However, it should be noted that, in the pre-crisis period, the number of funds with β2> 0 increased to 97, 10 that reject the null hypothesis with a 5% significance level. In this period, the number of funds with β2> 0 is more than the number of funds with β2< 0. In the crisis period, the number of funds with managers that demonstrated market timing abilities decreased to 39 and, among these, only 5 show statistical significance at the 5% level. This suggests that fund managers had an increased focus on achieving positive alphas than in anticipating market movements in this period.
In the financial crisis period, the effect of the selectivity component on the performance of the funds was the highest because 107 funds had a positive value for the α coefficient and this parameter generally holds a positive and statistically significant value of approximately 0.187% per month. However, only 9 funds present a positive and statistically significant (with a 5% significance level) estimate for α. None of the 5 funds with estimates of a positive β2 with a significance level of 5% achieved a positive performance in the financial crisis period.
The correlation between the α and β2 coefficients is negative for the entire sample period, as in the two subsets. From 2000 to 2016, of the 87 funds that reached a positive estimate for the α coefficient, 80 exhibited a negative estimate for the β2 coefficient and 49 of the 76 funds with negative estimates for the α coefficient had positive
estimates for β2. For the subset from January 2000 to July 2007, amongst the 70 funds that presented a positive estimate for the α parameter, 21 had a positive estimate for the β2 parameter and amongst the 93 funds with a negative estimate for α, 76 presented a positive β2. For the subset from August 2007 to December 2016, amongst the 107 funds with a positive estimate for the coefficient α, only 5 had a positive estimate for β2 and amongst the 56 funds with a negative estimate for α, there were 22 positive estimates for β2.
In summary, the results reported in Table 4 suggest that the performance of managers is generally poor. In the pre-crisis period, mutual fund managers appeared to have a better ability to predict market movements and in the financial crisis period managers revealed better security selection skills. The negative correlation between α and β2 estimates may suggest that the forecast of market movements was the primary driver of the poor performance exhibited.
5.3 Performance Assuming the Presence of Selectivity and Market Timing Activity Using the (Treynor & Mazuy, 1966) Model
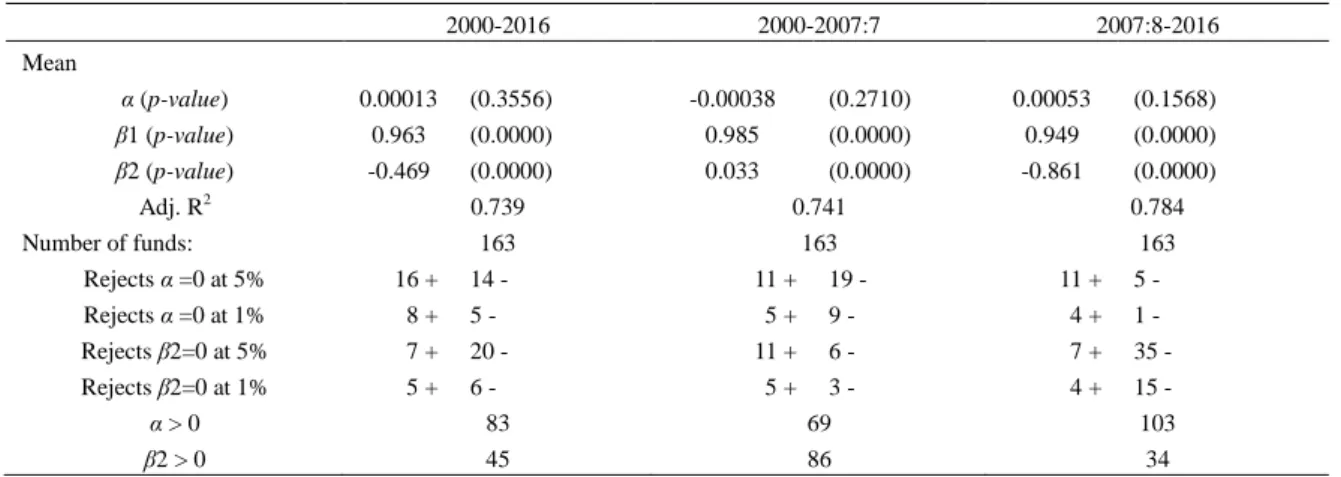
(Treynor & Mazuy, 1966) proposed a model that extends the model developed by (Jensen, 1968) by adding a quadratic term to measure the contribution of market timing strategies developed by mutual fund managers. The results obtained through estimation of the (Treynor & Mazuy, 1966) equation appear to reinforce the idea that mutual fund managers lack selectivity and market timing skills. Table 5 reports the results for the estimates for the parameters of equation 3.
Table 5. Performance assuming the presence of selectivity and market timing activity using the (Treynor & Mazuy, 1966) model 2000-2016 2000-2007:7 2007:8-2016 Mean α (p-value) 0.00013 (0.3556) -0.00038 (0.2710) 0.00053 (0.1568) β1 (p-value) 0.963 (0.0000) 0.985 (0.0000) 0.949 (0.0000) β2 (p-value) -0.469 (0.0000) 0.033 (0.0000) -0.861 (0.0000) Adj. R2 0.739 0.741 0.784 Number of funds: 163 163 163 Rejects α =0 at 5% 16 + 14 - 11 + 19 - 11 + 5 - Rejects α =0 at 1% 8 + 5 - 5 + 9 - 4 + 1 - Rejects β2=0 at 5% 7 + 20 - 11 + 6 - 7 + 35 - Rejects β2=0 at 1% 5 + 6 - 5 + 3 - 4 + 15 - α > 0 83 69 103 β2 > 0 45 86 34
Table 5 presents estimates of the coefficients of the model specified in equation 3 for the entire sample period from 2000 to 2016 and for each subset examined: the pre-crisis period from January 2000 to July 2007 (2000-2007:7) and the financial crisis period after August 2007 (2007:8-2016). Rows 6 to 9 indicate the number of estimated coefficients that present a positive or negative sign and for which it was possible to reject the null hypothesis. For example, 16 funds presented a positive estimate for the α parameter from 2000 to 2016, which was statistically significant with a confidence level of 95% or higher. The last two rows present the number of funds withα > 0 and β2> 0. The
p-value refers to the statistical significance of the mean values.
From January 2000 to December 2016, 83 funds displayed positive selectivity, 16 of which were statistically significant at a 5% significance level. The expectation that mutual fund managers were more successful in selection of undervalued assets in the crisis period (103 funds displayed a positive α estimate) than in the pre-crisis period (69 funds had a positive α estimate) was confirmed, regardless of whether the number of funds with a statistically significant and positive α parameter were equal between the two periods. In the pre-crisis period, 19 funds had statistically significant negative alphas compared with only 5 funds in the crisis period. Regarding the ability to predict market movements, the results are very similar to those obtained using the (Henriksson & Merton, 1981) model. Of the 163 funds in the sample, only 45 present a positive estimate for β2; more funds (86) in the pre-crisis period than in the crisis period (34). These results confirm that it is more difficult to predict the market in times of higher uncertainty and suggest that managers are more concerned with achieving higher performance at the selectivity level.
6. Robustness Tests
qualitatively confirm the absence of market timing strategies enacted for most of the 193 European mutual funds from January 2000 to December 2012. We conducted this test by examining the consistency of the results in our study using a model that checks the impact of an additional factor in the (Henriksson & Merton, 1981) model. The results may incorporate errors arising from the process that generates rates of return—through equations 2 and 3—and present specification issues. Thus, it is likely that we omitted relevant factors in this process. If we could identify these factors and incorporate them into the models, we expect the possible bias of our estimates to decrease.
(Henriksson, 1984) suggested the use of a multifactor model that consists of adding a variable to equation 2. This variable would allow for testing the influence of the omission of a relevant factor in the results on the influence of the market factor. Thus, we constructed a factor representing the risk premium of a theoretical portfolio consisting of the aggregation of all funds in the sample. The factor added to equation 2, w(t), is defined by,
w(t)= zew(t) – βew x(t) (5)
where zew(t) is the risk premium of the theoretical portfolio consisting of an equally weighted representation of
the 163 funds for the t period and βew is the estimate of the coefficient associated with the market risk premium,
obtained via OLS using the following regression,
zew(t)= αew + βew x(t) + ϵew (t) (6)
The estimates for the coefficients of equation 6, αew and βew, are summarized in Table 6. As defined in equation 5,
w(t) is used as a proxy of the relevant factor(s) that are possibly omitted in the (Henriksson & Merton, 1981)
model. The regression specification used for the ‗omission test of relevant factor(s)‘ using a multiple-factor model was:
Rp(t) – Rf(t)= αp + β1p x(t) + β2p y(t) + γ1p w(t) + γ2p v(t) + εp(t) (7)
where v(t) = max[0, w(t)]. Specification of equation 7 allows for identification of the presence of market timing
strategies associated with the common factor (γ2) or the market portfolio (β2).
Table 6. Results of estimation of the parameters of equation 6
2000-2016 2000-2007:7 2007:8-2016
αew -0.00084 -0.00030 -0.00127
p-value 0.5392 0.8626 0.5341
βew 0.9771 0.9842 0.9715
p-value 0.0000 0.0000 0.0000
This table illustrates the estimates for the coefficients of equation 6 for the entire sample period from 2000 to 2016 and for each subset examined: the pre-crisis period from January 2000 to July 2007 (2000-2007:7) and the financial crisis period after August 2007 (2007:8-2016).
The estimation results of equation 7 are reported in Table 7. The common factor appears to be an important driver to explain the returns of most of the funds in the sample for the entire sample period and for both subsets.
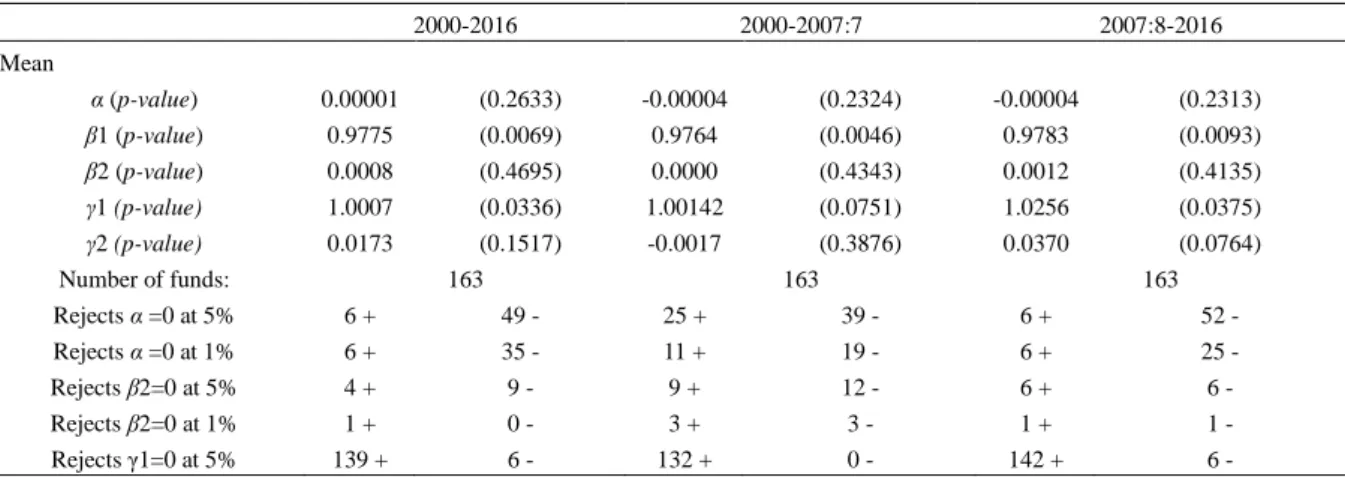
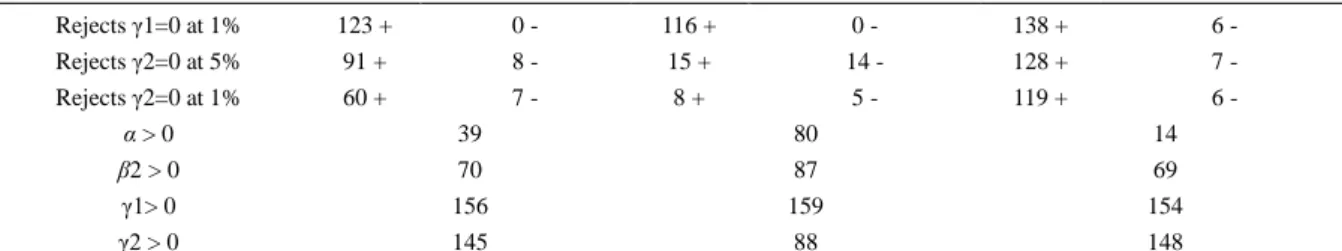
Table 7. Performance assuming the presence of selectivity and market timing activity using a multifactor model
2000-2016 2000-2007:7 2007:8-2016 Mean α (p-value) 0.00001 (0.2633) -0.00004 (0.2324) -0.00004 (0.2313) β1 (p-value) 0.9775 (0.0069) 0.9764 (0.0046) 0.9783 (0.0093) β2 (p-value) 0.0008 (0.4695) 0.0000 (0.4343) 0.0012 (0.4135) γ1 (p-value) 1.0007 (0.0336) 1.00142 (0.0751) 1.0256 (0.0375) γ2 (p-value) 0.0173 (0.1517) -0.0017 (0.3876) 0.0370 (0.0764) Number of funds: 163 163 163 Rejects α =0 at 5% 6 + 49 - 25 + 39 - 6 + 52 - Rejects α =0 at 1% 6 + 35 - 11 + 19 - 6 + 25 - Rejects β2=0 at 5% 4 + 9 - 9 + 12 - 6 + 6 - Rejects β2=0 at 1% 1 + 0 - 3 + 3 - 1 + 1 - Rejects γ1=0 at 5% 139 + 6 - 132 + 0 - 142 + 6 -
Rejects γ1=0 at 1% 123 + 0 - 116 + 0 - 138 + 6 - Rejects γ2=0 at 5% 91 + 8 - 15 + 14 - 128 + 7 - Rejects γ2=0 at 1% 60 + 7 - 8 + 5 - 119 + 6 - α > 0 39 80 14 β2 > 0 70 87 69 γ1> 0 156 159 154 γ2 > 0 145 88 148
Table 7 presents estimates of the coefficients of the model specified in equation 7 for the entire sample period from 2000 to 2016 and for each subset examined: the pre-crisis period from January 2000 to July 2007 (2000-2007:7) and the financial crisis period after August 2007 (2007:8-2016). Rows 7 to 14 indicate the number of estimated coefficients that present a positive or negative sign and for which it was possible to reject the null hypothesis. For example, 6 funds presented a positive estimate for the α parameter from 2000 to 2016, which was statistically significant with a confidence level of 95% or greater. The last four rows present the number of funds with α > 0, β2 > 0, γ1 > 0 and γ2 > 0. The p-value refers to the statistical significance of the mean values.
For the three periods reported in Table 7, the number of funds with a positive estimate for the γ1 coefficient was 156 (139 statistically significant), 159 (132 statistically significant) and 154 (142 statistically significant), respectively. Any fund displays negative estimates for the γ1 coefficient for the entire period and the pre-crisis period when considering a significance level of 1%. During the financial crisis period, the γ1 estimated coefficient is negative and statistically significant in 6 funds. These results suggest that the majority of European mutual fund managers follow similar portfolio management strategies. This phenomenon, termed ‗herd behaviour‘ by (Shiller, 2015, pp. 148-168) in behavioural finance literature, has been identified in several financial markets, notably in the Portuguese mutual fund industry by (Romacho & Cortez, 2006; Lobão & Serra, 2002) and in the Spanish stock market by (Agudo, Sarto, & Vicente, 2008).
Considering the entire sample period, 91 of the 163 funds in the sample achieved a significant and positive estimate for the γ2 coefficient and only 8 evidenced a significant and negative estimate, which denotes a superior market timing skill in relation to the common factor. In the pre-crisis period, we found statistically significant positive and negative estimates in 15 and 14 funds, respectively, and 128 and 7 funds exhibited statistically significant positive and negative estimates in the crisis period, respectively, reinforcing that the higher sensitivity in relation to the common factor was mainly observed in second period analysed.
The results of the test of specification and/or omission of relevant factor(s) allows for conclusions to be drawn that are in agreement with those reported in similar tests used by (Henriksson, 1984) or (Romacho & Cortez, 2006) regarding the North-American and Portuguese mutual fund industries, respectively. In the present study, the multifactor regression model given by equation 7, altered the estimates for the α and the β2 parameters calculated through the regression of the single-factor model specified in equation 2. This finding may indicate that the benchmark employed was not sufficiently representative of European mutual funds (Note 7) and/or that other relevant factors in addition to the market portfolio were omitted.
7. Conclusions
The empirical results reached using the models proposed by (Merton, 1981; Henriksson & Merton, 1981; Treynor & Mazuy, 1966) do not support the hypothesis that European fund managers have successfully developed strategies that anticipate market movements. Considering the period from January 2000 to December 2016, only 11 funds had positive and statistically significant estimates for the parameter disclosing market timing ability. Only one fund had a positive estimate (with an average of 0.367) for the market timing parameter in the two subsets. The division of the sample into two subsets aimed to isolate the effects of the international economic and financial crisis; we show that mutual fund managers exhibited negative selectivity capacities and positive market timing skills in the pre-crisis period and that the opposite was true in the period of the financial crisis. This finding is consistent with the idea that managers have more difficulty forecasting the market in periods of higher volatility in financial markets. However, 23 funds had a positive estimate for the market timing ability for both sub-periods.
The results of our study showed that the abnormal returns depicted by the (Jensen, 1968) model are negatively affected by the action of fund managers based on their predictions of market movements. This statement is valid for estimates generated using the (Henriksson & Merton, 1981; Treynor & Mazuy, 1966) models and is in agreement with the research by other authors such as (Chang & Lewellen, 1984; Henriksson, 1984; Lee & Rahman, 1990).
that fund managers should not take actions to time the market to achieve superior returns and that they should follow a simple buy-and-hold strategy. One issue that has been debated is the appropriateness of the data frequency used in the study. (Bollen & Busse, 2001) verified that the use of daily data improved the number of funds with positive and statistically significant market timing coefficients. Accordingly, the use of daily or high frequency data for European mutual fund returns could generate different results than those in our work; because we assume that fund managers are not frequent traders, low-frequency returns are not appropriate to measure their market timing abilities. Nevertheless our results are generally in agreement with those presented by other authors, including studies by (Henriksson, 1984; Chang & Lewellen, 1984; Treynor & Mazuy, 1966) and more recently by (Fletcher, 1995; Fung, Xu, & Yau, 2002; Philippas, 2002; Tripathy, 2005; Romacho & Cortez, 2006; Cuthbertson et al., 2010), possible explanations could be identified to explain the poor market timing performance.
First, the choice of benchmark could not be the correct one to use. (Dellva et al., 2001) found quite different results through analysis of the selectivity and market timing estimates with respect to three distinct indexes, which can indicate that the benchmark selection has the potential to incorporate biases in the estimates. Therefore, it could be interesting to use other indexes as the market portfolio as, although the funds in our sample are domiciled in Europe, we are not aware that they have geographical investment constraints. Because of a strong negative correlation that was observed between security selection and market timing abilities, we performed a test for specification and/or omission of relevant explanatory variables in the model specified in equation 2. The test allowed for validation of the hypothesis of the existence of a common risk factor for all funds; however, the estimates for the market timing ability of fund managers should be interpreted with caution because they were based on a single-factor model to simultaneously capture the effects of market timing and selectivity.
Second, the understanding of the flow‘s impact on fund investments. That is, the mutual fund managers will be forced to buy more when market did well just because the fund inflow. If the market condition is reversed, then it will ―mechanically‖ cause funds to exhibit no market timing power. Unfortunately, we do not have access to the funds‘ inflows/outflows during the time horizon to test if this really impact when it comes to fund managers‘ timing abilities. This issue could be a good lead to future research within the context of studying the market timing question.
References
Admati, A. R., Bhattacharya, S., Pfleiderer, P., & Ross, S. A. (1986). On timing and selectivity. Journal of
Finance, 41(3), 715-730. https://doi.org/10.1111/j.1540-6261.1986.tb04536.x
Agudo, L. F., Sarto, J. L., & Vicente, L. (2008). Herding behaviour in Spanish equity funds. Applied Economics
Letters, 15(7), 573-576. https://doi.org/10.1080/13504850600706974
Black, F., Jensen, M., & Scholes, M. (1972). The capital asset pricing model: Some empirical tests. In M. C. Jensen (Ed.), Studies in the Theory of Capital Markets. New York: Praeger Publishers Inc.
Blume, M. E., & Friend, I. (1973). A new look at the capital asset pricing model. Journal of Finance, 28, 19-33. https://doi.org/10.1111/j.1540-6261.1973.tb01342.x
Bollen, N. P. B., & Busse, J. A. (2001). On the timing ability of mutual fund managers. Journal of Finance,
56(3), 1075-1094. https://doi.org/10.1111/0022-1082.00356
Bollen, N. P. B., & Busse, J. A. (2005). Short-term persistence in mutual fund performance. Review of Financial
Studies, 18(2), 569-597. https://doi.org/10.1093/rfs/hhi007
Borri, N., & Cagnazzo, A. (2018). The performance of market-timing strategies of Italian mutual fund investors. Economic Notes. Review of Banking, Finance and Monetary Economics, 47(1), 5-20. https://doi.org/10.1111/ecno.12093
Breush, T. S. (1978). Testing for autocorrelation in dynamic linear models. Australian Economic Papers, 17(31), 334-355. https://doi.org/10.1111/j.1467-8454.1978.tb00635.x
Carhart, M. M. (1997). On persistence in mutual fund performance. Journal of Finance, 52(1), 57-82. https://doi.org/10.1111/j.1540-6261.1997.tb03808.x
Chang, E. C., & Lewellen, W. G. (1984). Market timing and mutual fund investment performance. The Journal
of Business, 57(1), 57-72. https://doi.org/10.1086/296224
Chen, C. R., & Stockum, S. (1986). Selectivity, market timing, and random beta behaviour of mutual funds: A generalized model. The Journal of Financial Research, 9(1), 87-96.
https://doi.org/10.1111/j.1475-6803.1986.tb00437.x
Cortez, M. C., Silva, F., & Areal, N. (2012). Socially Responsible Investing in the Global Market: The Performance of US and European Funds. International Journal of Finance & Economics, 17(3), 254-271. https://doi.org/10.1002/ijfe.454
Cuthbertson, K., Nitzsche, D., & O‘Sullivan, N. (2010a). Mutual Fund Performance: Measurement and Evidence.
Financial Markets, Institutions & Instruments, 19(2), 95-187. https://doi.org/10.1111/j.1468-0416.2010.00156.x
Cuthbertson, K., Nitzsche, D., & O‘Sullivan, N. (2010b). The market timing ability of UK mutual funds. Journal
of Business Finance and Accounting, 37(1-2), 270-289. https://doi.org/10.1111/j.1468-5957.2009.02157.x
Dellva, W. L., DeMaskey, A. L., & Smith, C. A. (2001). Selectivity and market timing performance of fidelity sector mutual funds. The Financial Review, 36, 39-54. https://doi.org/10.1111/j.1540-6288.2001.tb00003.x Fama, E. F. (1972). Components of investment performance. Journal of Finance, 27(3), 551-567.
https://doi.org/10.1111/j.1540-6261.1972.tb00984.x
Fama, E. F., & French, K. R. (1993). Common risk factors in the returns on stocks and bonds. Journal of
Financial Economics, 33(1), 3-56. https://doi.org/10.1016/0304-405X(93)90023-5
Ferreira, M. A., Keswani, A., Miguel, A. F., & Ramos, S. B. (2013). The determinants of mutual fund performance: A cross-country study. Review of Finance, 17(2), 483-525. https://doi.org/10.1093/rof/rfs013 Ferson, W. E., & Schadt, R. W. (1996). Measuring fund strategy and performance in changing economic
conditions. Journal of Finance, 51(2), 425-461. https://doi.org/10.1111/j.1540-6261.1996.tb02690.x Fletcher, J. (1995). An examination of the selectivity and market timing performance of UK unit trusts. Journal
of Business Finance & Accounting, 22(1), 143-156. https://doi.org/10.1111/j.1468-5957.1995.tb00676.x
Friesen, G. C., & Sapp, T. R. A. (2007). Mutual fund flows and investor returns: An empirical examination of fund investor timing ability. Journal of Banking and Finance, 31(9), 2796-2816. https://doi.org/10.1016/j.jbankfin.2007.01.024
Fung, H. G., Xu, X. E., & Yau, J. (2002). Global hedge funds: Risk, return, and market timing. Financial
Analysts Journal, 58(6), 19-30. https://doi.org/10.2469/faj.v58.n6.2483
Godfrey, L. G. (1978). Testing against general autoregressive and moving average error models when the regressors include lagged dependent variables. Econometrica, 46(6), 1293-1301. doi:10.2307/1913829. Grinblatt, M., & Titman, S. (1989a). Portfolio performance evaluation: Old issues and new insights. The Review
of Financial Studies, 2(3), 393-421. https://doi.org/10.1093/rfs/2.3.393
Grinblatt, M., & Titman, S. (1989b). Mutual fund performance: An analysis of quarterly portfolio holdings. The
Journal of Business, 62(3), 393-416. https://doi.org/10.1086/296468
He, W., Cao, B., & Baker, H. K. (2015). The performance and market timing ability of Chinese mutual funds.
Financial Services Review, 24(3), 289-311.
Henriksson, R. D. (1984). Market timing and mutual fund performance: An empirical investigation. The Journal
of Business, 57(1), 73-96. https://doi.org/10.1086/296225
Henriksson, R. D., & Merton, R. C. (1981). On market timing and investment performance. II. Statistical Procedures for Evaluating Forecasting Skills. The Journal of Business, 54(4), 513-533. https://doi.org/10.1086/296144
Jensen, M. C. (1968). The performance of mutual funds in the period 1945-1964. Journal of Finance, 23(2), 389-416. https://doi.org/10.1111/j.1540-6261.1968.tb00815.x
Jensen, M. C. (1969). Risk, the pricing of capital assets, and the evaluation of investment portfolios. The Journal
of Business, 42(2), 167-247. https://doi.org/10.1086/295182
Jensen, M. C. (1972). Optimal utilization of market forecasts and the evaluation of investment performance. In G. P. S. and K. Shell (Ed.), Mathematical Methods in Finance. Amsterdam: North-Holland Publishing Company.
Jiang, W. (2003). A nonparametric test of market timing. Journal of Empirical Finance, 10(4), 399-425. https://doi.org/10.1016/S0927-5398(02)00065-8
and market timing. International Review of Finance, 15(3), 283-320. https://doi.org/10.1111/irfi.12055 Klemkosky, R. C., & Maness, T. S. (1978). The predictability of real portfolio risk levels. Journal of Finance,
33(2), 631-639. https://doi.org/10.1111/j.1540-6261.1978.tb04873.x
Lee, C., & Rahman, S. (1990). Market timing, selectivity, and mutual fund performance: An empirical investigation. The Journal of Business, 63(2), 261-278. https://doi.org/10.1086/296505
Leite, P., & Cortez, M. C. (2015). Performance of European socially responsible funds during market crises: Evidence from France. International Review of Financial Analysis, 40, 132-141. https://doi.org/10.1016/j.irfa.2015.05.012
Liao, L., Zhang, X., & Zhang, Y. (2018). Mutual fund managers' timing abilities. Pacific-Basin Finance Journal,
44(C), 80-96.
Lobão, J., & Serra, A. P. (2002). Herding behaviour: Evidence from Portuguese mutual funds. In Proceedings of
the 2nd Conference of the Portuguese Finance Network, Working Paper, March 2002, Faculdade de
Economia do Porto, Universidade do Porto.
Merton, R. C. (1981). On market timing and investment performance. I. An equilibrium theory of value for market forecasts. The Journal of Business, 54(3), 363-406. https://doi.org/10.1086/296137
Newey, W. K., & West, K. D. (1987). A simple, positive semi-definite, heteroskedasticity and autocorrelation consistent covariance matrix. Econometrica, 55(3), 703-708. https://doi.org/10.2307/1913610
Pfleiderer, P., & Bhattacharya, S. (1983). A note on performance evaluation. Technical Report no. 174, Graduate School of Business, Stanford University. Stanford, California.
Philippas, N. (2002). Market timing and selectivity: An empirical investigation into the features of Greek mutual fund managers. The Journal of Applied Business Research, 18(3), 97-108. https://doi.org/10.19030/jabr.v18i3.2143
Romacho, J. C., & Cortez, M. C. (2006). Timing and selectivity in Portuguese mutual fund performance.
Research in International Business and Finance, 20(3), 348-368. https://doi.org/10.1016/j.ribaf.2005.05.005
Shiller, R. J. (2015). Irrational exuberance: Revised and Expanded (3rd ed.). New Jersey: Princeton University Press. https://doi.org/10.1515/9781400865536
Tchamyou, A. S., Asongu, S. A. & Nwachukwu, J. C. (2018). Effects of asymmetric information on market timing in the mutual fund industry. International Journal of Managerial Finance, 14(5), 542-557. https://doi.org/10.1108/IJMF-09-2017-0187
Treynor, J., & Mazuy, K. (1966.) Can mutual funds outguess the market? Harvard Business Review, 44(4), 131-136.
Tripathy, N. P. (2005). An empirical evaluation of market timing abilities of Indian fund managers on equity linked savings scheme. Delhi Business Review, 6(2), 19-27.
White, H. (1980). A heteroskedasticity-consistent covariance matrix estimator and a direct test for heteroskedasticity. Econometrica, 48(4), 817-838. https://doi.org/10.2307/1912934
Notes
Note 1. The concept of market timing is founded on the deliberate action of fund managers to change the risk levels of their portfolios by investing in risky or riskless securities or in higher or lower beta stocks. For an in-depth analysis of this subject, see, for instance (Klemkosky & Maness, 1978; Kon & Jen, 1979).
Note 2. See (Admati, Bhattacharya, Pfleiderer, & Ross, 1986; Grinblatt & Titman, 1989a) for relevant contributions on the distinction of the selection and market timing abilities in terms of the performance evaluation of fund managers.
Note 3. The (Chen & Stockum, 1986) model is similar to that of (Treynor & Mazuy, 1966) except that it allows for a time-varying beta parameter.
Note 4. (Chang & Lewellen, 1984, pp. 60-61) show that if the market timing component is captured, estimates for the αp parameter produced by equation 1 incorporate biases, which can overestimate the timing abilities of the most able fund managers to predict the evolution of the market or underestimate the capacities of the less able
managers to forecast market movements.
Note 5. The total expense ratio, the ratio between the total fees and the net asset value of the funds, was used to estimate the management costs. This information was retrieved from the Lipper for Investment Management (Lipper IM) database. The commission fees were considered when it was not possible to retrieve this information. For both the total expense ratio and the commission fees, the value assumed for each fund was the historical mean value disclosed in the database for each fund in the sample.
Note 6. (Ferreira et al., 2013) found a monthly average estimate of –0.01% for the α parameter in the period 1997 to 2007 for investment funds from 14 European countries using the (Carhart, 1997) four-factor model.
Note 7. The choice of benchmark has been identified as a possible cause for the poor market timing estimates presented in most studies. For more detailed information on this subject check (Grinblatt & Titman, 1989a).
Copyrights
Copyright for this article is retained by the author(s), with first publication rights granted to the journal.
This is an open-access article distributed under the terms and conditions of the Creative Commons Attribution license (http://creativecommons.org/licenses/by/4.0/).